
Eos – Incorporating Observatory Data into Oceanography Courses
(From Eos / Kristin Hunter-Thomson, Sage Lichtenwalner, and Janice McDonnell)
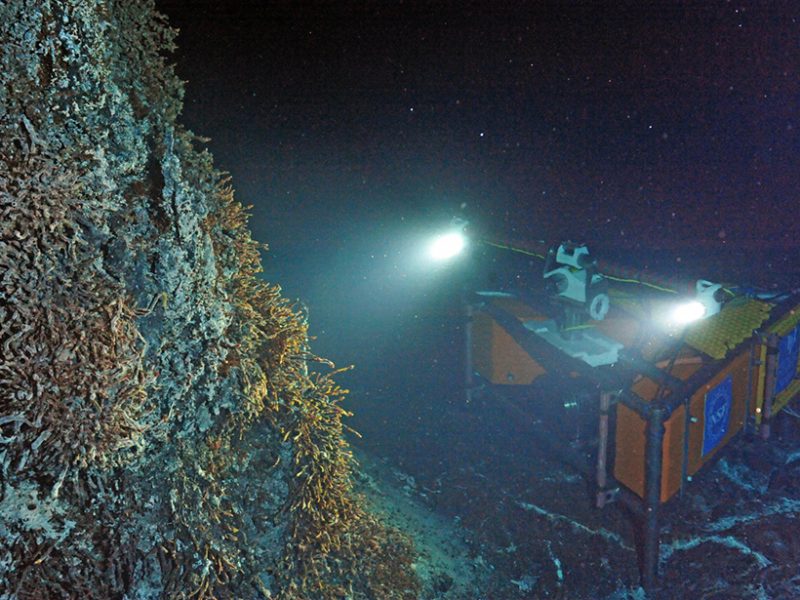
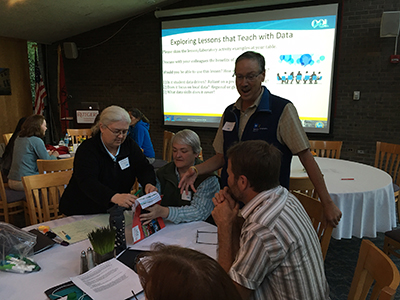
A new high-definition camera installed at a hydrothermal vent along the Juan de Fuca Ridge streams live imagery more than 480 kilometers back to shore from a depth of more than 1,500 meters. The vent is named “Mushroom” and is in the caldera of the ridge’s Axial Seamount, located off the Pacific Northwest coast of North America. Two workshops at Rutgers University focused on using ocean observatory data as an undergraduate teaching tool. Credit: NSF-OOI/UW/ISS [/caption]
OOI Teaching with Data Workshops; New Brunswick, New Jersey, 19–21 May 2017 (chemistry) and 2–4 June 2017 (geology)
The Data Explorations Project hosted two Ocean Observatories Initiative (OOI) Teaching with Data workshops in spring 2017. Community college and university professors interested in increasing their use of observatory data with early undergraduate students came from 10 states to participate. Our team of researchers, science education specialists, and data scientists from Rutgers University and the University of California, Berkeley, hosted this workshop with the goal of providing tools to help professors overcome hurdles to using online data in the classroom. Attendees explored research-based ways to teach with data, pilot tested data-based activities predeveloped by the Data Explorations team, and planned how to integrate these activities into instruction.
The provided interactive activities—Data Explorations—merge oceanographic data from the National Science Foundation’s OOI, data visualization theory, user interface design, and current research on learning. These online student-centered activities elicit student questions, explanations, and discussions of concepts covered in introductory courses and are linked to a highly used textbook (Essentials of Oceanography, 12th edition), enabling easy adoption nationally.
Textbooks often use idealized illustrations to highlight concepts, but the real world rarely matches these idealized patterns. Therefore, workshop attendees explored the use of real-world observation data to enrich students’ understanding of the concepts and to provide supplemental context for understanding the patterns in their textbook diagrams. Such opportunities are important for students who do not have the ability to collect their own data and for looking at data from broader spatial and temporal scales than would be typical of the data that students collect during field trips and laboratory projects. Participants also discussed the challenges of helping students with cognitive transitions between working with idealized and real-world data.
The focus of the workshops was twofold: discuss and experience strategies for teaching with data to support greater understanding of the concepts and explore predeveloped activities using OOI-related data sets. During the workshops, professors took on the role of students to experience firsthand the Data Explorations and to better understand how students would perceive the teaching strategies being demonstrated. Each workshop was bookended with discussions about active learning strategies; how to design active learning experiences (e.g., microlabs, concept maps); and The Learning Cycle, which organizes instruction around what is known about how people learn.
Twenty participants across the geology- and chemistry-focused workshops developed implementation plans for the 2017–2018 academic year to meet the needs of their students (e.g., face to face) and their course setup needs (e.g., hybrid) most appropriately. Most professors will integrate these activities as active parts of their lectures or as laboratory exercises. Their feedback will contribute to the further development of effective practices for integrating online data into undergraduate teaching.
Participants expressed positive initial impressions of the activities, saying that the activities will help improve students’ data skills and understanding of associated science concepts. They also reported a substantial increase in their confidence for teaching with online data.
Through the workshops and Data Explorations activities, more undergraduates will be able to use online data in accessible ways. Faculty interested in using these activities can learn more by reading the instructor’s guides on OOI’s Collections page.
The workshops were run by the authors and Catherine Halversen, University of California, Berkeley. The project is funded by the National Science Foundation (grants OCE-1550207, OCE-1649637).
Read Full Article