Putting Data Explorations to Work in Classrooms
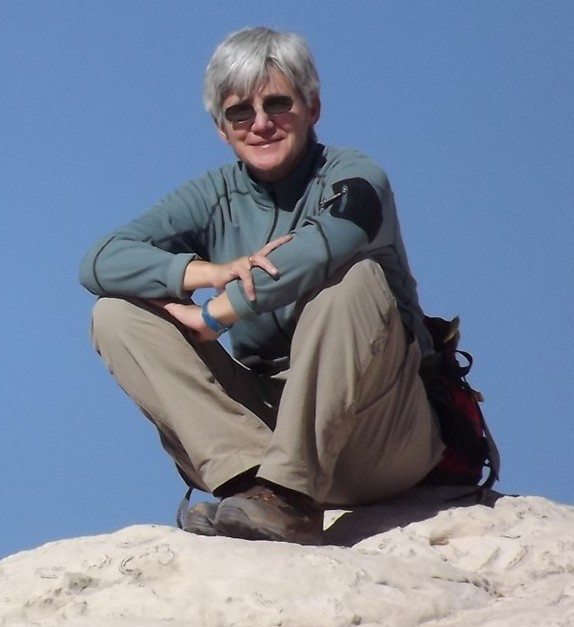
It all started with an email blast advertising a workshop offering opportunities to develop new lessons using OOI data. By happenstance, the workshop was right down the street from Kathleen Browne’s office at Rider University in Lawrenceville, New Jersey, making it convenient for her to attend. Sponsored by the National Science Foundation-funded OOI Ocean Data Labs at Rutgers University of New Jersey, the workshop’s focus on “data explorations” meshed nicely with Browne’s long held involvement in advancing science education plans for both higher ed and K-12 teachers. Browne teaches oceanography and served as academic director of Rider’s Science Education and Literacy Center, which works to advance K-12 and college math and science instructors’ use of inquiry-based instruction.
“Since I have been involved in a whole suite of science education lesson plans and I teach oceanography, it seemed like a unique and worthwhile opportunity, “ she explained.
Little did Browne expect that a five-day workshop would lead to her becoming an integral part of the OOI Ocean Data Labs network. She and Gabriela Smalley, a colleague in Rider’s Geological, Environmental and Marine Sciences Department (which Browne chairs) and colleagues from Maine Maritime Academy (Lauren Sahl), University of Kentucky (Rebecca Freeman), Southern Maine Community College (Carol White), and Rutgers (Sage Lichtenwaler) created an OOI data exploration on ocean anoxic events. Browne and Smalley have since also contributed to a new lab manual created by the Ocean Data Labs. Browne created labs in geology, while Smalley contributed labs on primary production and biology.
The pandemic has changed the way Browne is considering classroom instruction. “I’m in the midst of rethinking how I teach labs, particularly given all I’ve learned in these days of remote instruction. It’s hard to teach an oceanography lab remotely when students are clearly looking for something different than what we can do remotely. I imagine, for example, we might use the intro labs in the lab notebook in the beginning of the semester because we are finding that students really need focused guidance on describing patterns in data sets before they can make sense of the results.
“Students struggle with understanding data. But, the need for data analysis is not limited to science. It’s important in politics, health care, and most aspects of life today. We live in a world where an enormous amount of data is presented to us daily. It’s not that everyone needs to process that data, but they do need to at least make sense of the data visualizations that might be offered. It’s my hope that my students can do that so they might be able to recognize when something doesn’t make sense. I’d like my students to be better consumers of data, and skeptics of data so they are not misled.”
Browne‘s interest in the business of students struggling to describe patterns in data has prompted a project to figure out the best instructional ways to help students develop data literacy skills to improve their scientific explanation skills. She teamed with Smalley, Andrea Drewes, a learning scientist in Rider’s Graduate Education, Leadership and Counseling department, and Sage Lichtenwaler, a lead investigator and data wrangler with Ocean Data Labs, on a recently funded NSF project. The project will assess students’ data and science literacy skills — that is understanding the scientific principles involved. The project will use a variety of techniques and resources, including the Ocean Data Lab’s data explorations.
“Our approach will be to help students develop their data literacy skills such as the ability to read a graph correctly and identify and articulate in detail the patterns and trends that they see in the data. With those skills refined we will help to help students learn the science in our courses so they are able to explain something they learned about the data and the science using scientific evidence and reasoning.”
The effectiveness of this approach will be tested in two different classroom settings. One will serve as a control, while the other will integrate tools and instruction to help students work with data visualizations. Ultimately, the team will assess the learning gains in the control and intervention classes. Successful techniques identified will be shared broadly with science instructors, learning scientists, and other educational researchers throughout the nation to improve data literacy among U.S. students.
Browne and her team will begin the formal data collection this fall and expect to report their findings in 2023. “My work with OOI data and the Ocean Data Labs has opened up new avenues of exploration for me, and ultimately will help students’ abilities to use data and science literacy skills to contribute as active citizens to pressing ocean-related issues in the world.”

