
A Bountiful Sea of Data: Making Echosounder Data More Useful
Oceanographer Wu-Jung Lee and data scientist Valentina Staneva, at the University of Washington, teamed up to tackle the challenge in a multidisciplinary approach to analyze the vast amounts of data generated by echosounders on Ocean Observatories Initiative (OOI) arrays. Their findings were published in The Journal of the Acoustical Society of America, where they proposed a new methodology that uses machine learning to parse out noisy outliers from rich echosounder datasets and to summarize large volumes of data in a compact and efficient way.
This new methodology will help researchers use data from long time series and extract dominant patterns and trends in sonar echoes to allow for better interpretation of what is happening in the water column.
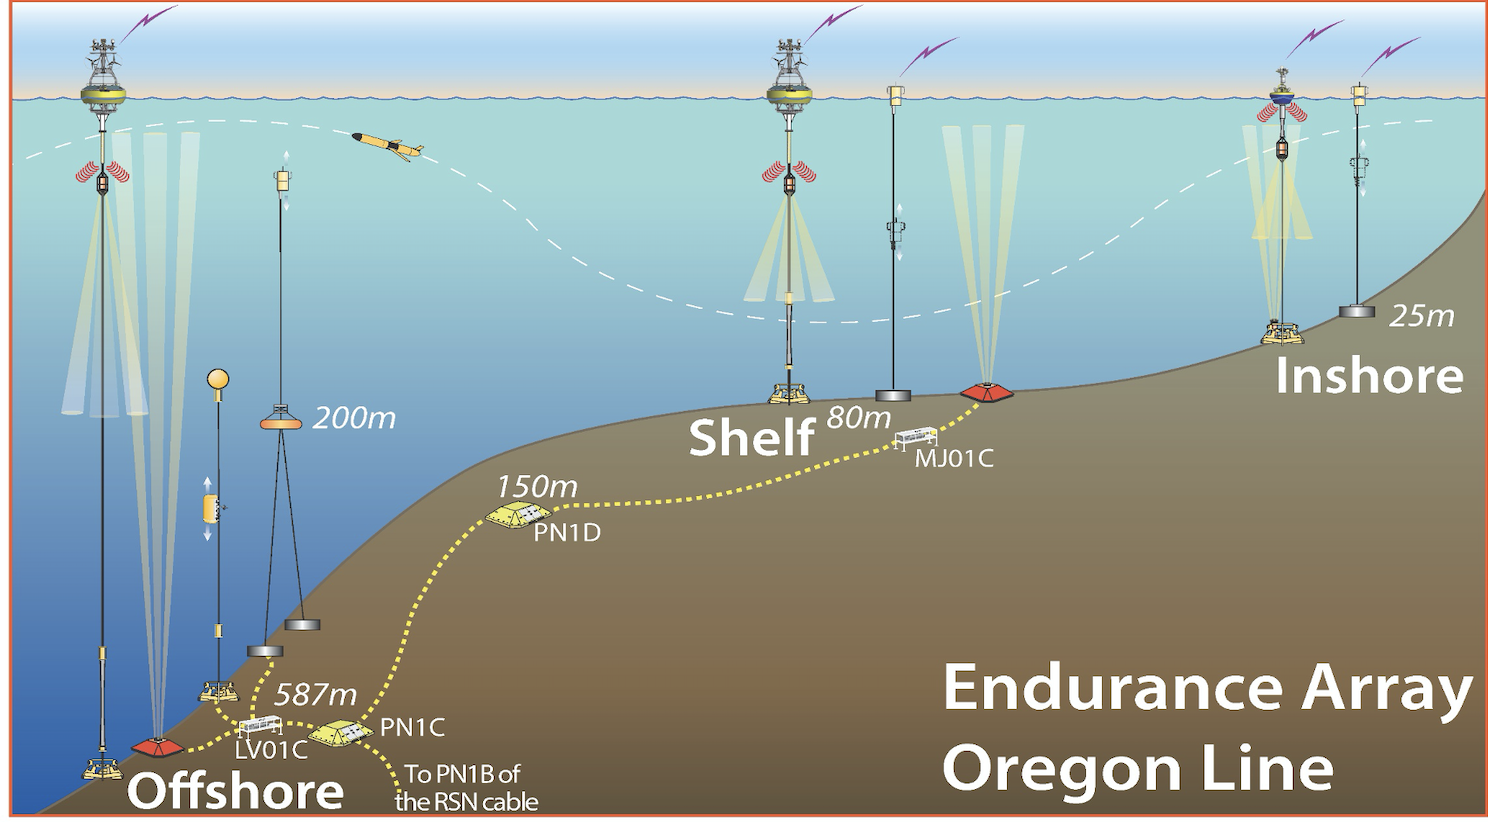
The ocean is highly dynamic and complex at the Oregon Offshore site of the OOI Coastal Endurance Array, where echosounder data from a cabled sonar were used in this paper. At this site, zooplankton migrate on a diurnal basis from a few hundred meters to the surface, wind-stress curl and offshore eddies interact with the coastal circulation, and a subsurface undercurrent moves poleward. The echosounder data offer opportunities to better understand the animals’ response to immediate environmental conditions and long-term trends. During the total eclipse of the Sun in August 2017, for example, echosounders captured the zooplankton’s reaction to the suddenly dimmed sunlight by moving upwards as if it was dusk time for them to swim toward the surface to feed (Barth et al, 2018).
Open access of echosounder datasets from the OOI arrays offers researchers the potential to study trends that occur over extended stretches of time or space. But commonly these rich datasets are underused because they require significant processing to parse out what is important from what is not.
Echosounders work by sending out pulses of sound waves that bounce off objects. Based on how long it takes for the reflected echo to come back to the sensor, researchers can determine the distance of the object. That data can be visualized as an echogram, an image similar to an ultrasound image of an unborn baby.
But unlike an ultrasound of a baby, when an undersea acoustic sensor records a signal, it may be a combination of signals from different sources. For example, the signal might be echoes bouncing off zooplankton or schools of fish.
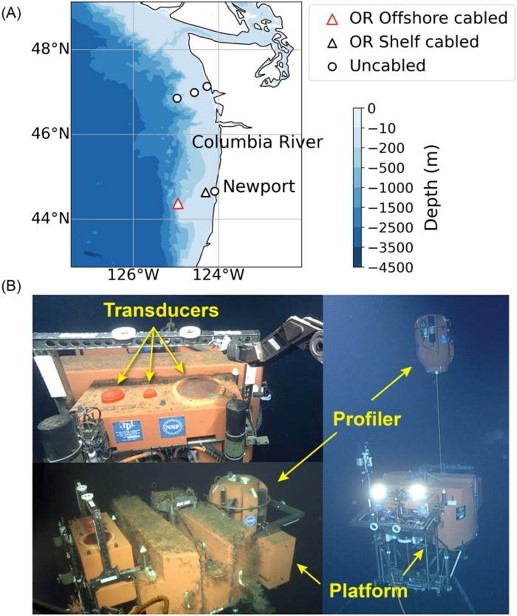
(A) Data used in this work were collected by a three-frequency echosounder installed on a Regional Cabled Array Shallow Profiler mooring hosting an underwater platform (200 m water depth) and profiler science pod located at the Oregon Offshore site of the OOI Coastal Endurance Array (red triangle). The symbols indicate the locations of all OOI echosounders installed along the coast of Oregon and Washington. (B) The transducers are integrated into the mooring platform (from left to right: 120, 200, and 38 kHz). The platform also hosts an instrumented profiler that traverses the water column above the echosounder from ~ 200 m to ~ 5m beneath the ocean’s surface. (Image credit: UW/NSF-OOI/WHOI-V15).
“When the scatterers are of different size, they will reflect the sound at different frequencies with different strengths,” said Lee. “So, by looking at how strong an echo is at different frequencies, you will get an idea of the range of sizes that you are seeing in your echogram.”
Current echogram analysis commonly requires human judgement and physics-based models to separate the sources and obtain useful summary statistics. But for large volumes of data that span months or even years, that analysis can be too much for a person or small group of researchers to handle. Lee and Staneva’s new methodology utilizes machine learning algorithms to do this inspection automatically.
“Instead of having millions of pixels that you don’t know how to interpret, machine learning reduces the dataset to a few patterns that are easier to analyze,” said Staneva.
Machine learning ensures that the analysis will be data-driven and standardized, thus reducing the human bias and replicability challenges inherently present in manual approaches.
“That’s the really powerful part of this type of methodology,” said Lee. “To be able to go from the data-driven direction and say, what can we learn from this dataset if we do not know what may have happened in a particular location or time period.”
Lee and Staneva hope that by making the echosounder data and analytical methods open access, it will improve the democratization of data and make it more usable for everybody, even those who do not live by the ocean.
In the future, they plan to continue working together and use their new methodology to analyze the over 1000 days of echosounder data from the OOI Endurance Coastal and Regional Cabled Array region.
References
Lee, W-J and Staneva, V (2021).Compact representation of temporal processes in echosounder time series via matrix decomposition. Special Issue on Machine Learning in Acoustics. The Journal of the Acoustical Society of America.
Barth JA, Fram JP, et al. (2018). Warm Blobs, Low-Oxygen Events, and an Eclipse: The Ocean Observatories Initiative Endurance Array Captures Them All.Oceanography, Vol 31.
McDermott, J (2009). The Cocktail Party Problem.Current Biology, Vol 19, Issue 22.
Cherry EC (1953). Some Experiments on the Recognition of Speech, with One and Two Ears.The Journal of the Acoustical Society of America. Vol. 25, No.5.