
Expanding Reach of OOI Data

Pioneer Array data is now available on NERACOOS’ new Mariner’s Dashboard. This is but one example of how OOI data are integrated into other data repositories to maximize their benefit and use.
OOI shares data with partner repositories and institutions that host similar data but have different user bases. These partnerships expand the data available for forecasting models, help provide insight into current ocean conditions, and serve as important resources for many ranging from fishers and other maritime users to land-based researchers and students.
With the exception of the Station Papa Array, the OOI Coastal and Global Arrays maintain surface buoys. Instruments deployed on these buoys measure meteorological variables such as air temperature, barometric pressure, northward and eastward wind velocities, precipitation, solar radiation, and surface water properties of sea surface temperature and salinity. Other instruments on the moorings collect wave data, such as significant wave height, period, and direction. These data are then consumed by national and regional networks to improve accuracy of weather forecasting models.
The Regional Cabled Array (RCA) consists of fiber-optic cables off the Oregon coast that provide power, bandwidth, and communication to seafloor instrumentation and moorings with instrumented profiling capabilities. A diverse array of geophysical, chemical, and biological sensors, a high-definition camera, and digital still cameras on the seafloor and mooring platforms, provide real-time information on processes operating on and below the seafloor and throughout the water column, including recording of seafloor eruptions, methane plume emissions and climate change. These data are available for community use. Since 2015, the RCA has fed data into Incorporated Research Institutions for Seismology (IRIS), the primary source for data related to earthquakes and other seismic activity. In addition, data including zooplankton sonar data, are being utilized within the Pangeo ecosystem for community visualization and access and pressure data are incorporated into NOAA’s operational tsunami forecasting system.
Helping Improve Models and Forecasting
One of the recipients of OOI data is the National Data Buoy Center (NDBC), part of the National Oceanic and Atmospheric Administration’s (NOAA) National Weather Service. NDBC maintains a data repository and website, offering a range of standardized real-time and near real-time meteorological data. Data such as wind speed and direction, air and surface water temperature, and wave height and direction are made available to the broader oceanographic and meteorological community.
“Many researchers go to NDBC for their data, “said Craig Risien, a research associate with OOI’s Endurance Array and Cyberinfrastructure Teams, who helps researchers gain access to and use OOI data. “NBDC is a huge repository of data and it’s easy to access. So there’s a low barrier for researchers and students who are looking for information about wind speed, water temperature and a slew of other data. OOI contributing to this national repository significantly increases its data reach, allowing OOI data to be used by as many people as possible. “
OOI sea surface temperature data also make their way into the operational Global Real-Time Ocean Forecast System (RTOFS) at the National Centers for Environmental Prediction (NCEP), another part of NOAA’s National Weather Service. RTOFS ingests sea surface temperature and salinity data from all available buoys into the Global Telecommunications System (GTS). OOI glider data also are pushed in near real-time to the US Integrated Ocean Observing System Glider Data Assembly Center (DAC). From there, the data goes to the GTS where it can be used by the operational modeling centers such as NCEP and the European Centre for Medium-Range Weather Forecasts.
The GTS is like a giant vacuum sucking up near real-time observations from all sorts of different platforms deployed all over the world. On a typical day, the GTS ingests more than 7,600 data points from fixed buoys alone. As a result of this vast input, researchers can go to the GTS, pull available data, and assimilate that information into any model to improve its prediction accuracy.
Advancing Forecasting of Submarine Eruptions
As the first U.S. ocean observatory to span a tectonic plate, RCA’s data are an invaluable contributor to IRIS’s collection. Since 2015, the user community has downloaded >20 Terabytes of RCA seismometer data from the IRIS repository. Fourteen different sampling locations include key sites at Axial Seamount on the Juan de Fuca mid-ocean ridge spreading center, near the toe of the Cascadia Margin and Southern Hydrate Ridge. RCA data are catalogued and available on the IRIS site, using the identifier “OO.”
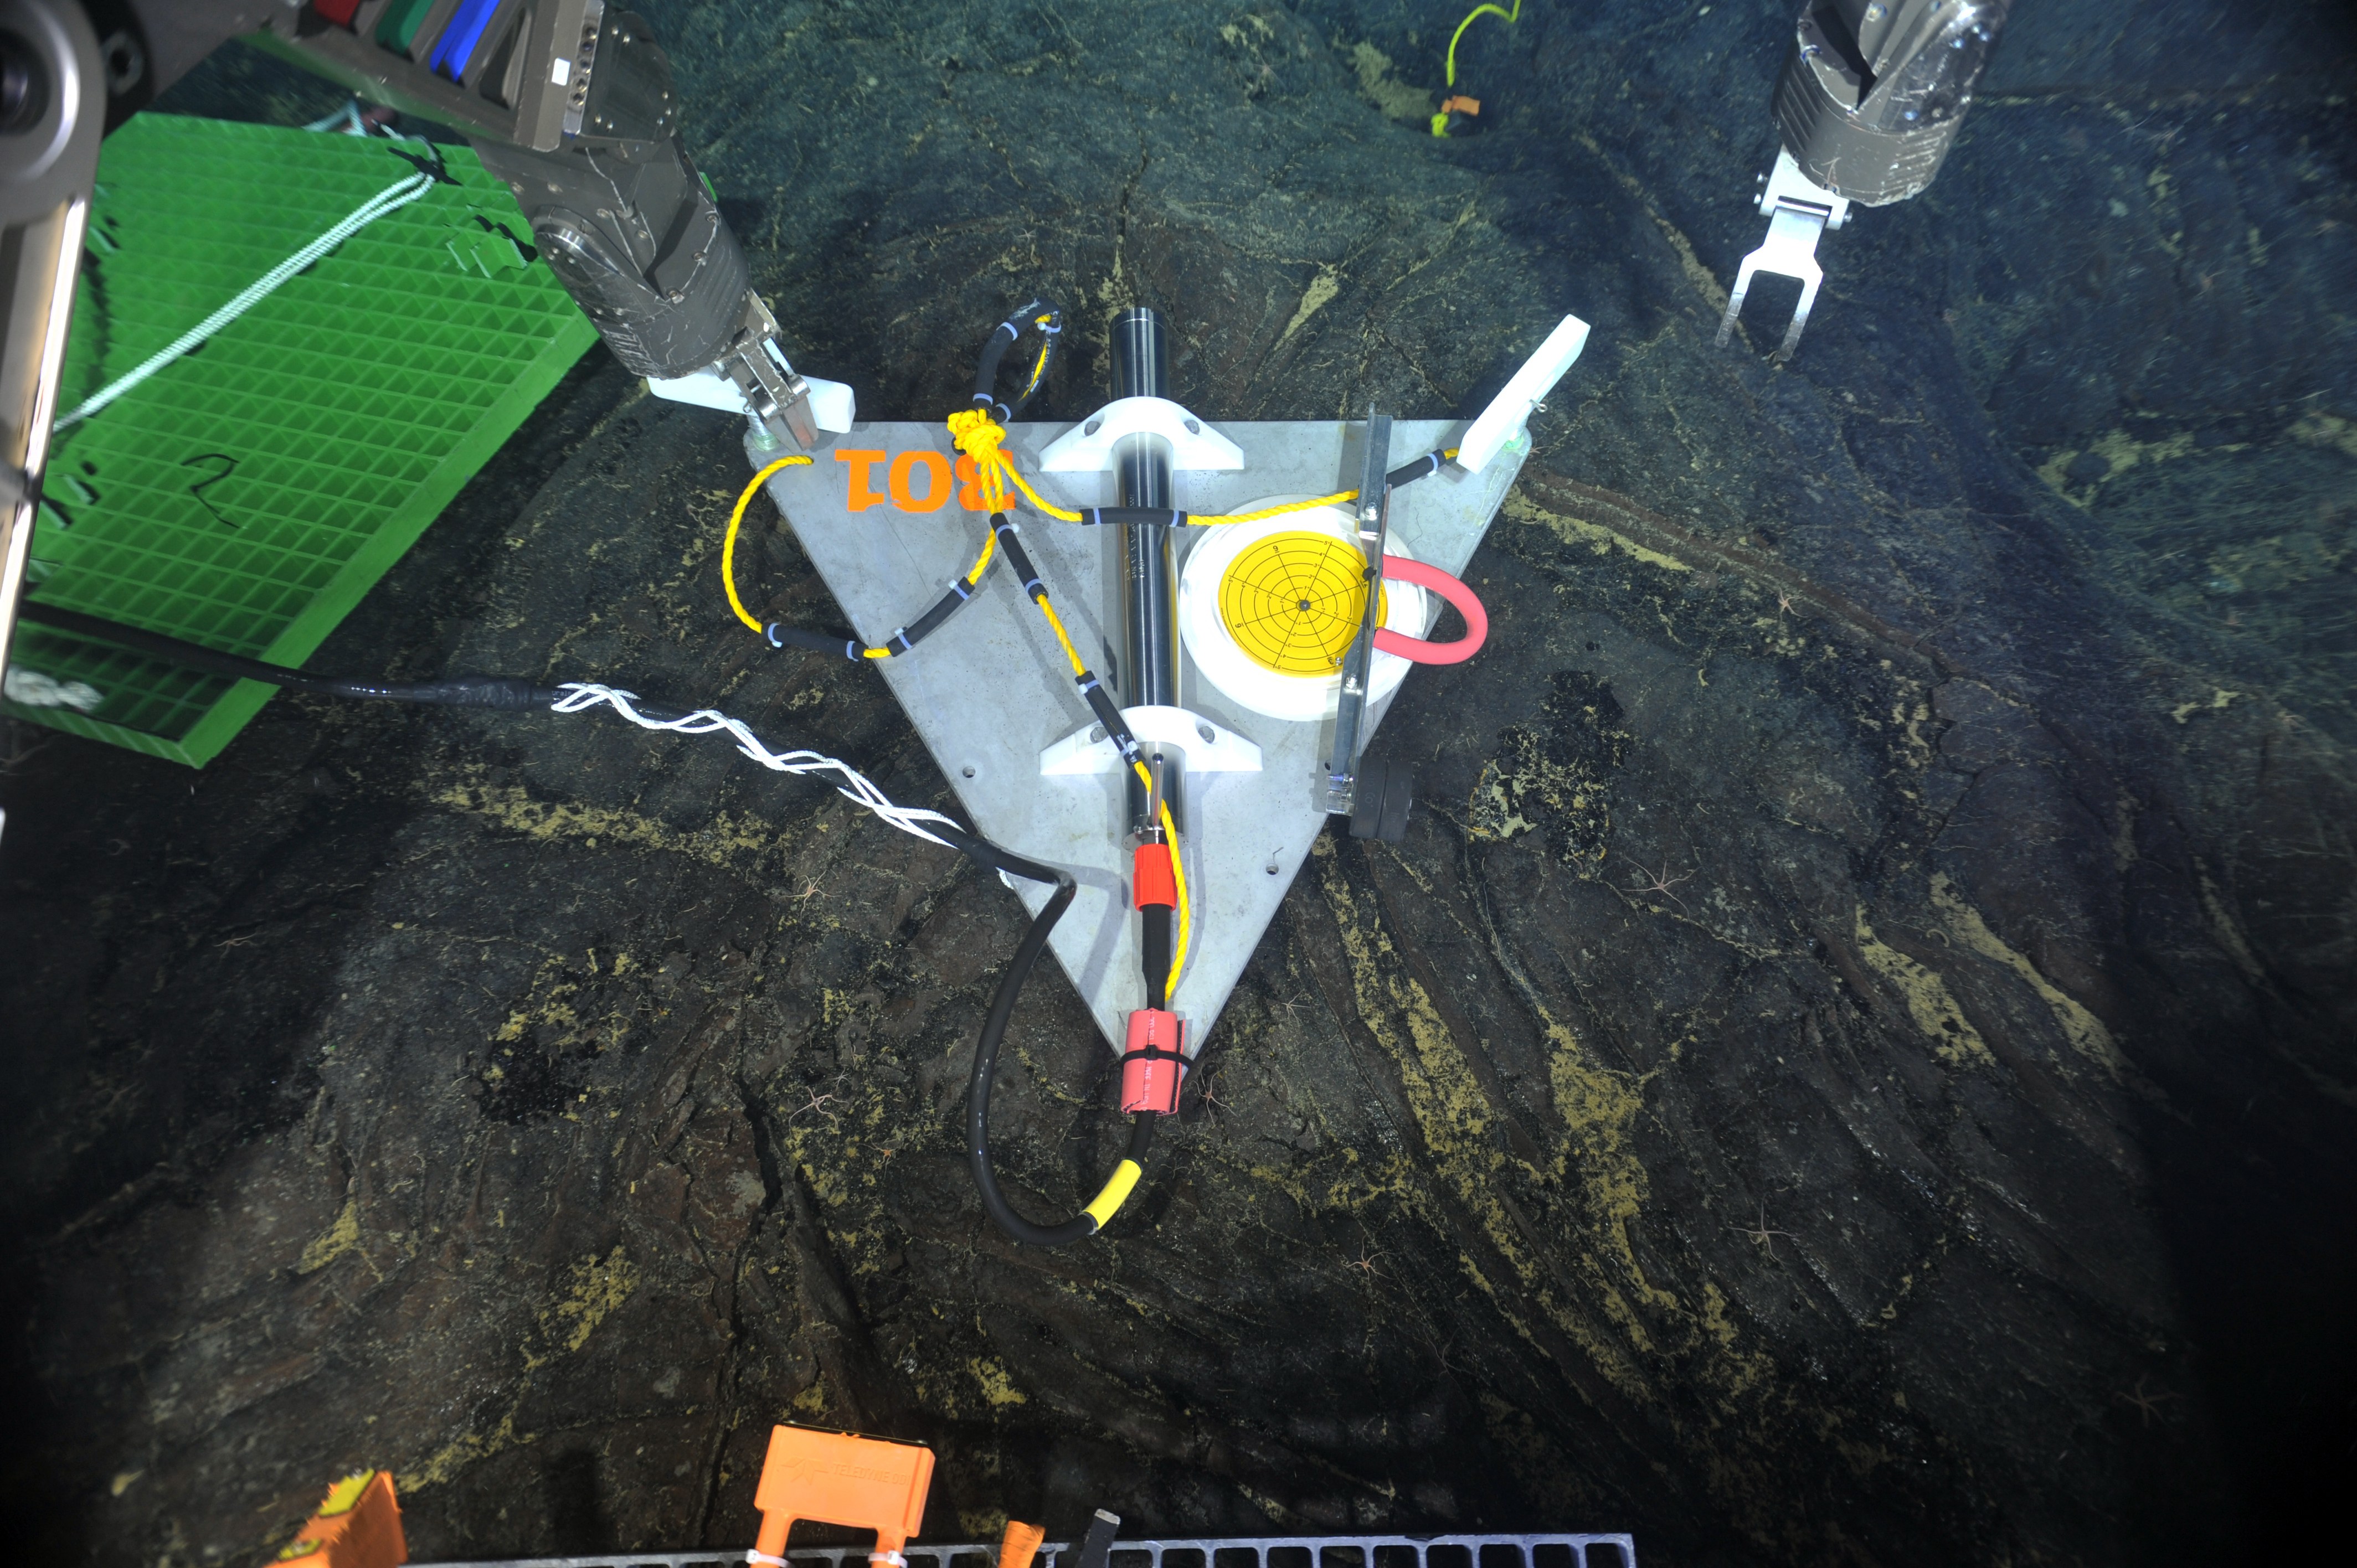
Data from short period seismometers installed at RCA’s Axial Seamount and Southern Hydrate Ridge sites are streamed live to IRIS. Credit: UW/NSF-OOI/Canadian Scientific Submersible Facility, V13.
“RCA is a critical community resource for seismic data. Axial Seamount, for example, which erupted in 1998, April 2011, was the site of more than 8,000 earthquakes over a 24-hour period April 24, 2015 marking the start of large eruption,” explained Deb Kelley, PI of the RCA. “Being able to witness and measure seismic activity in real time is providing scientists with invaluable insights into eruption process, which along with co-registered pressure measurements is making forecasting possible of when the next eruption may occur. We are pleased to share data from this volcanically and hydrothermally active seamount so researchers the world over can use it to better understand processes happening at mid ocean ridges and advance forecasting capabilities for the first time of when a submarine eruption may occur.”
Providing Data with Regional Implications
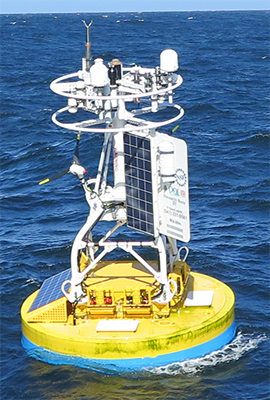
Data from Endurance Array buoy 46100 are fed into WCOFS, where they are accessible to maritime users. Credit: OSU
OOI also provides data to regional ocean observing partners. Data from two Endurance Array buoys (46099 and 46100), for example, are fed into a four-dimensional U.S. West Coast Operational Forecast System (WCOFS), which serves the maritime user community. WCOFS generates water level, current, temperature and salinity nowcast and forecast fields four times per day. The Coastal Pioneer Array is within the future Northeastern Coast Operational Forecast System (NECOFS). Once operational, Pioneer’s observations will potentially be used for WCOFS data assimilation scenario experiments.
Coastal Endurance Array data are shared with the Northwest Association of Networked Ocean Observing Systems (NANOOS), which is part of IOOS, and the Global Ocean Acidification Observing Network (GOA-ON). Endurance data are ingested by the NANOOS Visualization System, which provides easy access to observations, forecasts, and data visualizations. Likewise, for GOA-ON, the Endurance Array provides observations useful for measuring ocean acidification.
Data from three of the Pioneer Array buoys also are part of the Mariners’ Dashboard, a new ocean information interface at the Northeastern Regional Association of Coastal Ocean Observing Systems (NERACOOS). Visitors can use the Dashboard to explore the latest conditions and forecasts from the Pioneer Inshore (44075), Central (44076), and Offshore (44077) mooring platforms, in addition to 30+ other observing platforms throughout the Northeast.
“We are working hard to distribute the OOI data widely through engagement with multiple partners, which together are helping inform science, improve weather and climate forecasts, and increase understanding of the ocean,” added Al Plueddemann, PI of the Coastal and Global Scale Nodes, which include the Pioneer, Station Papa, and Irminger Sea Arrays.