
Assessment of OOI Endurance Array pCO2 Data Quality
Given the significant importance of understanding and modeling levels of carbon dioxide in our atmosphere (and its potential sources and sinks), Ocean-Atmosphere Exchange and Global Biogeochemistry and Carbon Cycling are two of the OOI’s primary science themes. We address these themes in part through measurements of the air and surface water partial pressure of carbon dioxide (pCO2). Chris Wingard, the OOI Endurance Array Data Lead, recently completed an in-depth assessment of pCO2 data returned during the first four years of Endurance Array operations. These measurements were made using the Pro-Oceanus CO2-ProTM Atmosphere pCO2 sensor. By measuring the partial pressure of CO2 gas in both the air and surface water, researchers can estimate estimate surface flux of CO2 using data from this instrument. 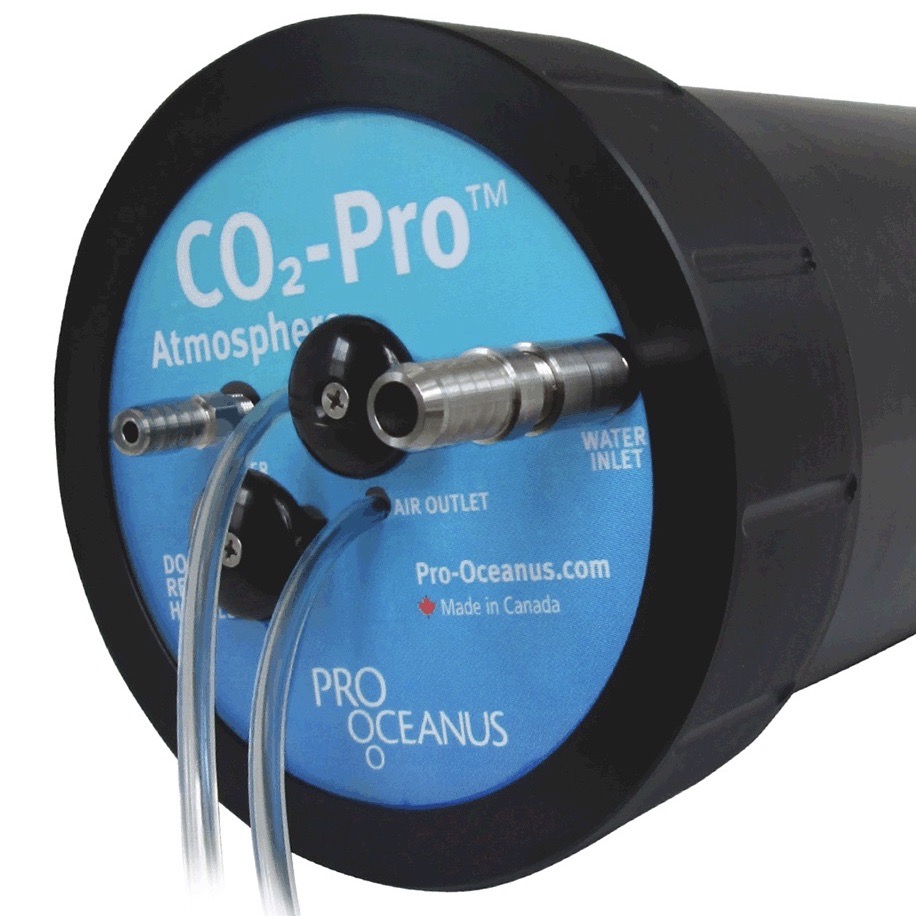
Wingard developed a protocol based on cross-comparisons of overlapping deployments of this sensor, comparing these with independent shipboard pCO2 measurements (including CTD samples and samples taken underway using flow-thru systems), and externally sourced air and surface water pCO2 measurements (e.g. from the LDEO Underway Database). This array of sampling techniques served to confirm the quality and scientific applicability of the Endurance Array pCO2 measurements.
He reported the results of this assessment at a poster session at the recent Ocean Sciences 2020 meeting held this past February in San Diego, CA. The protocol is largely applicable to the same suite of measurements made using the Pro-Oceanus sensor on moorings deployed in the OOI Pioneer, Irminger Sea, Southern Ocean, and Argentine Basin Global Arrays. The MATLAB code and data used to download, process, merge, and cross-compare the data used in this assessment are available online for use.
Both the air and surface water measurements and the flux estimates used in this assessment are available through the OOI Data Portal. Endurance Array air and surface water pCO2 measurements are made at four locations distributed across the Oregon and Washington shelf and slope within the northern California Current Marine Ecosystem.
Other sources of Endurance Array-specific data include the most recent 60 days of the Endurance Array’s air and surface water pCO2 data are available on the NANOOS Visualization System (NVS) and the Global Ocean Acidification Observing System Data Portal (GOA-ON).
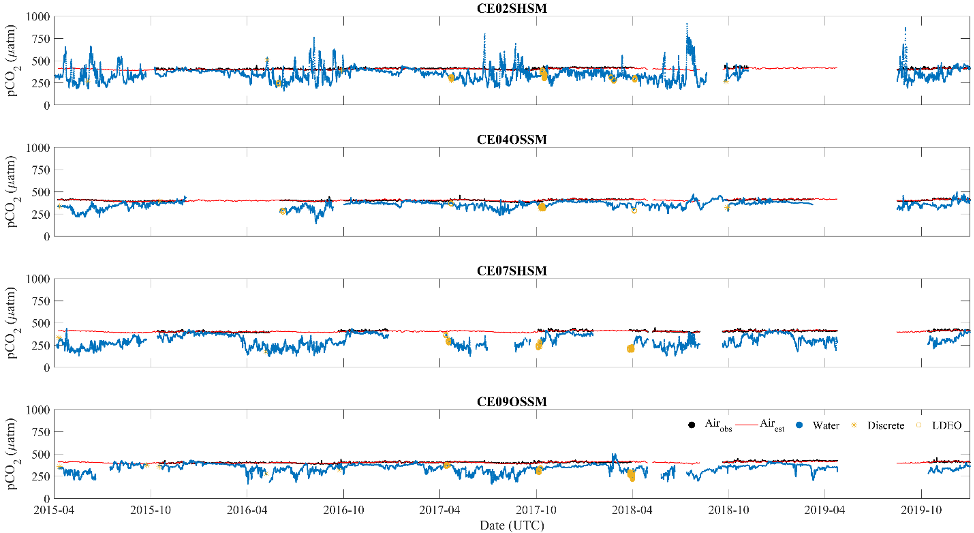
Figure 1: Surface water (•) and air pCO2 (•, observed and —, array average) measurements from 2015-04-01 through 2019-12-31 for the four moorings. The plots also show the distribution of discrete sample (*) and LDEO V2018 (O) data that coincide with each mooring. The data plotted have had human-in-the-loop (HITL) QC flags applied to remove points marked as suspect or failed. Beyond smoothing the data records and the estimation of an array averaged air pCO2 (—), no further corrections were applied to the data. Note the high degree of variability during the summer months in the surface water pCO2 measurements for CE02SHSM, which are similar to other observations made on the Oregon Shelf (Evans et al., 2011).
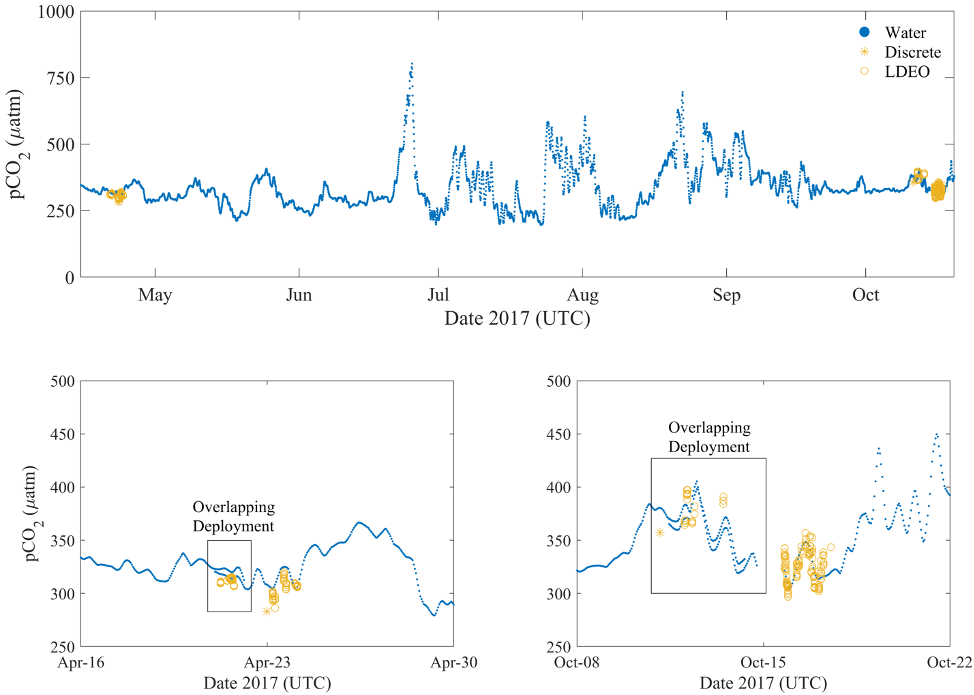
Figure 2: Focused view (upper panel) of the Spring 2017 deployment (#5) of CE02SHSM showing the observed offsets between the surface water pCO2 measurements (•) and the discrete samples (*) and LDEO V2018 (O). Detailed views in the lower two panels, provide a better picture of the observed offsets during the periods of over-lapping deployments; between deployments 4 and 5 (lower left) and deployments 5 and 6 (lower right). Prior to using the OOI pCO2A data, users are strongly encouraged to conduct such cross-comparisons. The independent measurements obtained by the separate systems, and the close agreement between them, provide measures of confidence in the accuracy and applicability of the data.