Quality Control
Delivering Data That You Can Rely On
All of our data quality control procedures were designed with the goal of meeting the U.S. Integrated Ocean Observing System (IOOS) Quality Assurance of Real Time Ocean Data (QARTOD) quality control standards. We also conduct daily human-in-the-loop quality control (QC) tests as data streams are collected, and run data products through multiple automated QC algorithms to ensure data are reliable so OOI data can be used in research and in classrooms. To learn more, click on a link below.
If a user identifies an issue with an OOI data product or has a question about QC procedures, please contact the Data Team through the HelpDesk. We will do our best to correct any identified deficiencies.
Quality Control Goals
OOI instrument deployment and data quality control procedures were designed to meet the following U.S. Integrated Ocean Observing System (IOOS) Quality Assurance of Real Time Ocean Data (QARTOD) quality control standards:
- Every real-time observation must be accompanied by a quality descriptor
- All observations should be subject to automated real-time quality tests
- Quality flags and test descriptions must be described in the metadata
- Observers should verify / calibrate sensors before deployment
- Observers should describe methods / calibration in real-time metadata
- Observers should quantify level of calibration accuracy and expected error
- Manual checks on automated procedures, real-time data collected, and status of observing system must be provided on an appropriate timescale
We also conduct daily human-in-the-loop quality control (QC) tests as data streams are collected, and run data products through multiple automated QC algorithms to ensure data are reliable so they can be used in research and in classrooms. To learn more, click on a link below.
QARTOD
What is QARTOD?
As part of the ongoing OOI effort to improve data quality, OOI is implementing the Quality Assurance of Real-Time Oceanographic Data (QARTOD) on an instrument-by-instrument basis. Led by the United States Integrated Ocean Observing System (U.S. IOOS), the QARTOD effort draws on the broad oceanographic observing community to provide manuals for different instrument classes (e.g. salinity, pH, or waves), which outline best practices and identify tests for evaluating data quality. A common code-base is available on GitHub and actively maintained by IOOS partner Axiom Data Science.
OOI has committed to implementing available QARTOD tests where appropriate. QARTOD is well-documented and actively maintained with an engaged user-base across multiple data collection and repository programs. It has a publicly available code-base with standardized tests and flag definitions that result in simplified, easy-to-interpret results. However, some instruments deployed by OOI, such as seismic sensors and multispectral sensors, are not well-suited towards QARTOD. For instruments for which there is no existing QARTOD manual, such as seawater pCO2, OOI is implementing “QARTOD-like” quality control (QC).
How are QARTOD results communicated?
QARTOD utilizes a standardized data-flagging scheme, where each data point for an evaluated variable (e.g. salinity) receives one of the following flags: 1 if the data point passed the test; 2 if a test was not evaluated; 3 if the data point is either suspect or interesting/unusual; 4 if the data point fails the test; 9 if the data point is missing.
In interpreting the flag designations, it is important to consider that a flag of 3 does not necessarily mean a data point is bad – it could also mean something interesting or unusual occurred that resulted in the given data point being outside of the expected test threshold. Climatology test data are an exception to the data-flagging scheme. Climatology test data are simply classified as “pass” or “suspect.”
Importantly, QARTOD only flags data, it does not remove data. In fact, OOI is committed to delivering all available data; the goal is to provide further information on the possible quality of the data.
How is QARTOD implemented by OOI?
OOI is prioritizing implementation of QARTOD on instruments and variables which are shared across arrays and with broad or high scientific interest, such as CTDs, seawater pH and pCO2, dissolved oxygen, and chlorophyll/fluorescence. OOI is currently implementing the gross range and climatology tests (see this article for a more detailed description of the specific implementation). Note that the climatology test is a site-specific seasonally varying range test and not a World Ocean Atlas-like climatology. These two tests, in addition to other tests under development, utilize thresholds and ranges which are calculated from existing OOI datasets. The code used to calculate the thresholds is publicly available at the oceanobservatories ooi-data-explorations github repository and resulting threshold tables are available at the oceanobservatories qc-lookup github repository. The tests executed and results are added to the datasets as variables named _qartod_results and _qartod_executed, with the relevant tested data variable name prepended (e.g. practical_salinity would be practical_salinity_qartod_results and practical_salinity_qartod_executed). The _qartod_executed variable is a list of the individual results of each of the tests applied stored as a string. The tests applied and the order in which they were applied are stored in the variable metadata attributes. The _qartod_results provide a summary result of all the tests applied.
What is the current OOI QARTOD status?
The IOOS QARTOD manuals define the tests for each instrument class as “Required,” “Recommended,” and “Suggested”. The OOI priority will be the “Required” tests for each instrument class in use by OOI. “Recommended” and “Suggested” test development will be reviewed, with the support of subject matter experts, in the future. The IOOS QARTOD manuals can be found at Quality Assurance/Quality Control of Real Time Oceanographic Data – The U.S. Integrated Ocean Observing System (IOOS).
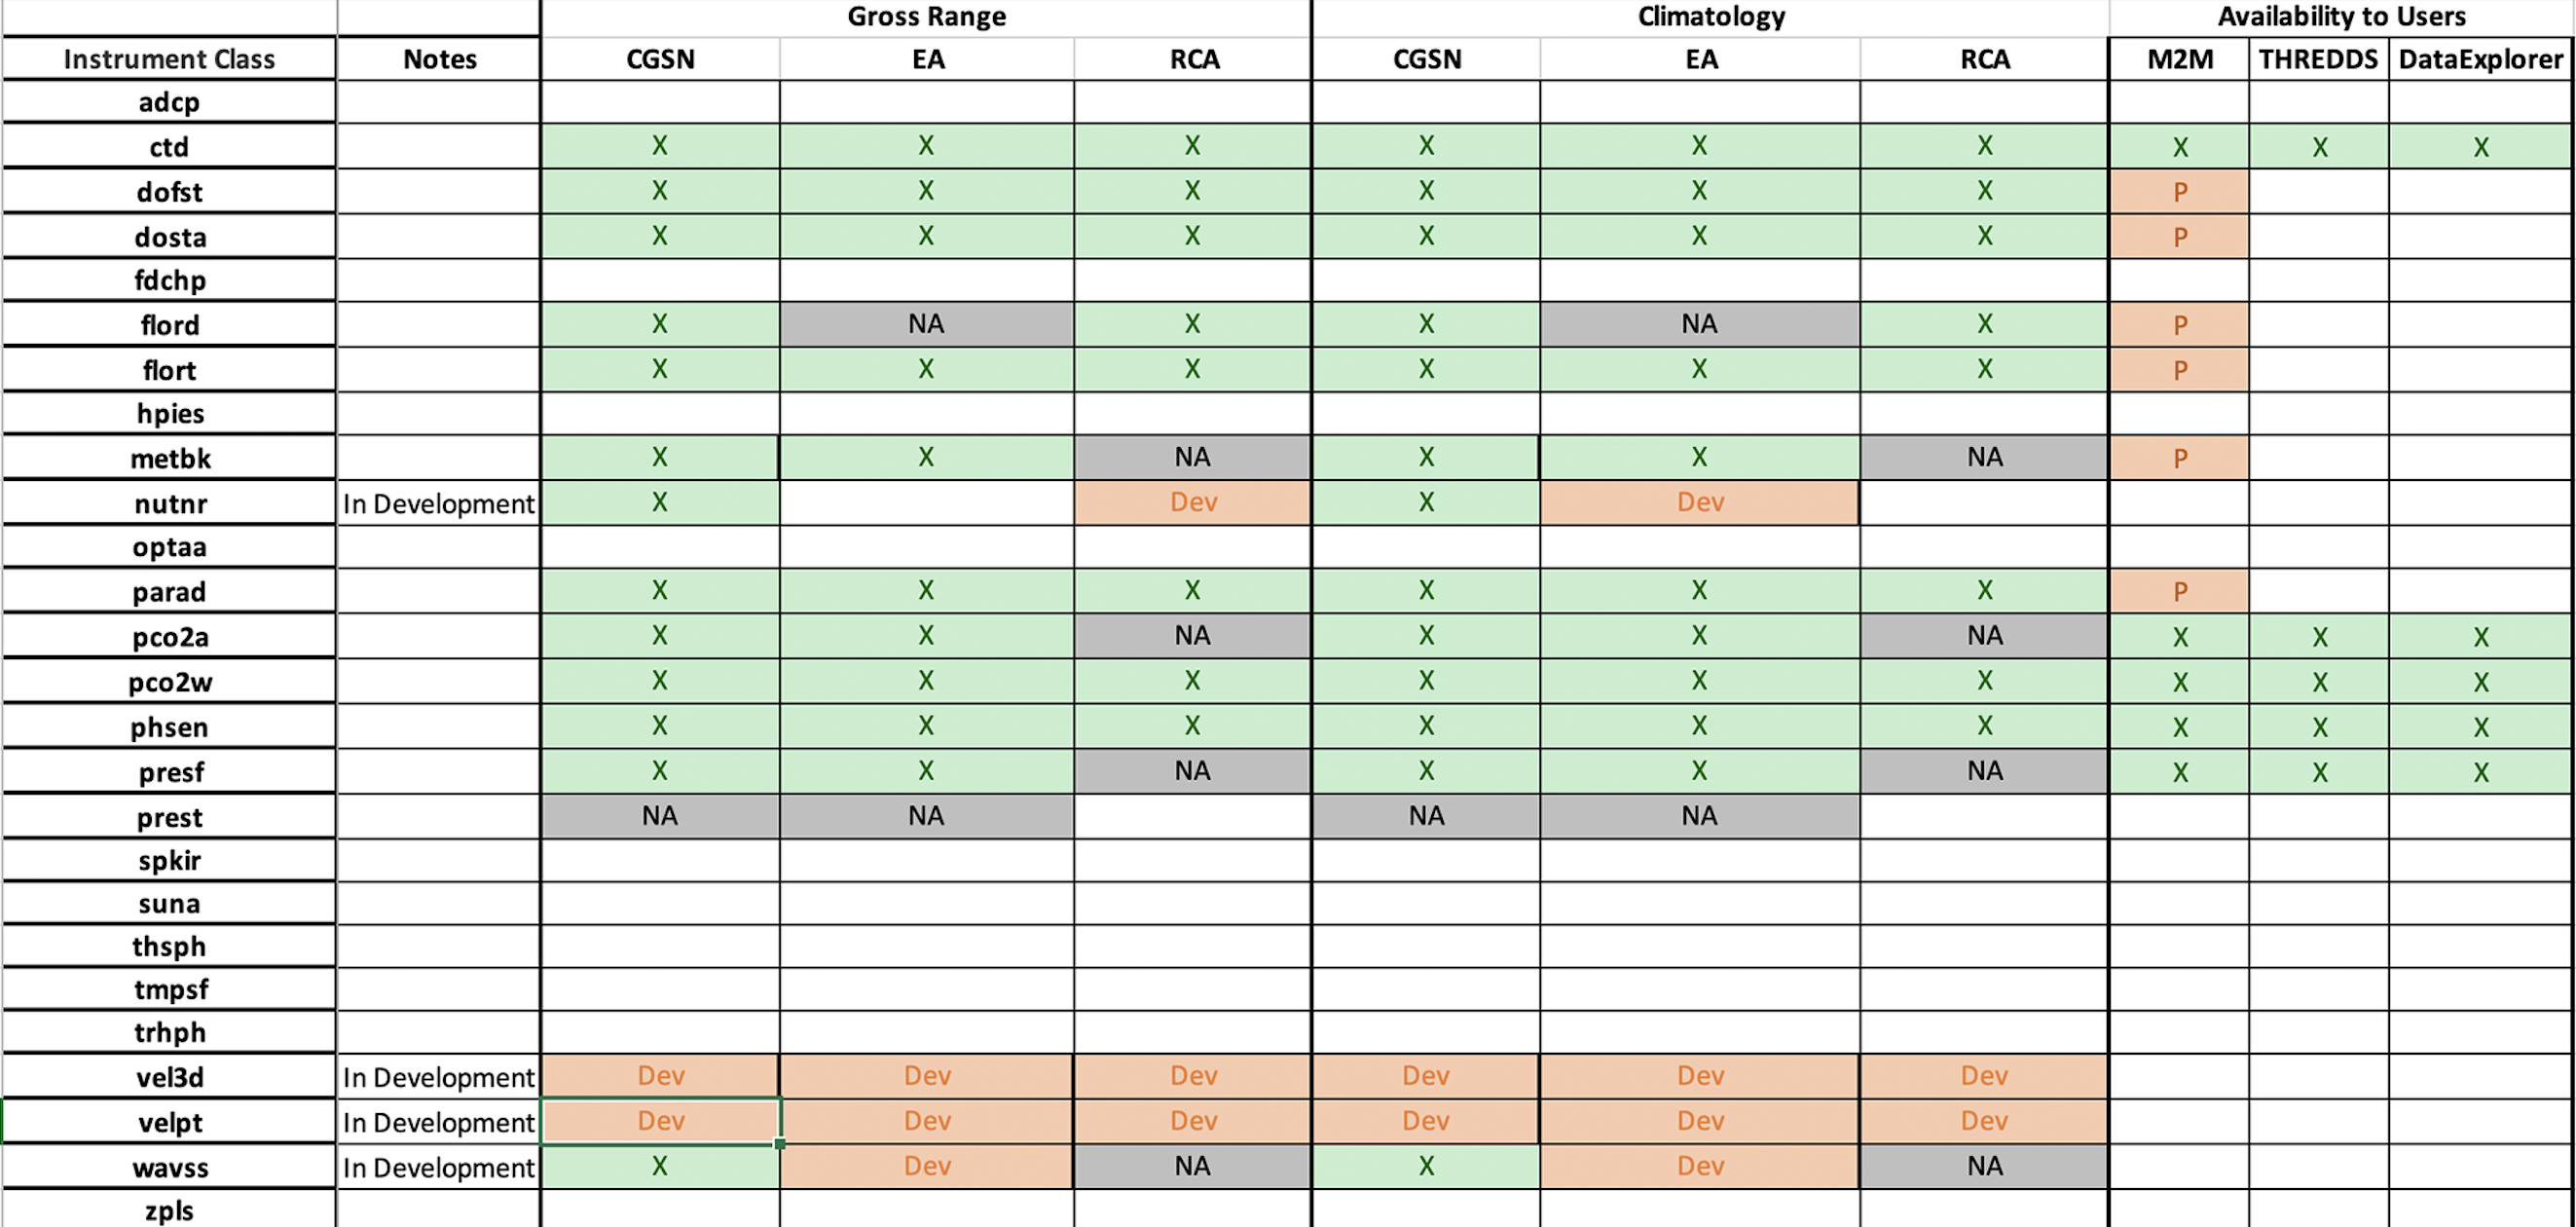
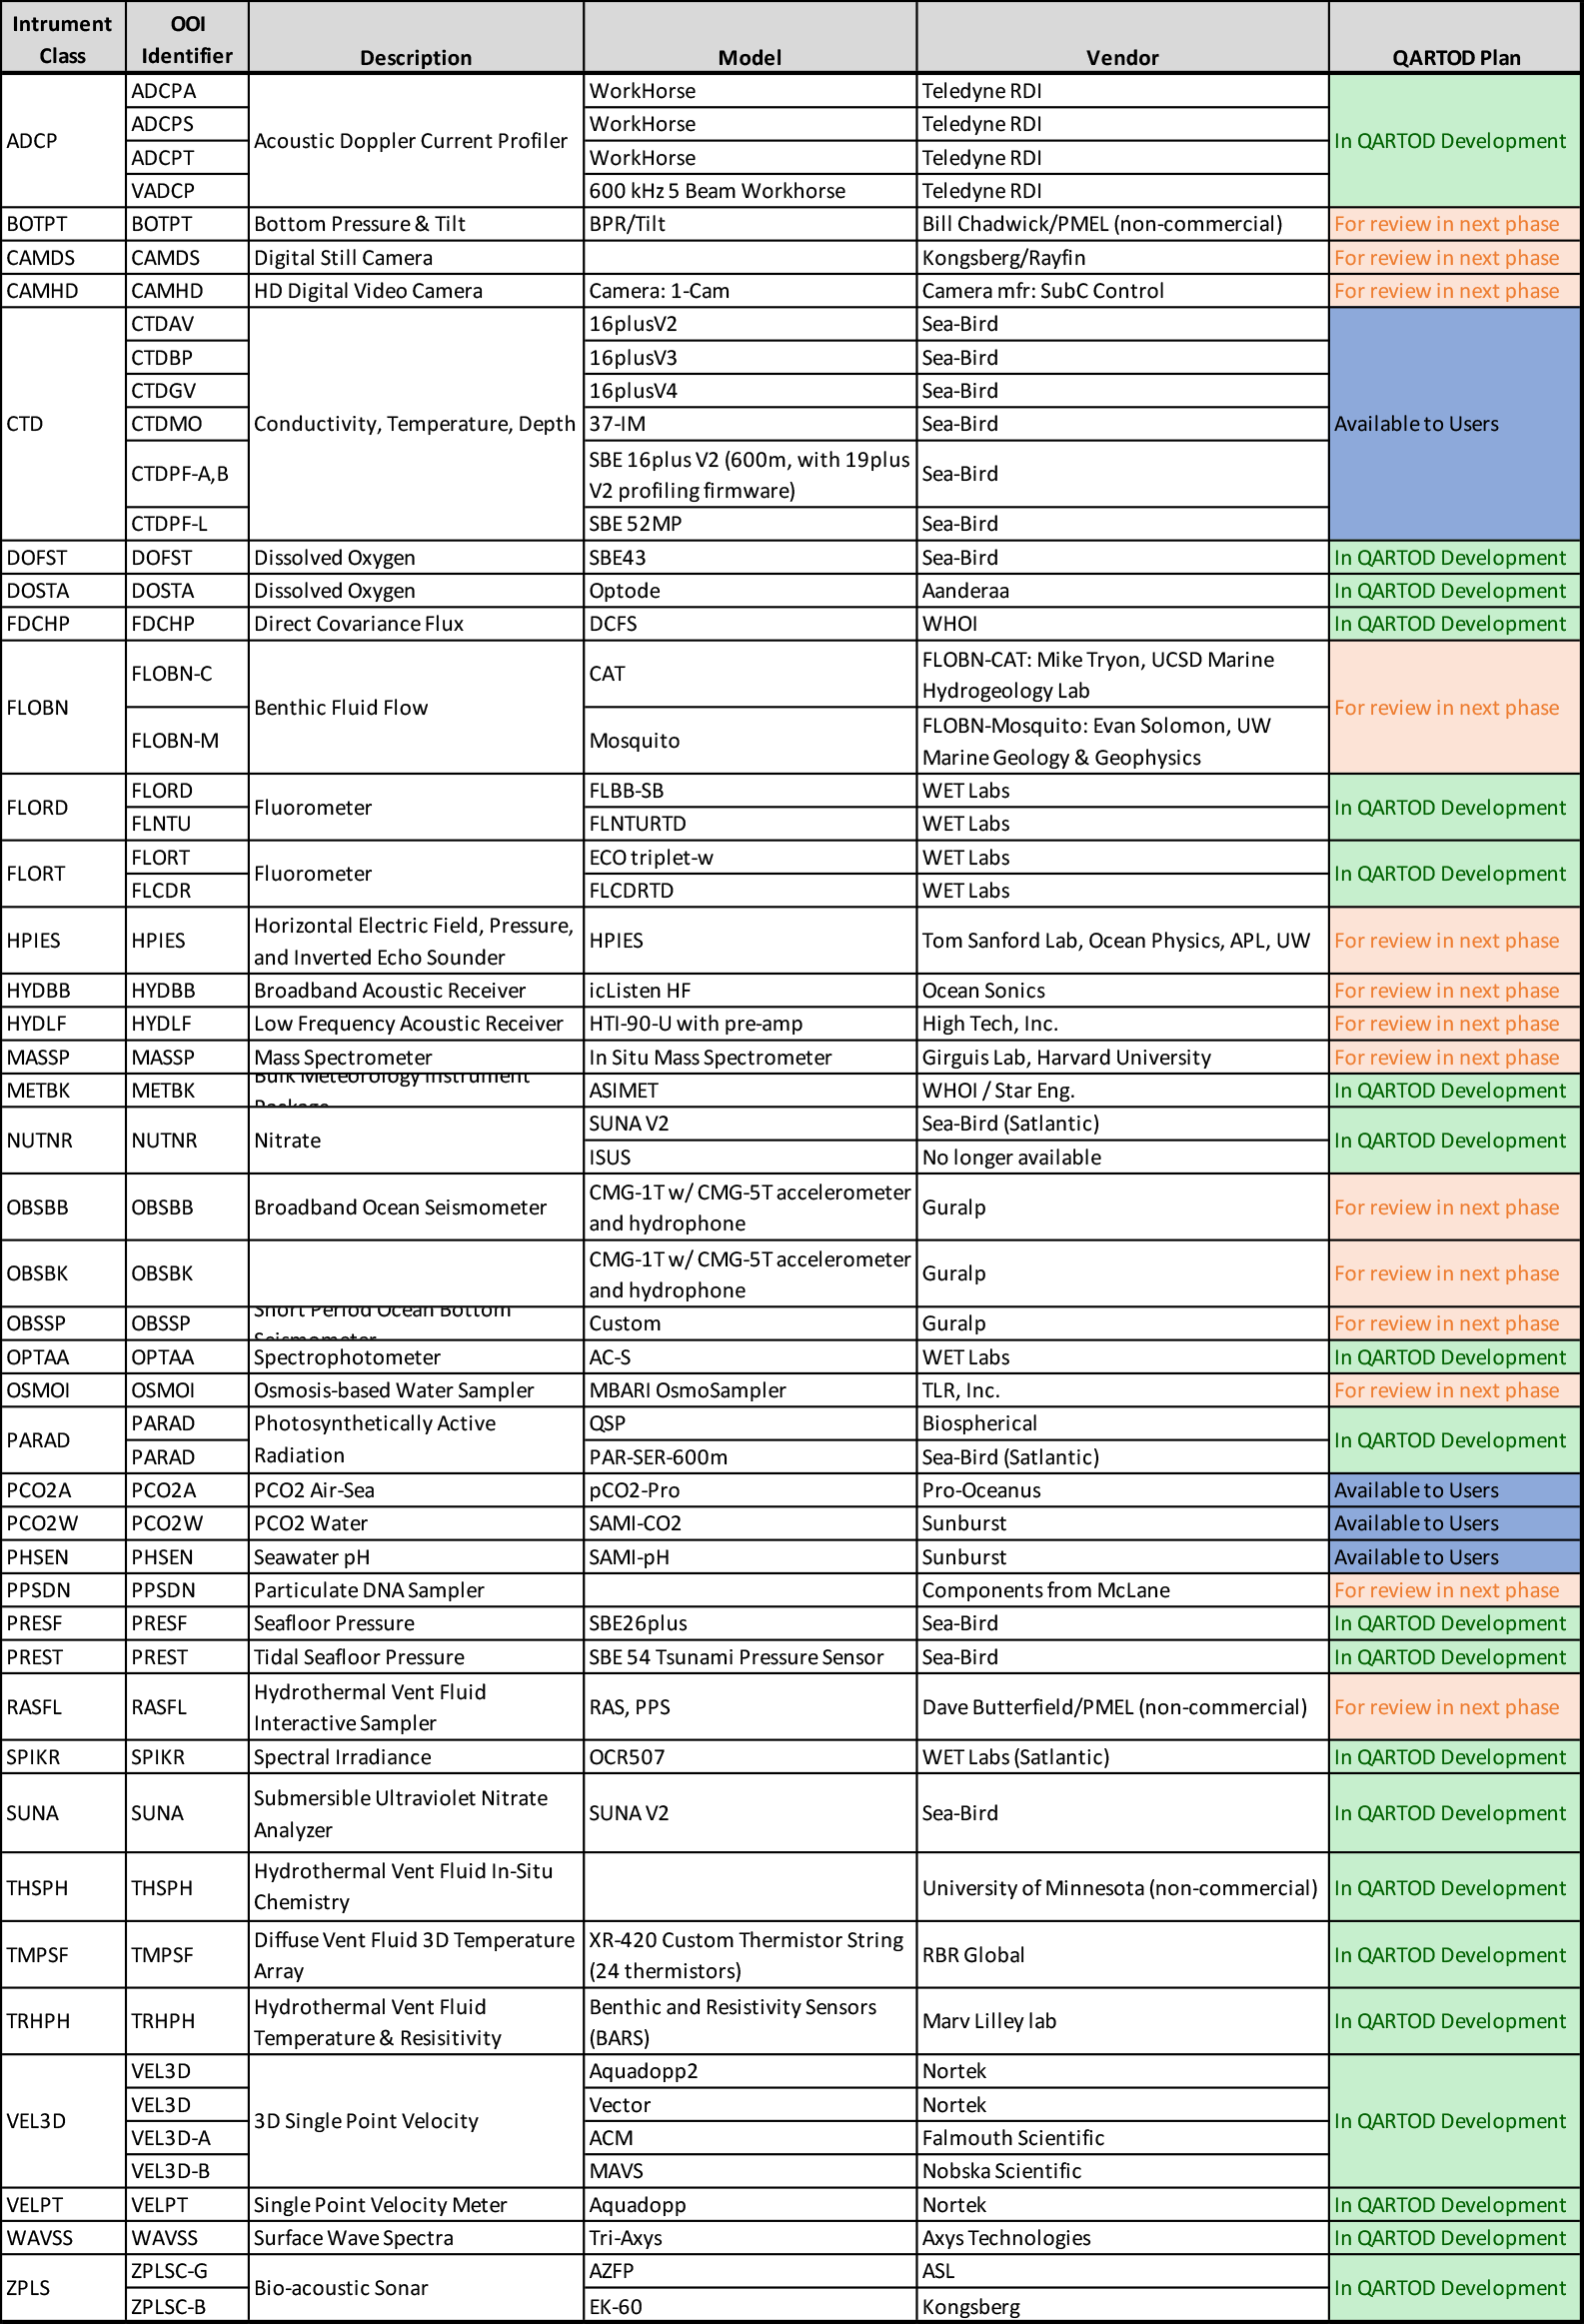
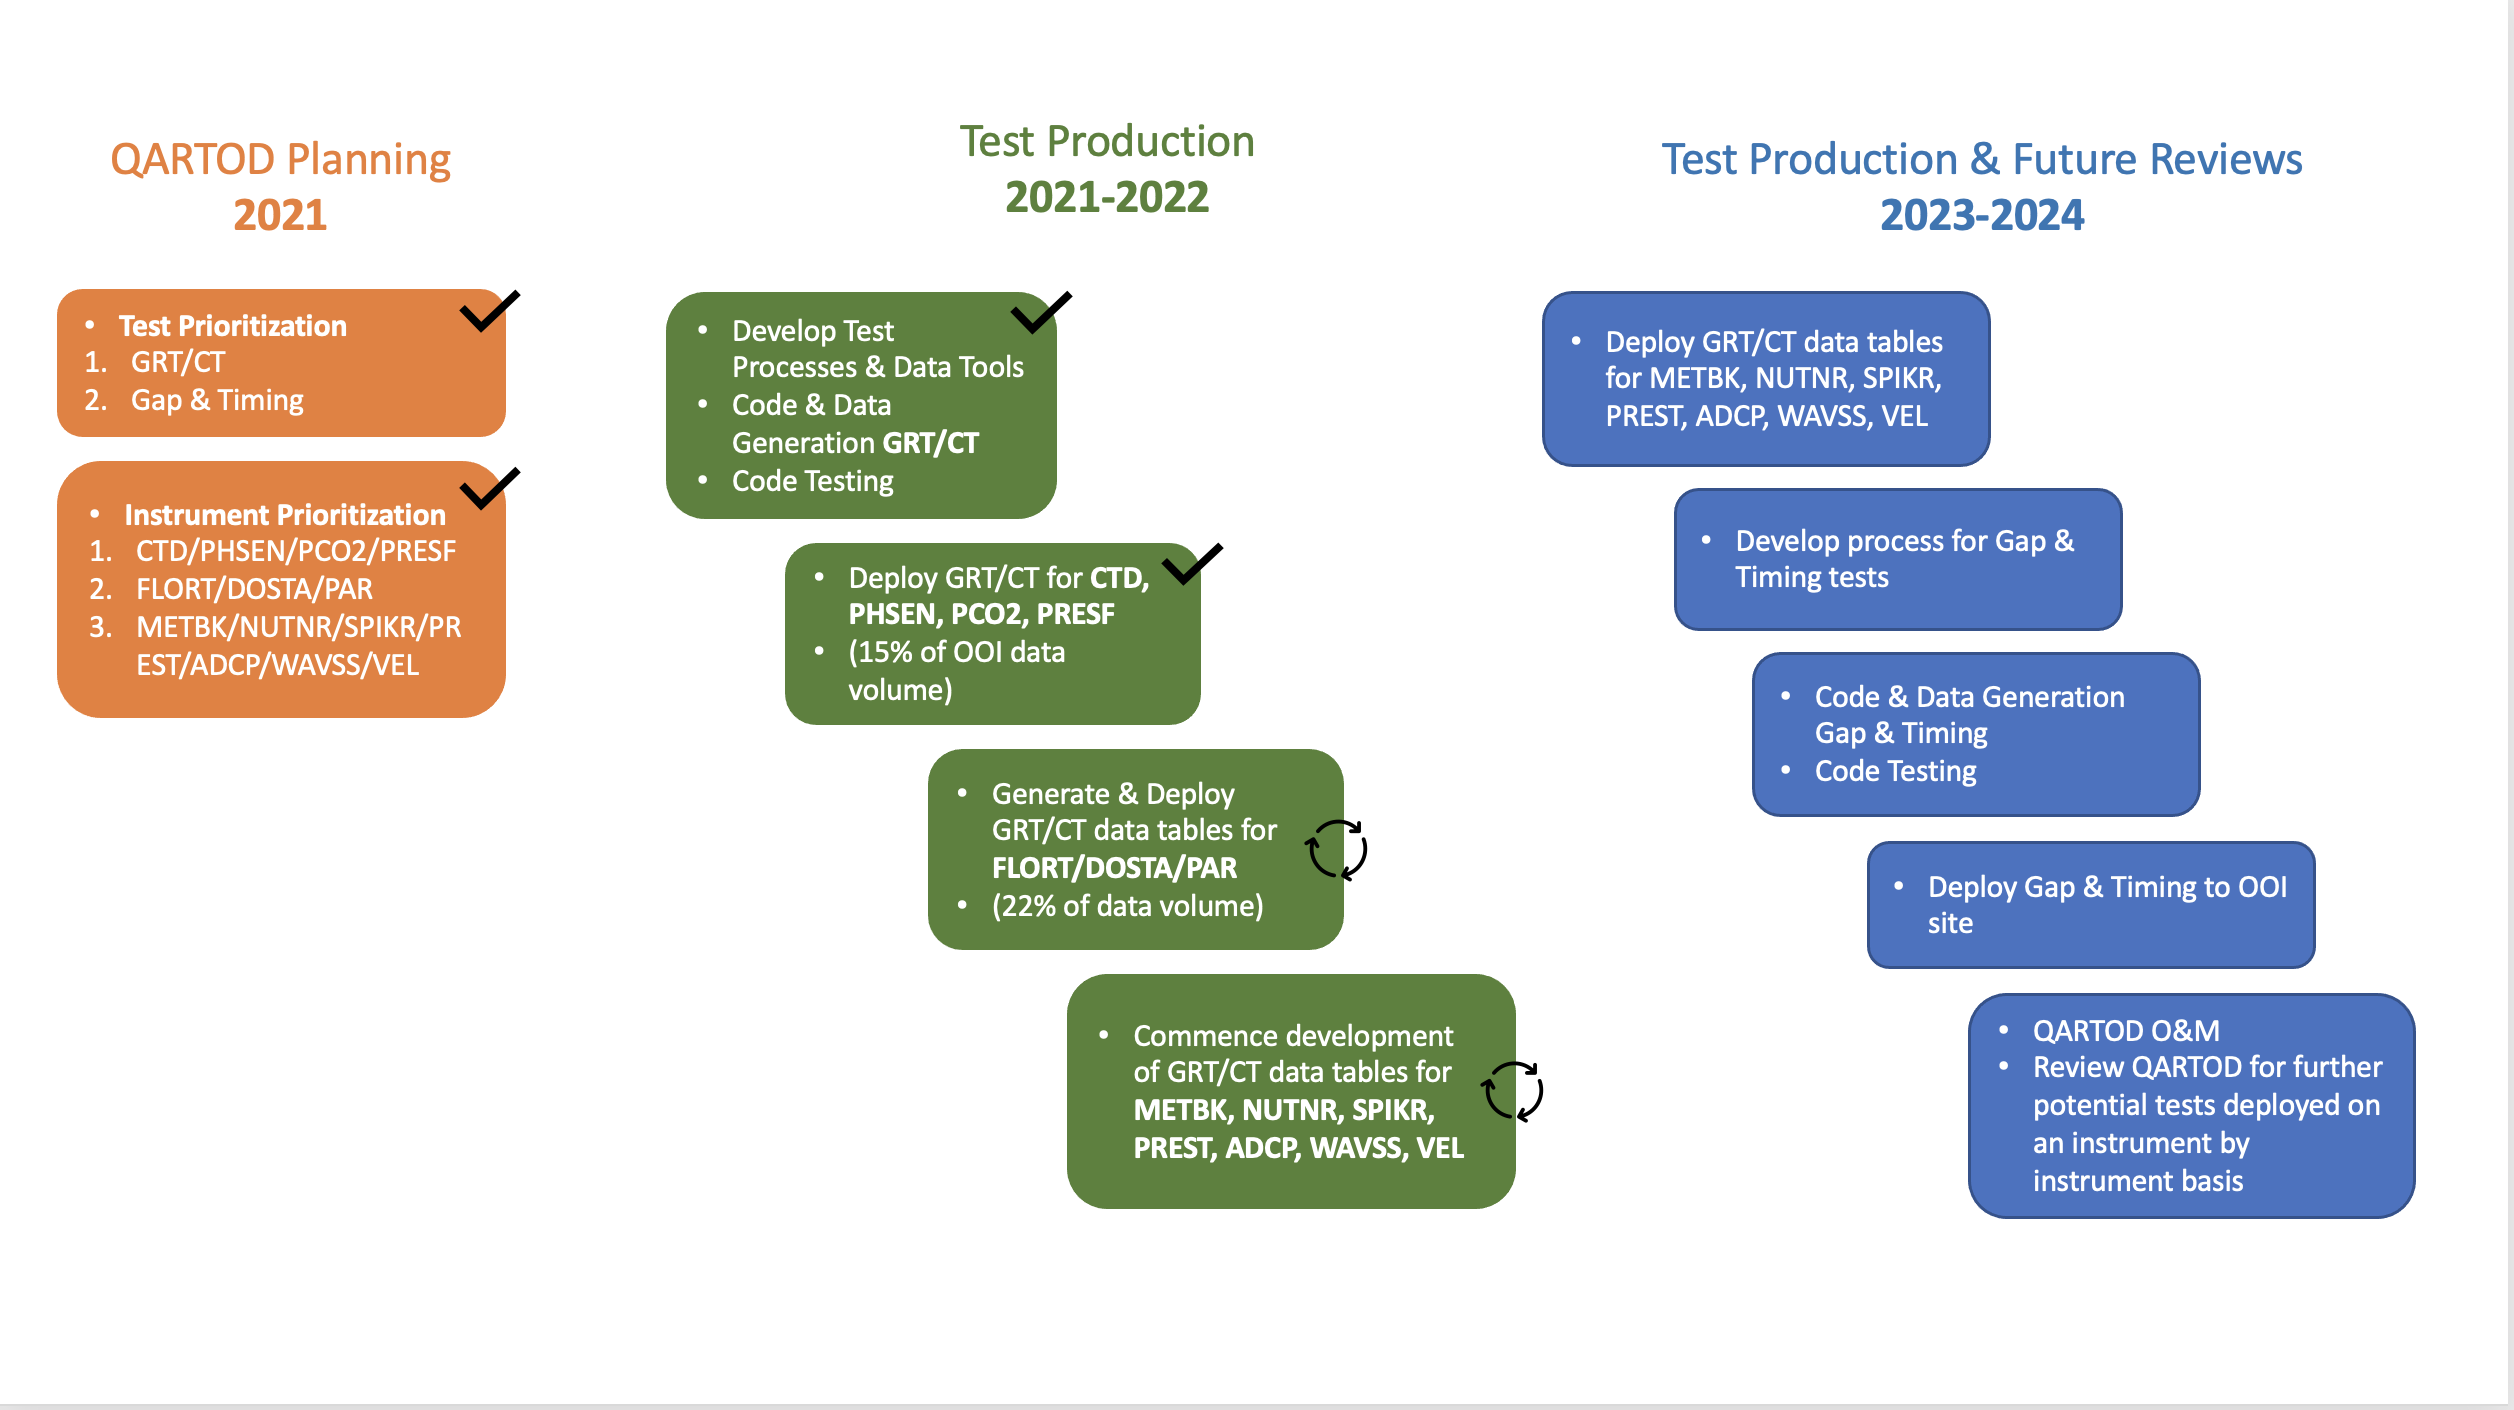
Current tests under development are gross range (GRT) and climatology (CT). The gap test (GT) will follow next. The syntax and location tests are considered operational checks and are handled within OOI operations and management systems. QARTOD test data will be available in specific locations where OOI supplies data, starting with M2M, and then propagated to THREDDS and Data Explorer. The current status of QARTOD test development and availability is shown in Table 1. Table 2 details QARTOD Rollout Plans by OOI instruments. Figure 1 shows the timeline of QARTOD testing.
Automated QC Algorithms
Note as of November 23, 2022: This information is provided as background because some data in ooi.net still contain these flags. The tests described below, however, are deprecated and are no longer being developed or maintained. Some ooi.net data still contain these flags, but Global, Spike, and Stuck Value are no longer reliable. The other three were aspiring towards QARTOD standards but never fully implemented.
| OOI Test | OOI Description | QARTOD Equivalent | QARTOD Recommendation | Notes |
|---|---|---|---|---|
| Global Range Test (pdf) | Data are flagged unless they fall within valid world ocean ranges or instrument limits (whichever is more restrictive) | Gross Range | Only considers manufacturer-defined sensor and calibration limits | Different tests, different names. OOI test is currently operational. |
| Local Range Test (pdf) | Data are flagged unless they fall within locally valid site-specific or depth ranges. Interpolates thresholds between depth and season intervals | Local Range | Starts with constant limits for each depth/season interval | Roughly identical, same nomenclature. OOI Local ranges are still being established and entered based on first year of operations. |
| Spike Test (pdf) | Deviation from mean compared to 2*N neighboring points | Spike | N=1, default threshold is based on the rate of change distribution from previous data sets | Roughly identical, same nomenclature. OOI test is currently operational. |
| Trend Test (pdf) | Data are flagged as having a trend if the SD of the residuals to a polynomial curve < original data, multiplied by some factor. Designed to test for sensor drift. | N/A | No QARTOD equivalent | OOI only. This test is not currently operational, and is being reviewed for efficacy. |
| Stuck Value Test (pdf) | If 2 neighboring values differ by less than the resolution of the sensor for more than N repetitions, data are flagged | Stuck Sensor | Manual suggests 3 consecutive points for a stuck sensor suspect flag and 5 for a fail flag. | QARTOD manual suggestion may be too low for well-mixed portions of the water column. We are evaluating the results from the OOI lookup values. |
| Gradient Test (pdf) | If d(data)/d(t) between two points is greater than a set threshold, all following points fail until one falls within an absolute limit (TOLDAT). First data point is assumed good unless a “good” starting data (STARTDAT) point is defined. | Rate of Change | QARTOD recommends two neighboring points and does not incorporate TOLDAT or STARTDAT values. | Different tests, different names. OOI Gradient test is under review and not currently operational. |
Links in order of appearance above:
Global Range Test: DATA PRODUCT SPECIFICATION FOR GLOBAL RANGE TEST Local Range Test: DATA PRODUCT SPECIFICATION FOR LOCAL RANGE TEST Spike Test: DATA PRODUCT SPECIFICATION FOR SPIKE TEST Trend Test: DATA PRODUCT SPECIFICATION FOR TREND TEST Stuck Value Test: DATA PRODUCT SPECIFICATION FOR STUCK VALUE TEST Gradient Test: DATA PRODUCT SPECIFICATION FOR GRADIENT TEST QC algorithms are only run on science data products, not on auxiliary or engineering parameters. The automated QC algorithms do not screen out or delete any data, or prevent it from being downloaded. The algorithms only flag “suspect” data points in the plotting tools and deliver those flags as additional attributes in downloaded data.Other Useful Documentation
The algorithm code used to process the QC algorithms in the OOI Cyberinfrastructure system.
QA/QC PROTOCOLSThe “as-designed” details of QA/QC methods for OOI data and data products and physical samples can be found within the Protocols and Procedures for OOI Data Products document, which also includes calibration and field verification procedures.
QC Lookup TablesQC lookup tables that describe QC limits.


