Event and Seasonal Scale Variability of Surface Heat and Momentum Fluxes
Excerpted from the OOI Quarterly Report, 2020.
Endurance Array: Event and Seasonal Scale Variability of Surface Heat and Momentum Fluxes off Oregon and Washington
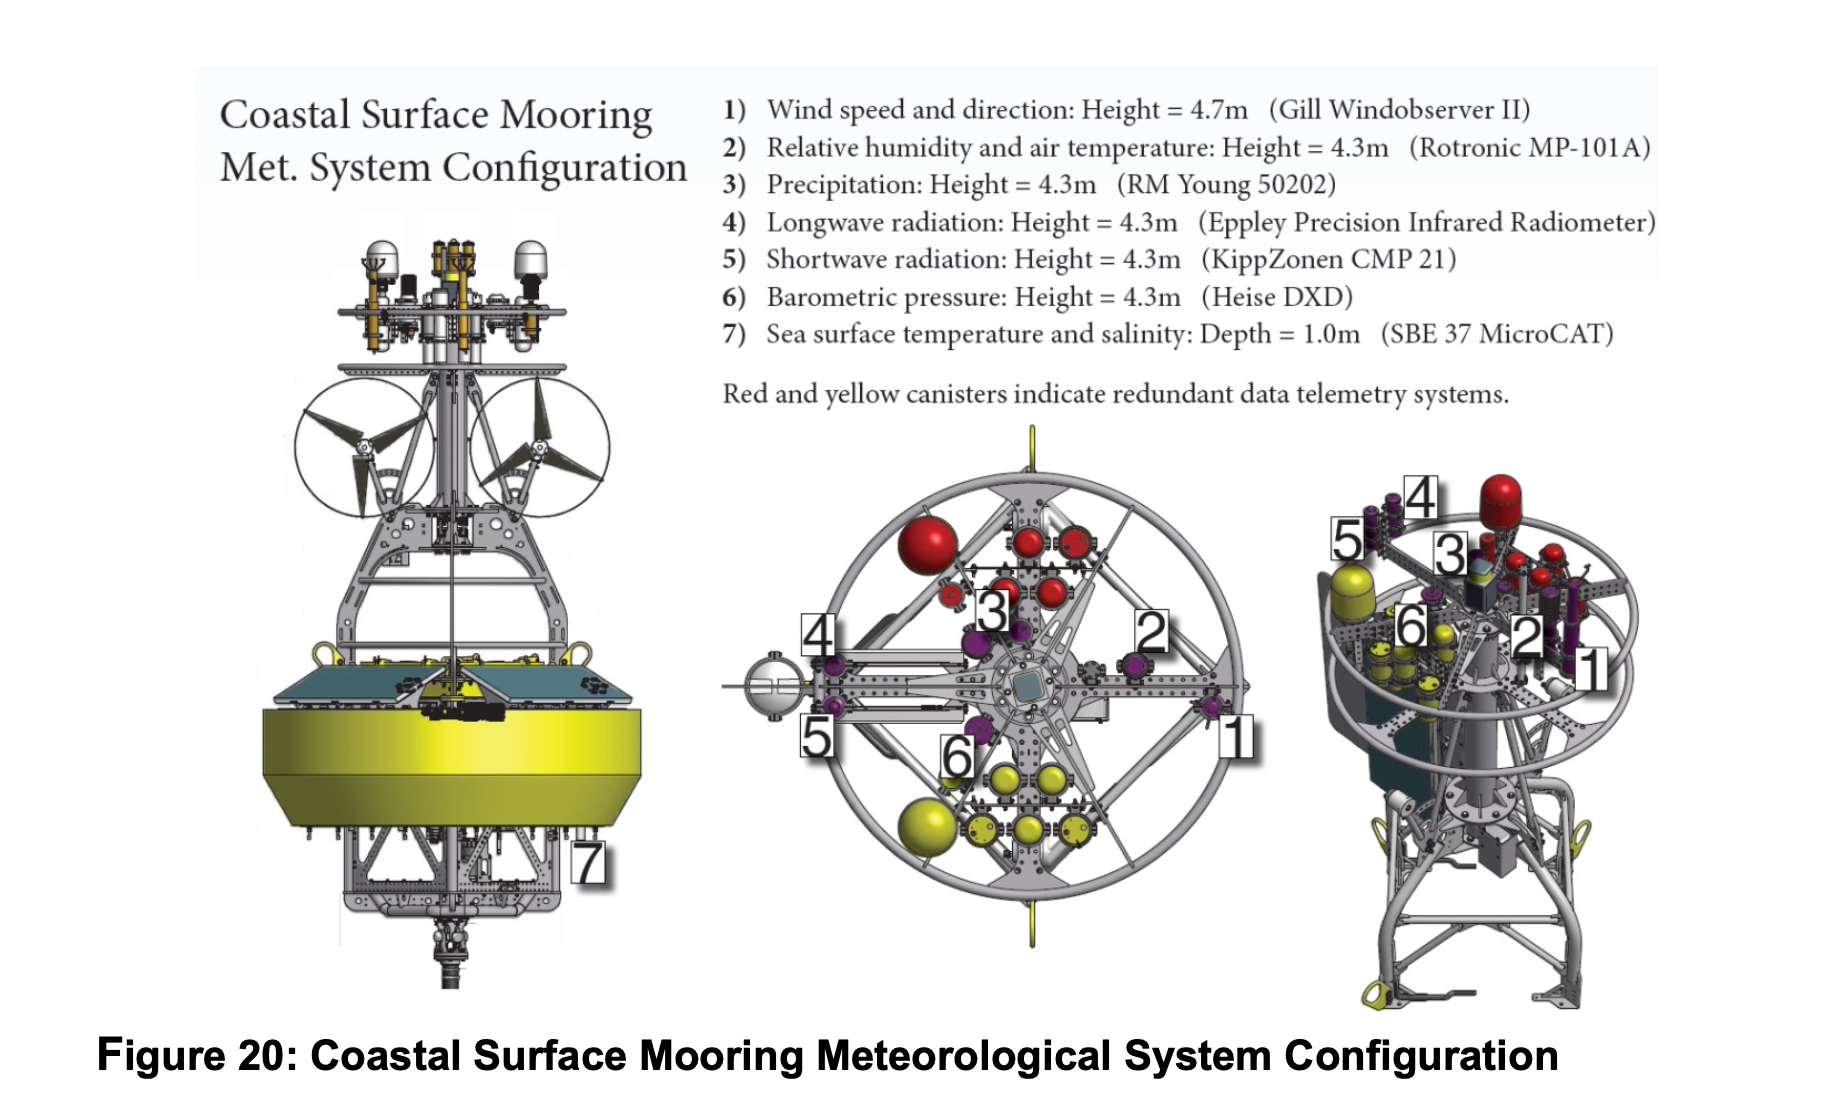
As part of the NSF-funded Ocean Observatories Initiative (OOI) Coastal and Global Scale Arrays, surface buoy meteorological measurements are made using the Air-Sea Interaction Meteorology (ASIMET) package (Figure 20). These measurements are reported on in Dever, E.P, J.P. Fram, C.M. Risien, R.A. Desiderio, C.E. Wingard (2020), Event and Seasonal Scale Variability of Surface Heat and Momentum Fluxes off Oregon and Washington, Abstract [A144A-2411] presented at Ocean Sciences Meeting 2020, San Diego, CA, 17-21 Feb. Radiative and bulk surface fluxes calculated from these measurements are provided as OOI data products. Both the measurements and the estimated fluxes are available through the OOI Data Portal as are all the metadata required to produce these fluxes (raw data, calibration coefficients, data product specifications, data product algorithms etc.).
On the Endurance Array, ASIMET measurements are made at four locations over the Oregon and Washington shelf and slope. These locations lie within the northern California Current Marine Ecosystem. Here upwelling favorable wind forcing and atmospheric conditions occur in spring and summer months with forcing in other months driven by passing low pressure systems. The timing of both the spring transition to upwelling and the fall transition to storm forcing varies from year to year as does the strength of individual events within each season. Upwelling events are associated with strong net shortwave and latent heat fluxes. Storm events are associated with weak net shortwave fluxes and latent fluxes that vary in strength.
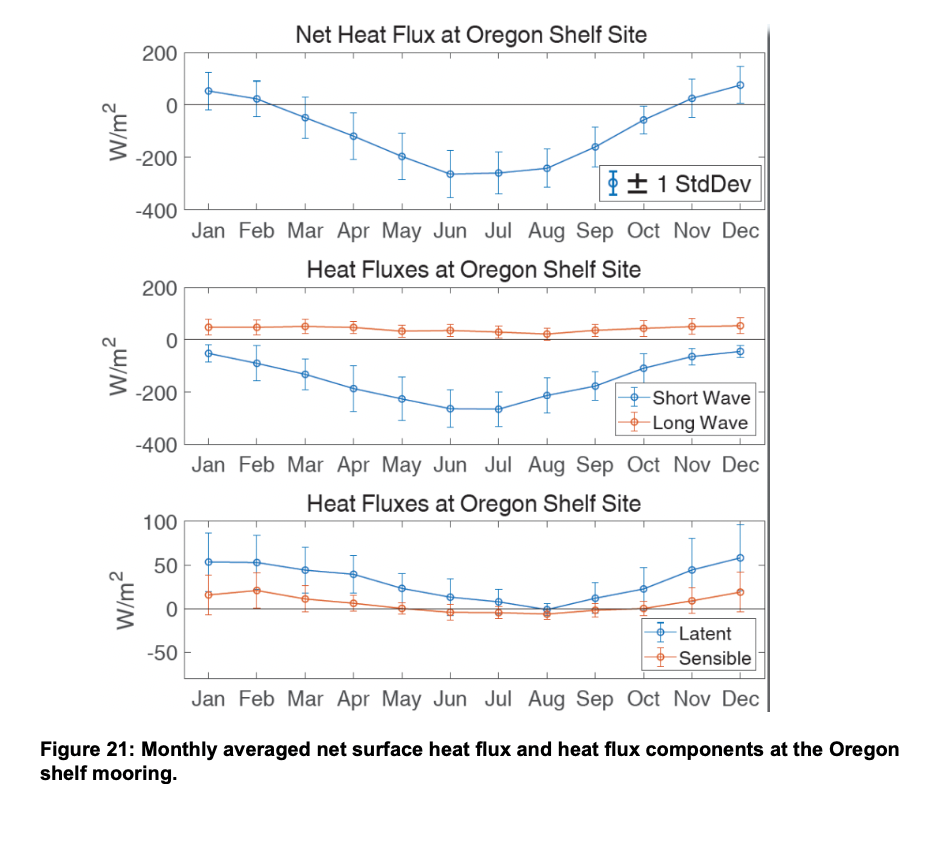
Machine to machine (M2M) calls were used to read in hourly bulk surface fluxes from OOI Endurance Array moorings from their initial deployments in April 2015 through February 2020. OOI data product fluxes are calculated with TOGA-COARE and other community standard algorithms. Monthly averages of OOI Endurance Array flux data compare well with one another. Both the Oregon and Washington shelves are subject to heating on an annually averaged basis. The Oregon Shelf mooring (Figure 21) is typical. Late fall and winter show net fluxes from the ocean to the atmosphere. All other months show heat flux into the ocean due to insolation.