
pH and pCO2 Time Series from the Endurance Array
Adapted and condensed by OOI from Dever et al., 2022, and Fassbender et al., 2018 doi://10.5194/essd-10-1367-2018.
The Ocean Observatories Initiative (OOI) Endurance Array makes extensive measurements of collocated physical and biogeochemical parameters throughout the water column. At the recent Ocean Sciences meeting, we reported on moored measurements from 2015 to the present off Washington and Oregon. We focused on spatial and temporal variability of pH and pCO2 and compared the measurements to published values in the region. This information was also presented in a seminar at UC, Santa Cruz on 14 Jan 2022.
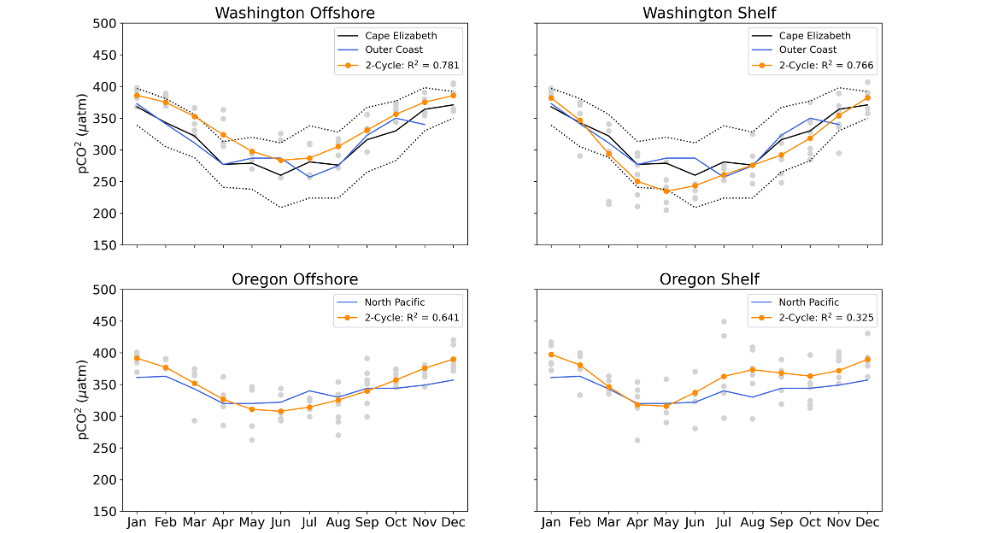
The quality-controlled biogeochemical time series are self-consistent and in line with other regional measurements. For example, pH and pCO2 have significant onshore-offshore variation and along-shelf differences north and south of the Columbia River. This variability is related to the Columbia River plume, the strength of local upwelling, and mixing with offshore waters. On a seasonal scale, pH and pCO2 is also driven by summer upwelling and winter river inputs. Variability is highest in spring and summer. pCO2 values greatly exceed atmospheric values (~400 μatm) at times in the summer (Figure above). The highest monthly pCO2 averages are seen at the Oregon shelf site.
Dever et al. (2022), pH and pC02 Time Series from the Ocean Observatories Initiative Endurance Array, CBP05, presented at Ocean Sciences Meeting 2022, Honolulu, HI (virtual), 01 Mar 2022.
Fassbender et al. (2018), Earth Syst. Sci. Data, 10, 1367–1401, 2018 https://doi.org/10.5194/essd-10-1367-2018.