Latest Version of Data Explorer Launched May 30
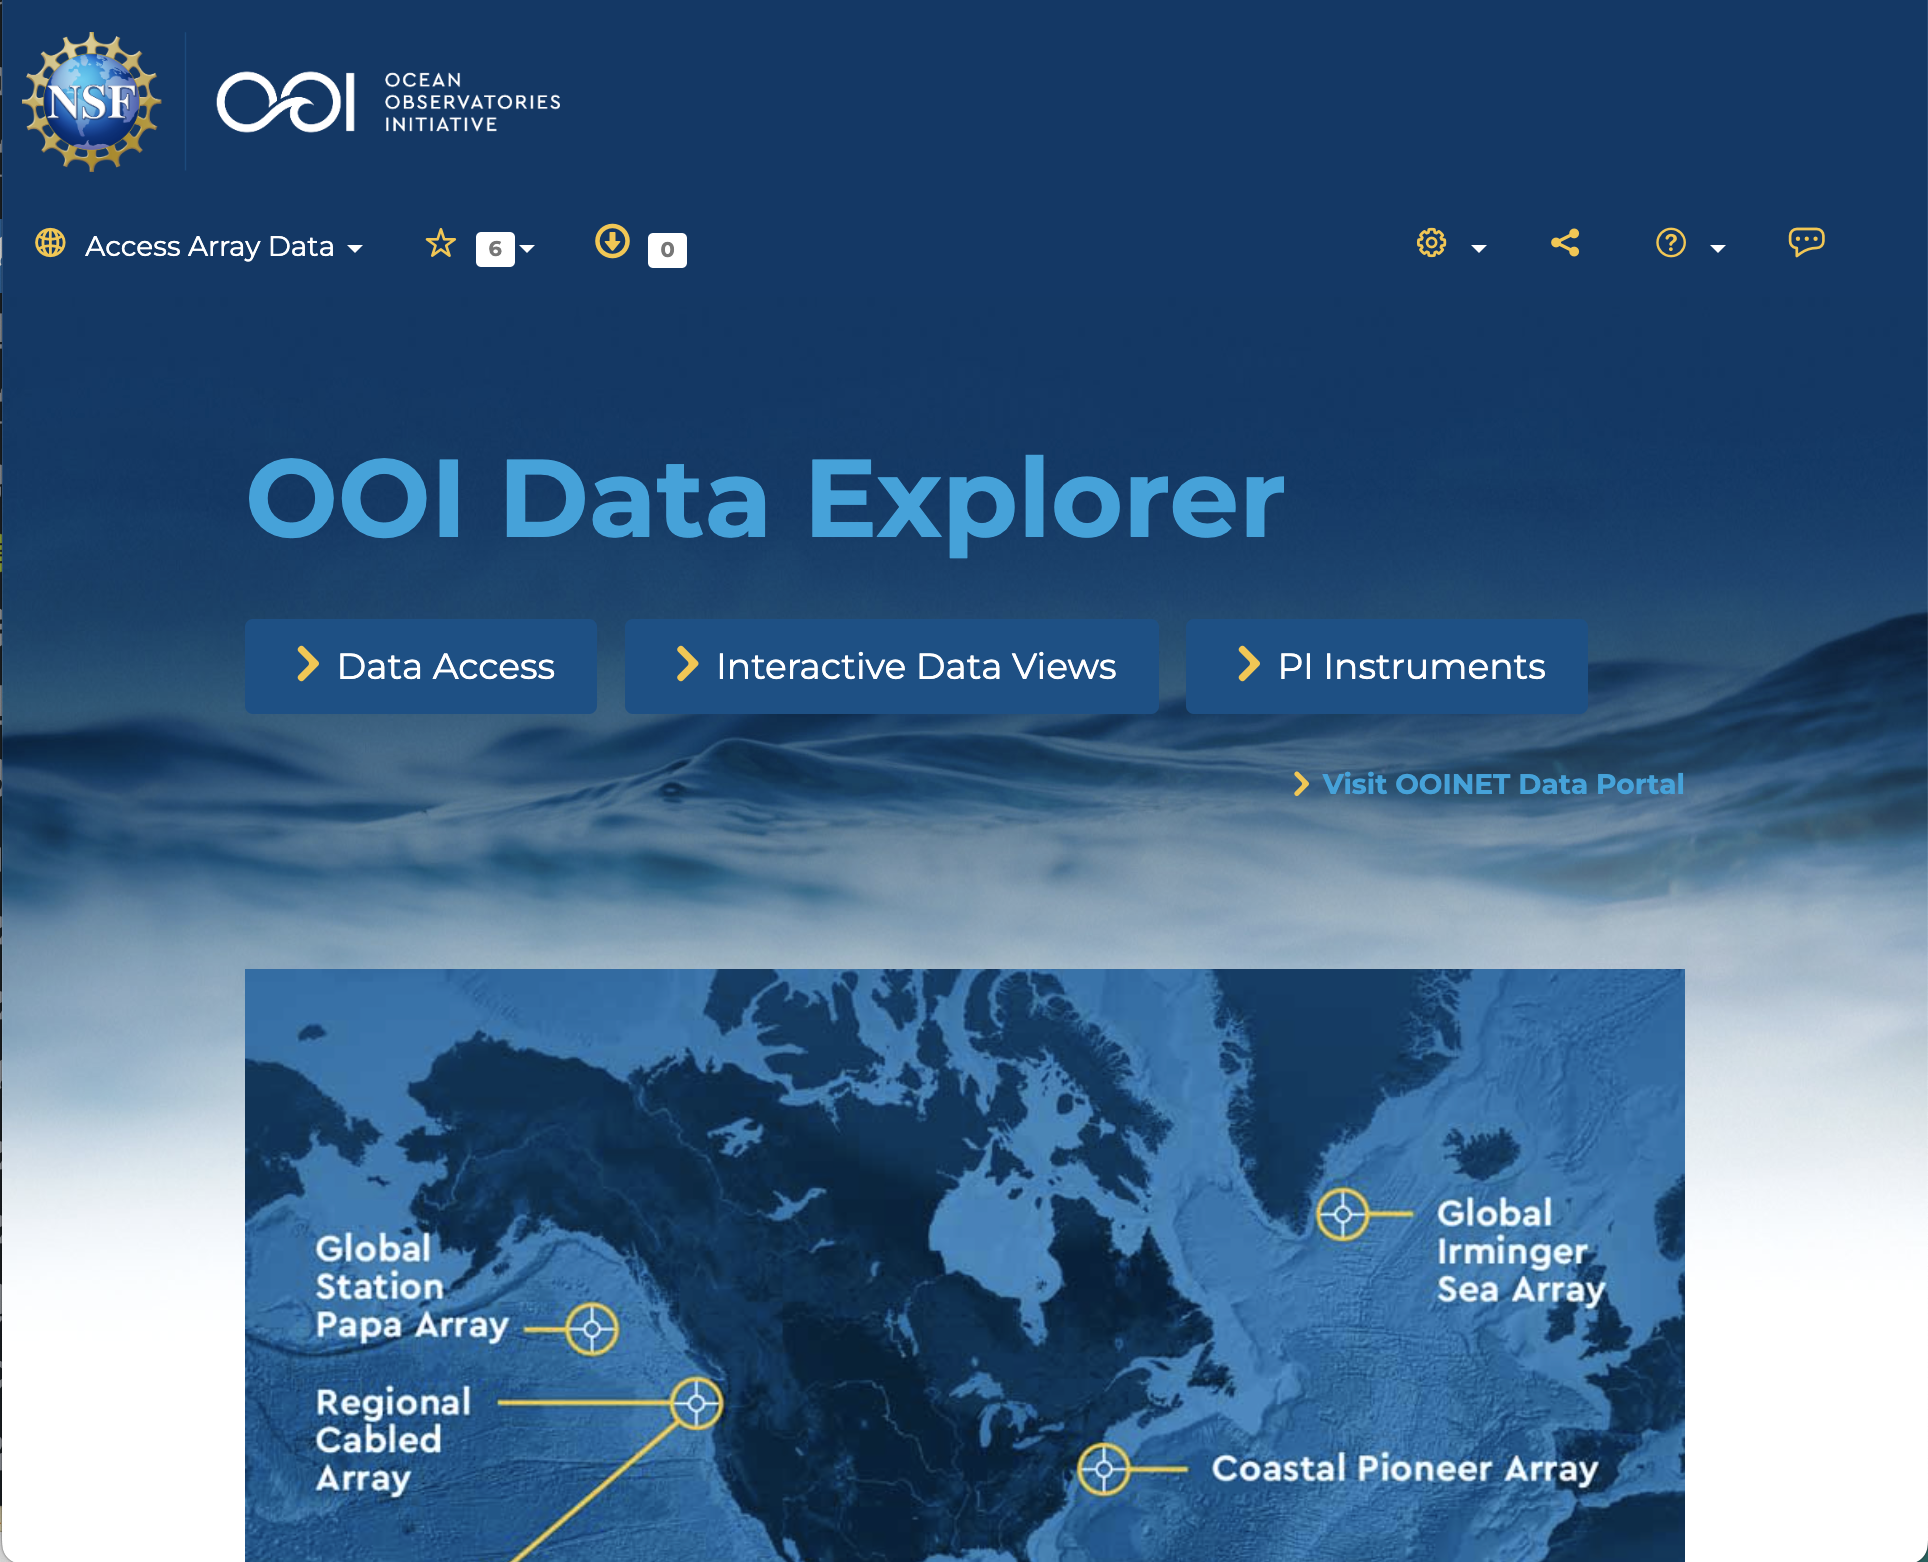
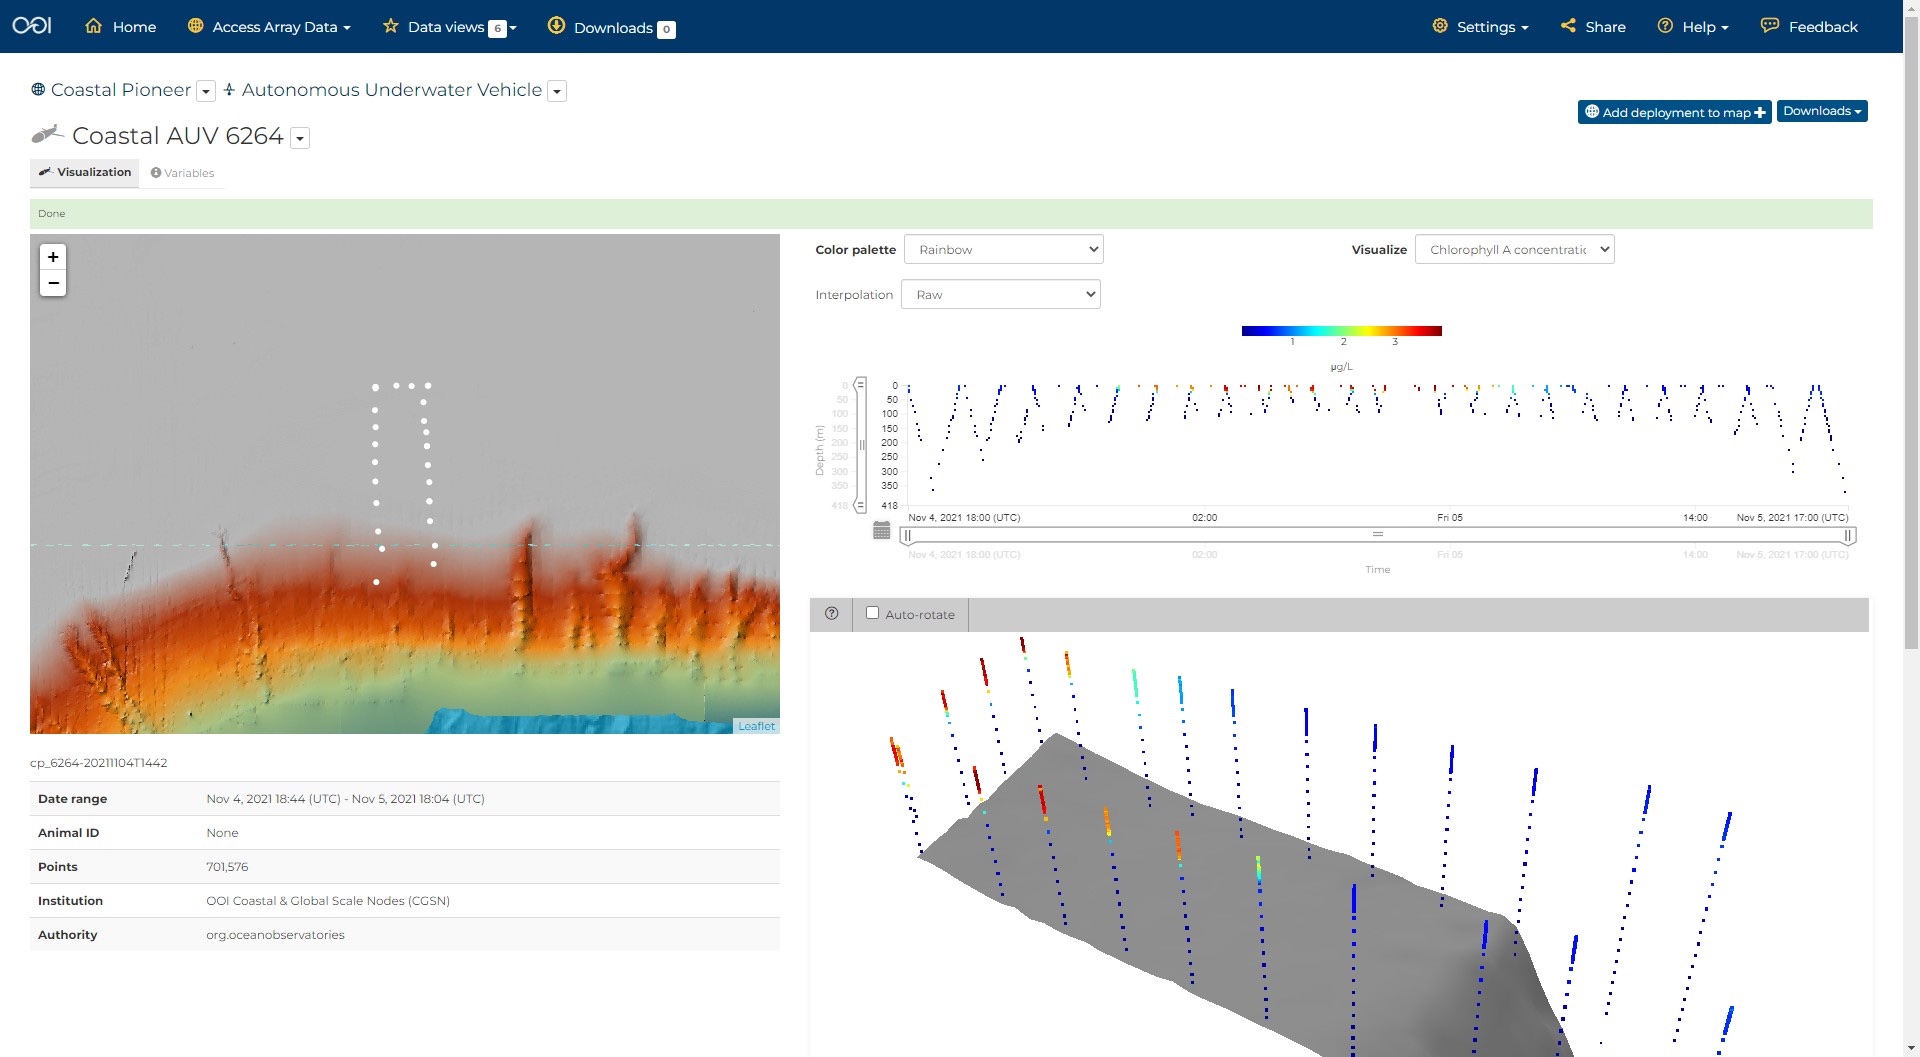
OOI’s Data Science Team, working with Axiom Data Science, announced additional improvements to OOI’s data access and visualization tool, Data Explorer will publicly launch on May 30, 2023. The latest Data Explorer, version 1.5, includes a significant expansion of data availability, updates to a viewer for underway still images, and introduces a beta version of real-time streaming for cabled instruments. Version 1.5 offers new scientific data for Autonomous Underwater Vehicles (AUV) and Bio-Acoustic Sonar (ZPLS) instruments and Principal Investigator-added instrument data are now available on the site. Visitors to the site will experience optimization and new viewing capabilities for still and animated images. Additionally, data are streamed in real-time by the second for cabled instruments in the Regional Cabled Array, giving users the most up-to-date information available.
“A great deal of effort goes on behind-the-scenes to make Data Explorer be responsive to users’ needs and provide seamless, quick access to data,” explained Jeffrey Glatstein, Senior Manager of Cyberinfrastructure and OOI Data Delivery Lead at Woods Hole Oceanographic Institution. “We are grateful to our team and the developers at Axiom who continually make this already great tool, even better.”
Details about the new features are included in the following:
New Features
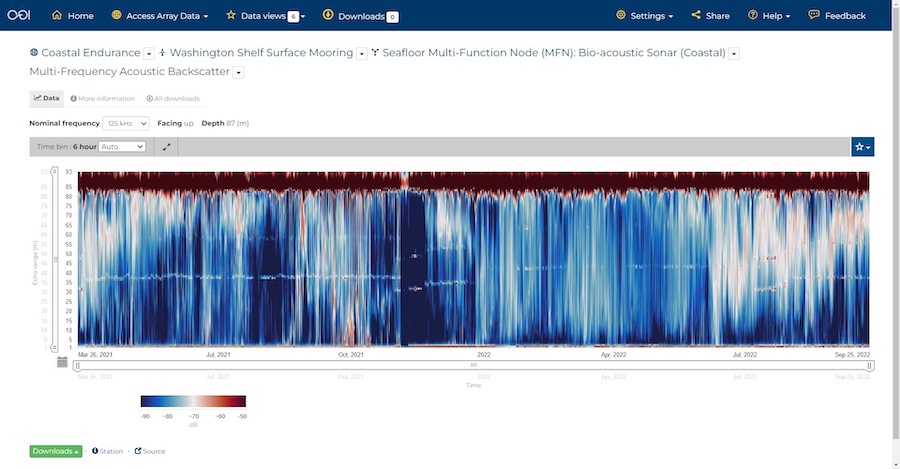
ZPLS instrument data will now be online for more locations, including the Coastal (Endurance) and Global Arrays (Argentine Basin). This is the first time this type of OOI bioacoustics sonar data have been available in an interactive visualization. This version addressed feedback received from subject matter experts to improve the data charts, including respecting time selections among sonar frequencies, changing variable names, and addresses frequency sorting. Other technical fixes have been made to the backend in response to users’ suggestions, which will help make these data more accessible.
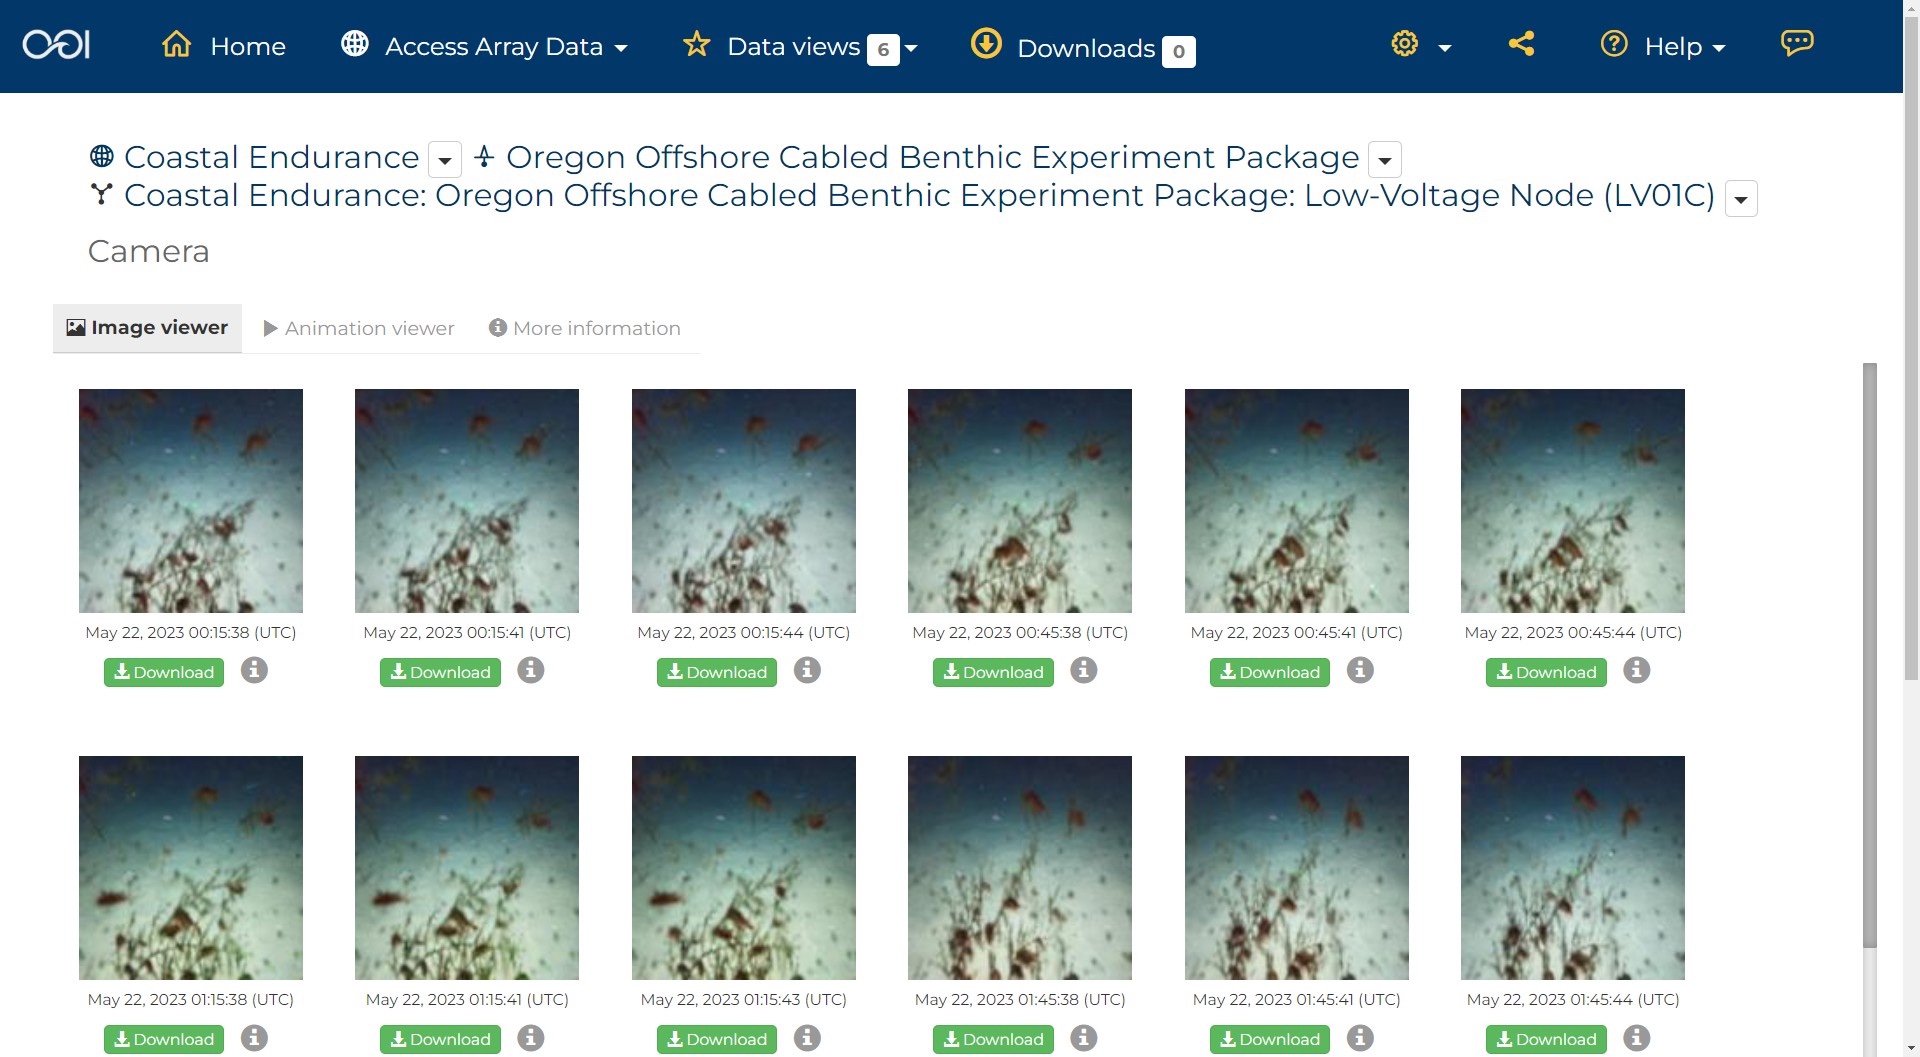
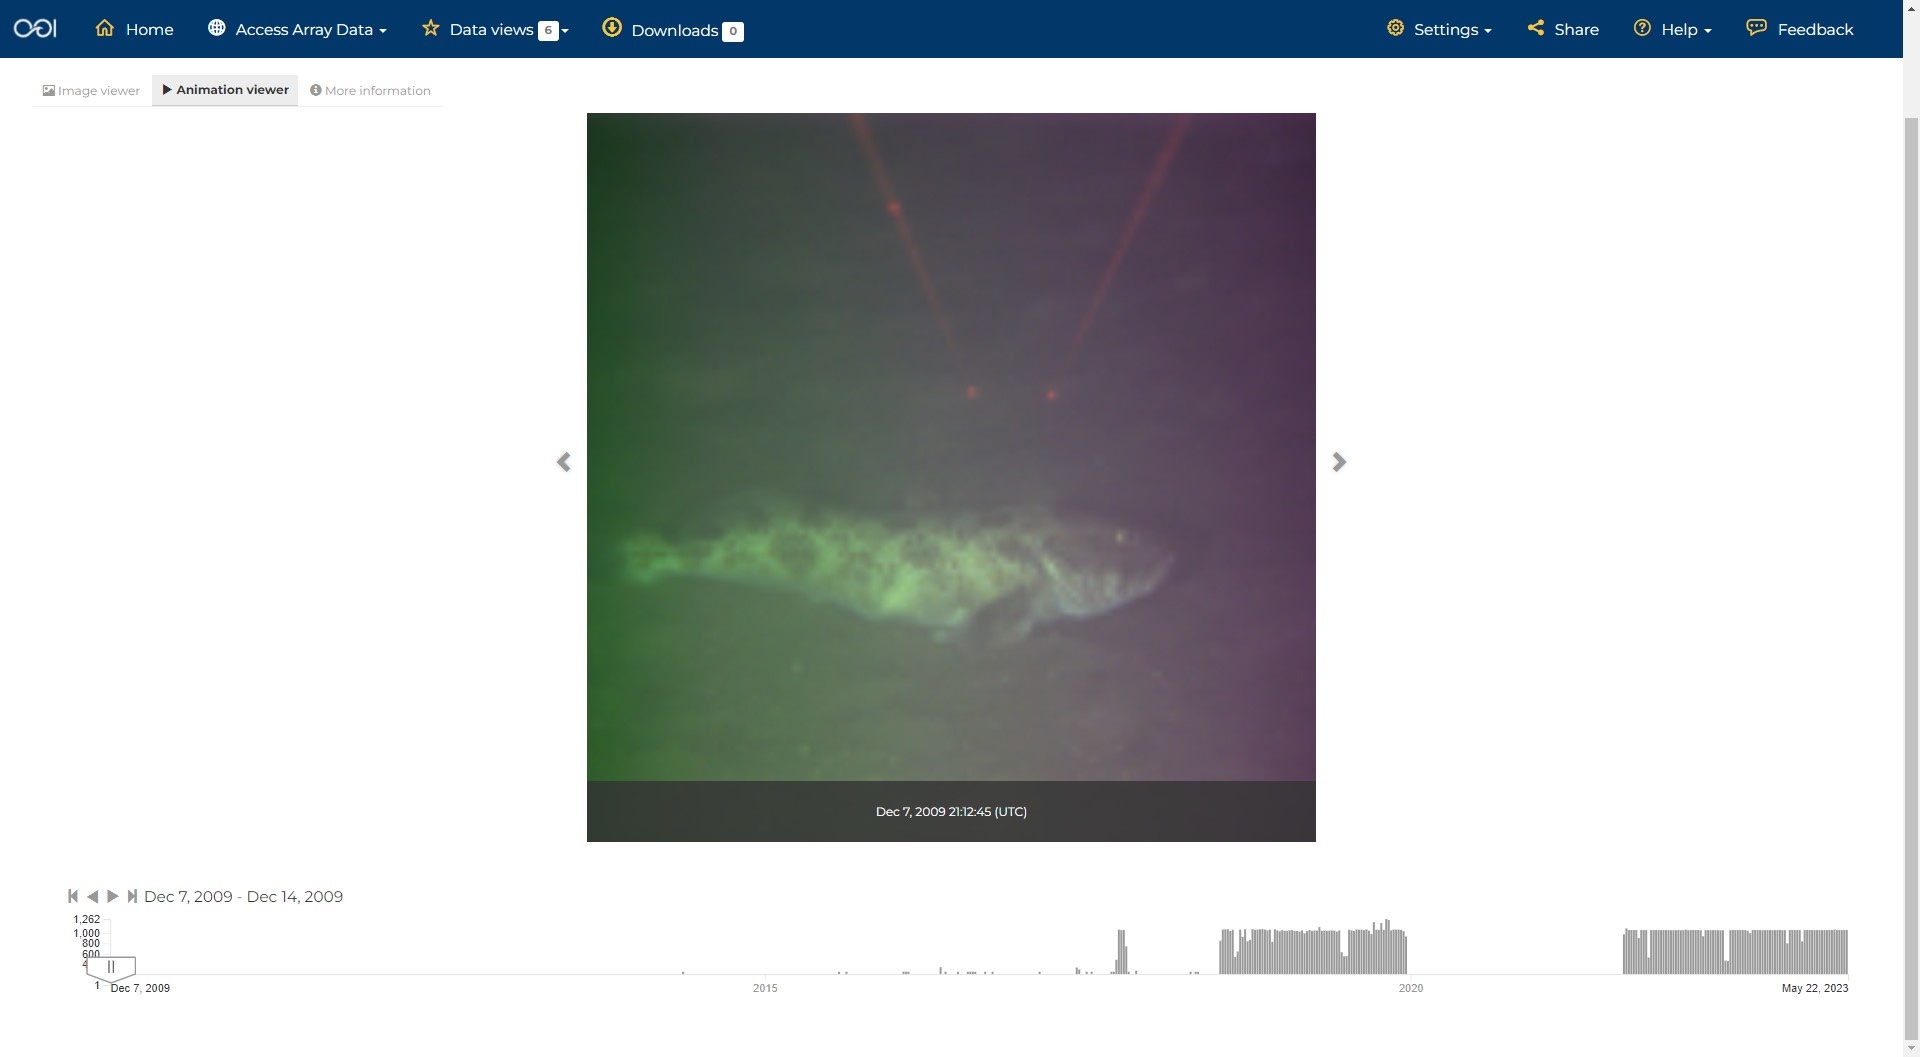
A media server will now be up and running on Data Explorer. In this version, updates have been made to improve the performance of the still image viewer. All image collections are shown in a Grid view which makes seeing what is available easier. Camera metadata is now available via a more information tab. Images will also be available on the pages included in time series. Images will also be available as a single image or in animation viewer. Full size images are presented with an image scale and available for download.
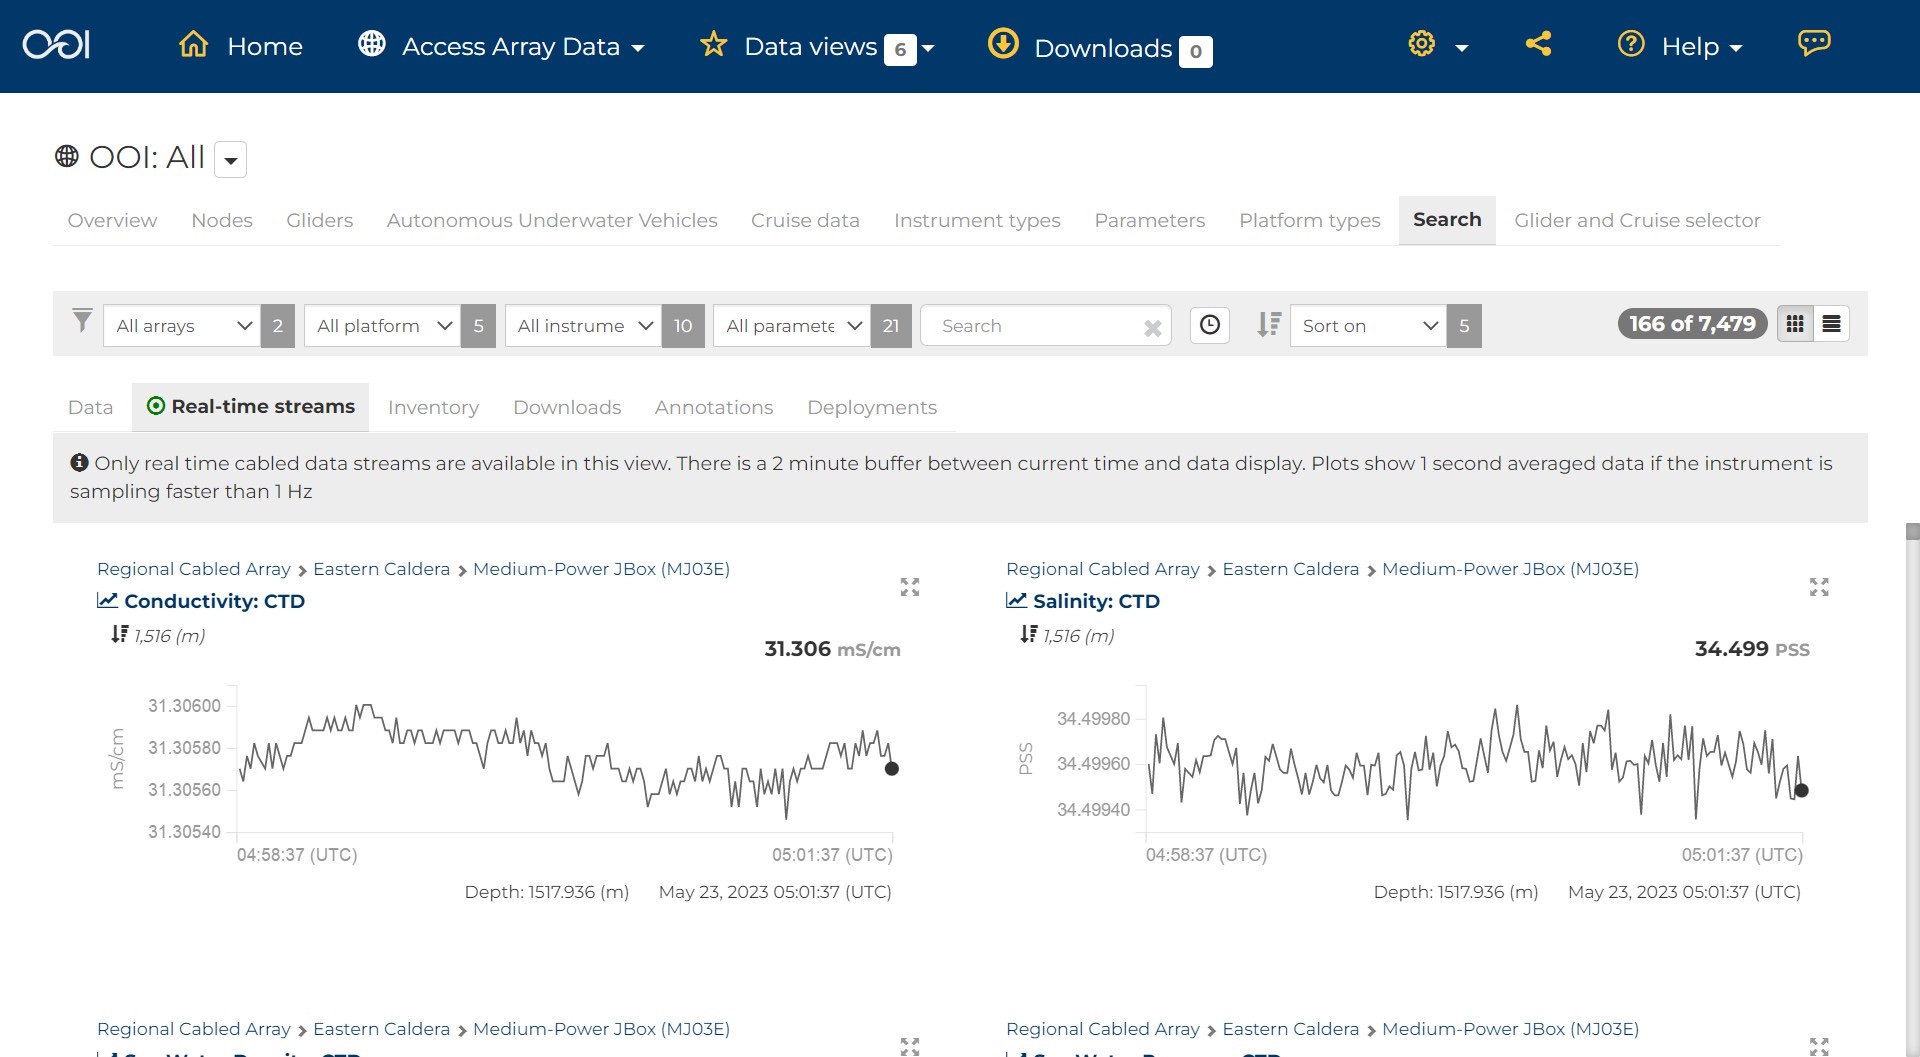
Another added beta media feature is real-time streaming of Cabled Array instrument data. The design of this function is meant to be user-friendly. A Grid view shows available real-time streaming instruments. A Single view shows a real-time streaming chart, with data from the last 24 hours. These features are available from Data Explorer’s landing page with further explanations of what data are available and when.
Added Glatstein, “We invite all OOI data users to try out these new components and continue to provide us feedback. We are particularly eager to hear the community’s response to the beta version of the media server so we can tweak that as needed.”