
Wave Statistics from 3-Axis Motion Sensors on OOI Surface Buoys
The Ocean Observatories Initiative (OOI) Pioneer Array at the New England Shelf (Pioneer-NES) collected data for nine years from November 2013 through November 2022 across the shelf break. Of the three Surface Moorings in the array (Inshore – ISSM (40.37°N, 70.88°W); Central – CNSM (40.14°N, 70.77°W); Offshore – OSSM (39.94°N, 70.89°W), only CNSM was equipped with a surface wave sensor: the Axys Technologies Tri-Axys Directional Wave Sensor (WAVSS). This meant that observations on wave data were limited to a single location within the array. Recognizing that data from a single location could be restrictive for some types of analysis, the Coastal and Global Scale Nodes Group (CGSN) identified an opportunity to increase the number of surface wave observations and extend their geographic extent to the full cross-shelf span of the Pioneer-NES Moored Array. This was accomplished by using the engineering data collected by the MicroStrain 3-axis motion sensors (MOPAK) deployed on all three surface moorings. The data collected by the MOPAKs can be used to compute the bulk and directional wave statistics at each Surface Mooring in the array.
The MOPAK sensors collected triaxial acceleration, angular rate, and magnetic orientation for 20-minutes at 10 Hz once-an-hour. These data are used to compute the buoy displacements and velocities. A zero-crossing algorithm, which identifies the number of times the buoy vertical displacement (heave) crosses zero (indicative of wave motion), is used to calculate six bulk wave statistics: significant wave height (Hsig) and period (Tsig); wave height (H10) and period (T10) of the highest 10% of waves; and the mean wave height (Havg) and period (Tavg).
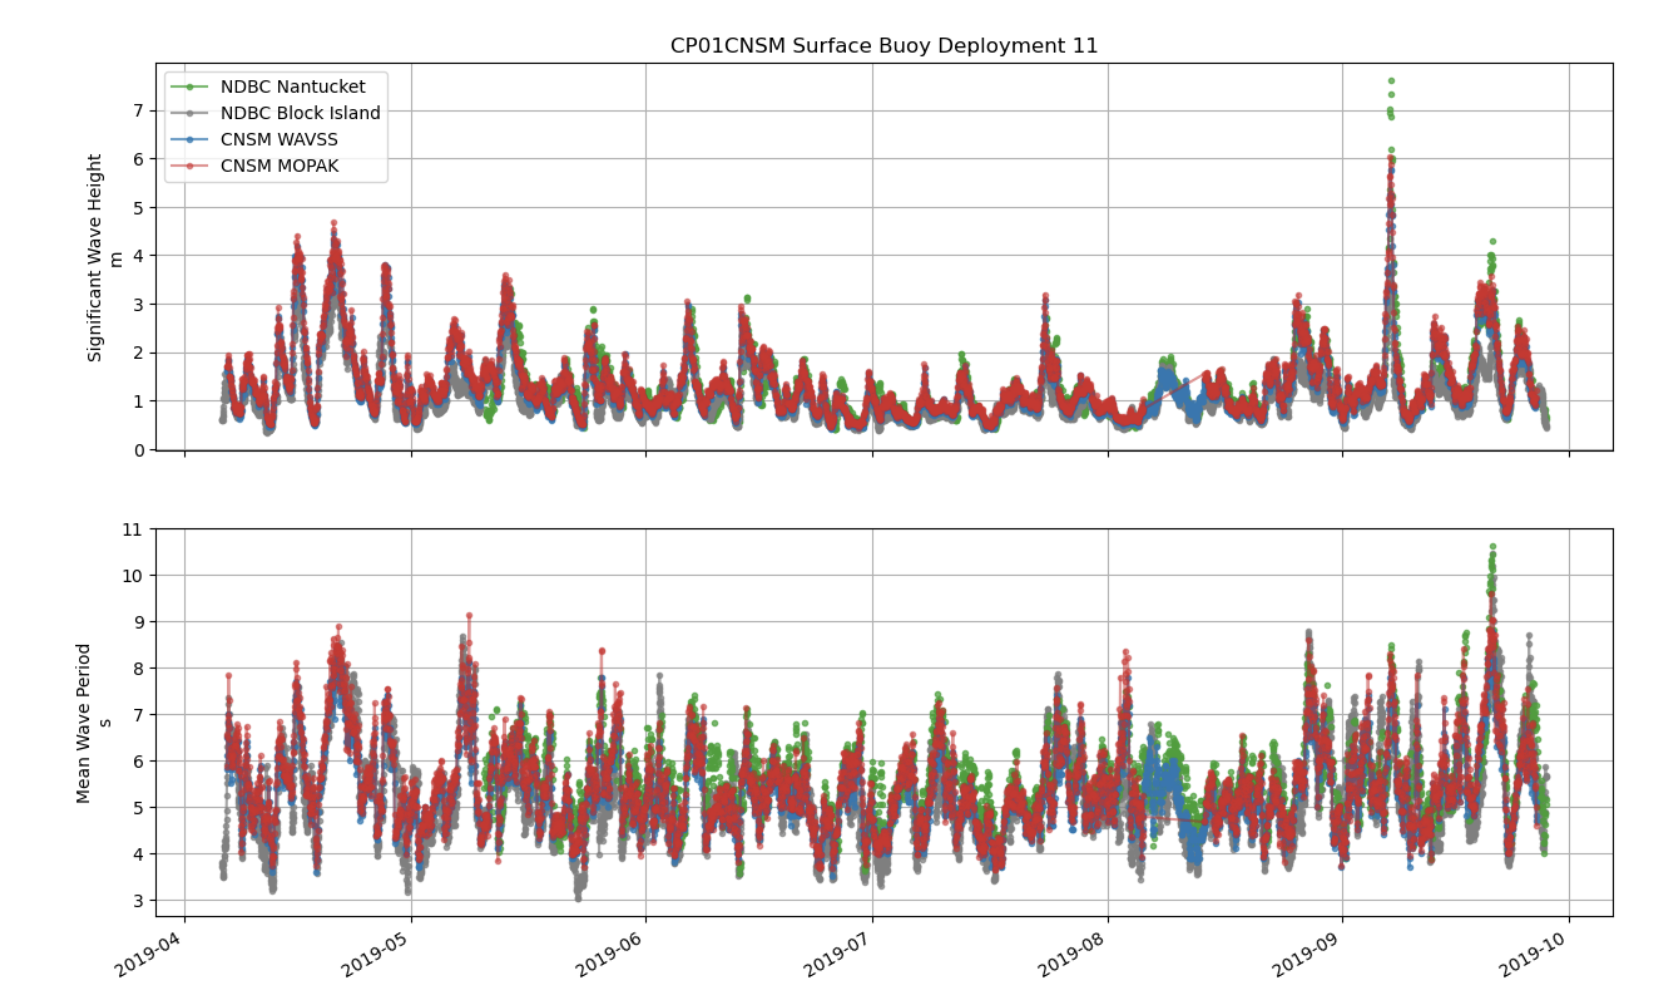
The wave power and cross-spectrums are used to compute five directional wave statistics: peak wave height (Hs) and period (Tp); mean wave direction and spread; and an alternative method for significant wave height (Hm0). The MOPAK-derived wave statistics were validated against, and showed excellent agreement with, both the WAVSS dataset from the CNSM mooring and wave datasets collected by National Data Buoy Center wave buoys 44097 (Block Island, RI – 40.97°N, 71.12°W) and 44008 (Nantucket, MA – 40.50°N, 69.25°W).
The Python code to process a MOPAK dataset into a wave dataset is available to users as the process_mopak.py module in the public OOI Data Exploration GitHub repository. The wrapper function calculate_wave_statistics in the module accepts a deployment’s worth of MOPAK data and returns a new dataset with the calculated wave statistics, including attributes, units, and associated metadata, which may be saved as a new netCDF file. This process triples the number of surface wave datasets at the Pioneer-NES Array, allows for validation of the existing WAVSS wave dataset, and opens new possibilities for studying the wind-wave field across the NES-break.
We encourage users to work with the MOPAK code to generate surface wave statistics, and to submit any questions to the OOI HelpDesk.