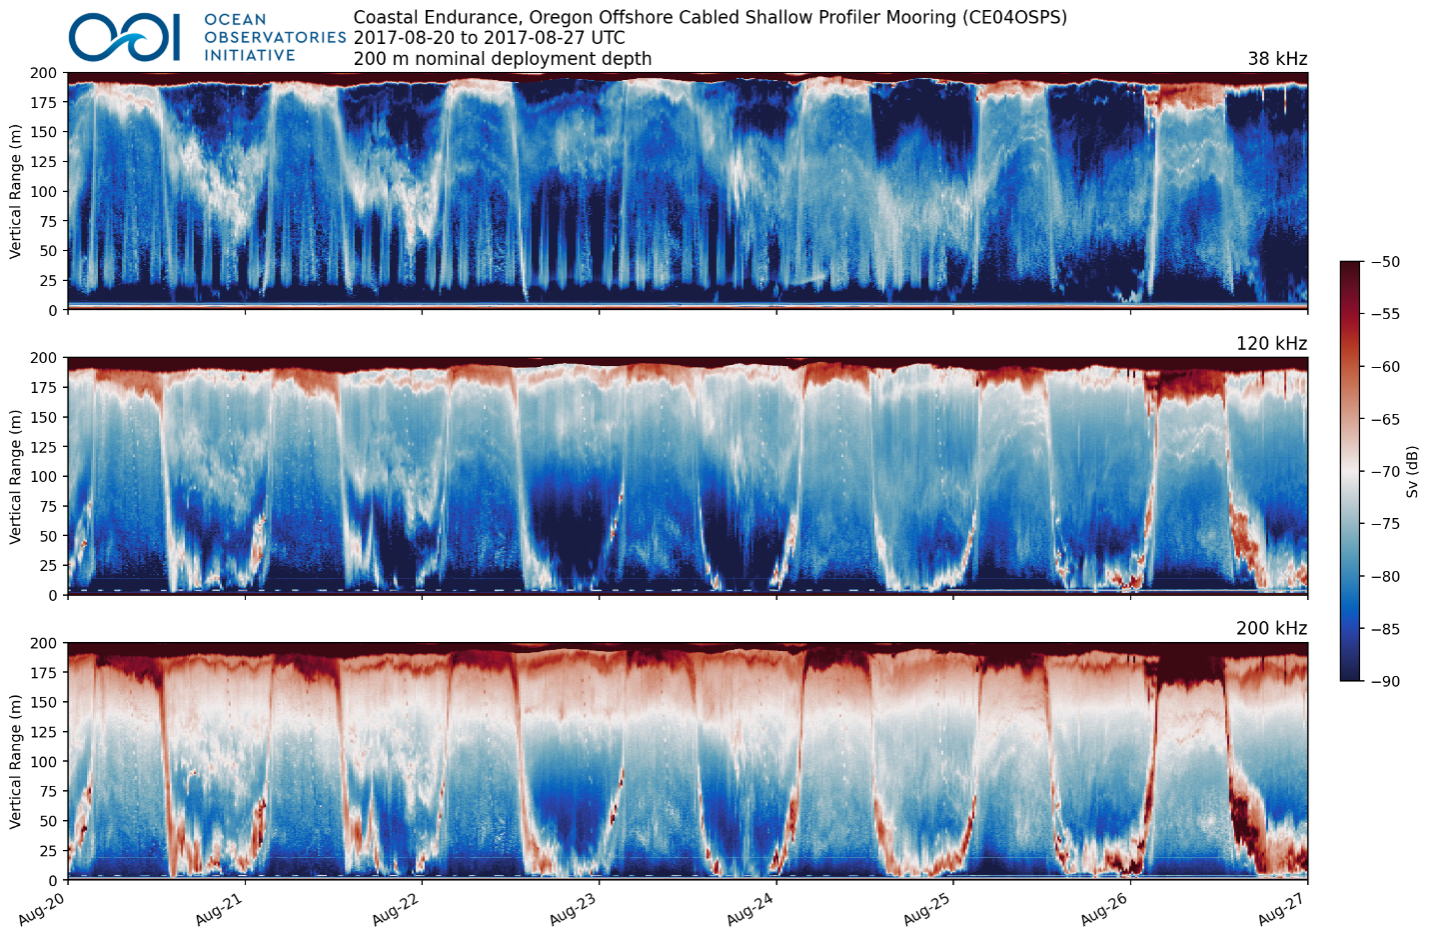
Bio-acoustic Sonar Echograms
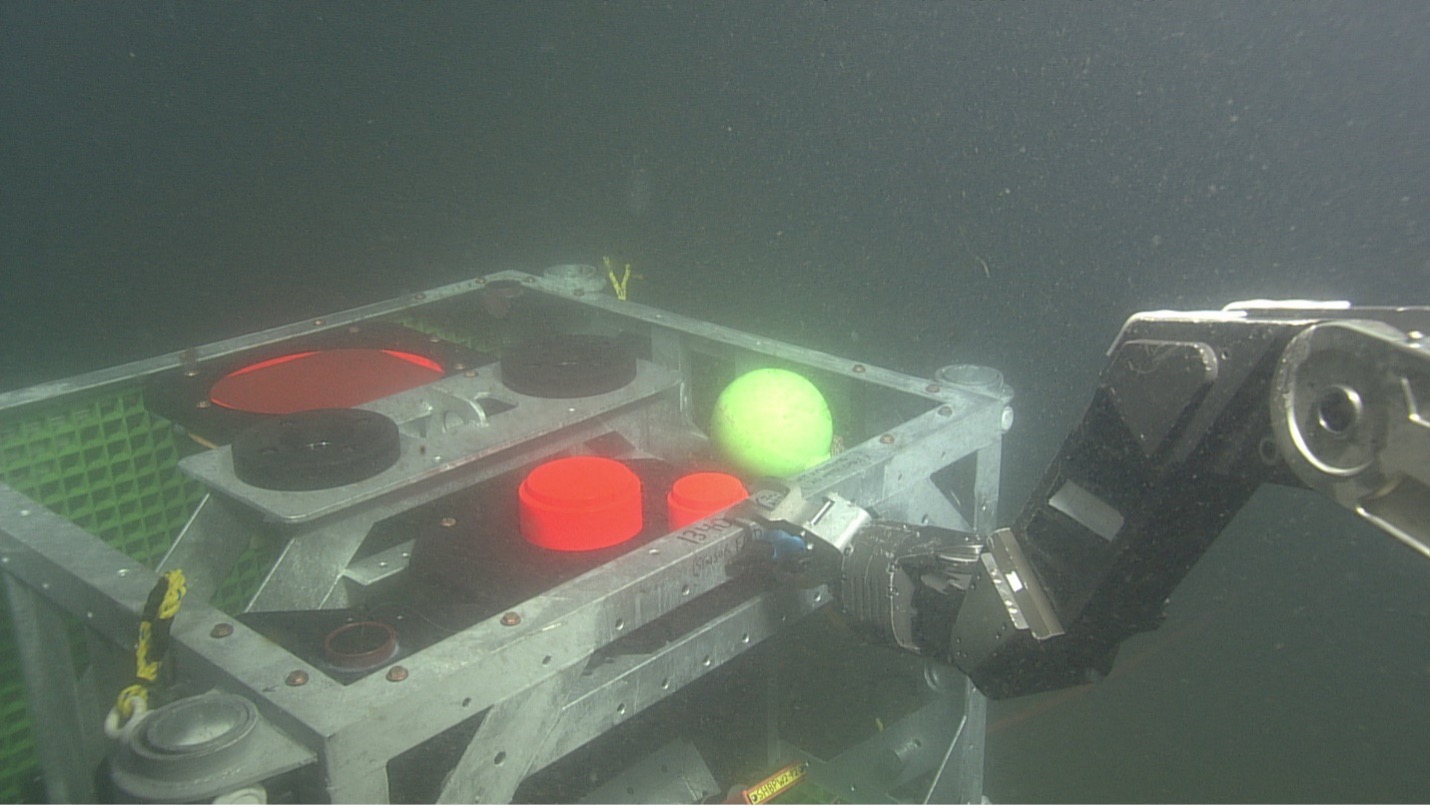
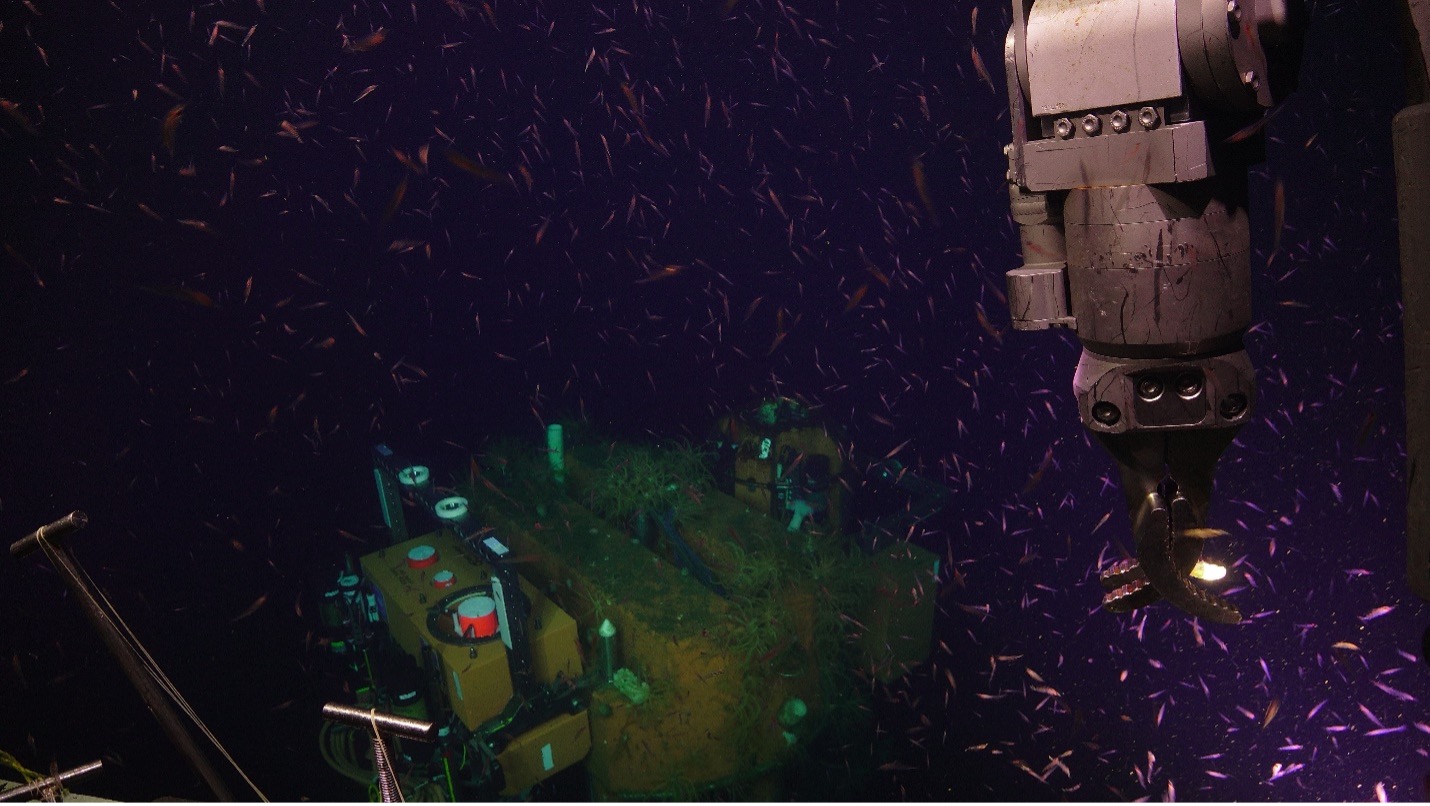
The U.S. National Science Foundation Ocean Observatories Initiative (OOI) deploys bio-acoustic sonar instruments at all Arrays. Modified Kongsberg EK-60 instruments (ZPLSC-B) are deployed at the OOI Regional Cabled Array (RCA) on the seafloor at the OOI Endurance Array Oregon Shelf site (80 m depth) and at 200 m depth on the cabled mooring at the OOI Endurance Array Oregon Offshore site (Fig. 1). The EK-60s are being replaced with the newer EK-80 instruments, which came online during Summer 2023. ASL Environmental Sciences AZFP instruments (ZPLSC-C) are mounted on Surface Mooring Multi-Function Nodes (MFNs) at the Endurance Array Oregon and Washington Inshore sites and the Washington Shelf and Offshore sites, and formerly at the Pioneer NES Array Inshore, Central and Offshore sites (Fig. 2). At the Global Arrays (Irminger Sea, Station Papa, and formerly Argentine Basin and Southern Ocean), upward and downward looking AZFP instruments (ZPLSG-A) are mounted in the top spheres of the Hybrid Profiler Moorings (~150 m depth).
The bio-acoustic sonar data are best visualized using echograms, which require processing the data then plotting the data products. In order to provide more accessible data products to the science community, OOI is generating echograms using the Python package Echopype. The Python code used and developed by OOI to generate the echograms via Echopype is freely available on GitHub. Data from the Endurance, Pioneer, and Global ASL AZFP instruments are processed from recovered instrument data, post-deployment. (Data Explorer refers to this as “Recovered Host” data.) The processing generates daily and weekly NetCDF files of the processed data as well as weekly echograms (Fig. 3), all available in the OOI Raw Data Archive (see the above-referenced GitHub README for file paths). Comparable processing will occur with data from the RCA Kongsberg EK-60 and EK-80 instruments; however, the processing will occur daily as new data are delivered to shore. In addition, the converted raw data files, formatted following the ICES SONAR-netCDF4 convention and produced by Echopype, are also in the Raw Data Archive.
The Echopype-generated NetCDF files from the Raw Data Archive are compiled into the longer time-series visualizations and are available in Data Explorer. More data have been added since our online July 2023 Town Hall, with a recorded version here.
For more information about research using bio-acoustic sonar data, and using the Echopype software, see this excerpt from the OOI Science Plan, 2021. Another example using raw data can be foundhere.