
Is Axial Seamount Napping?
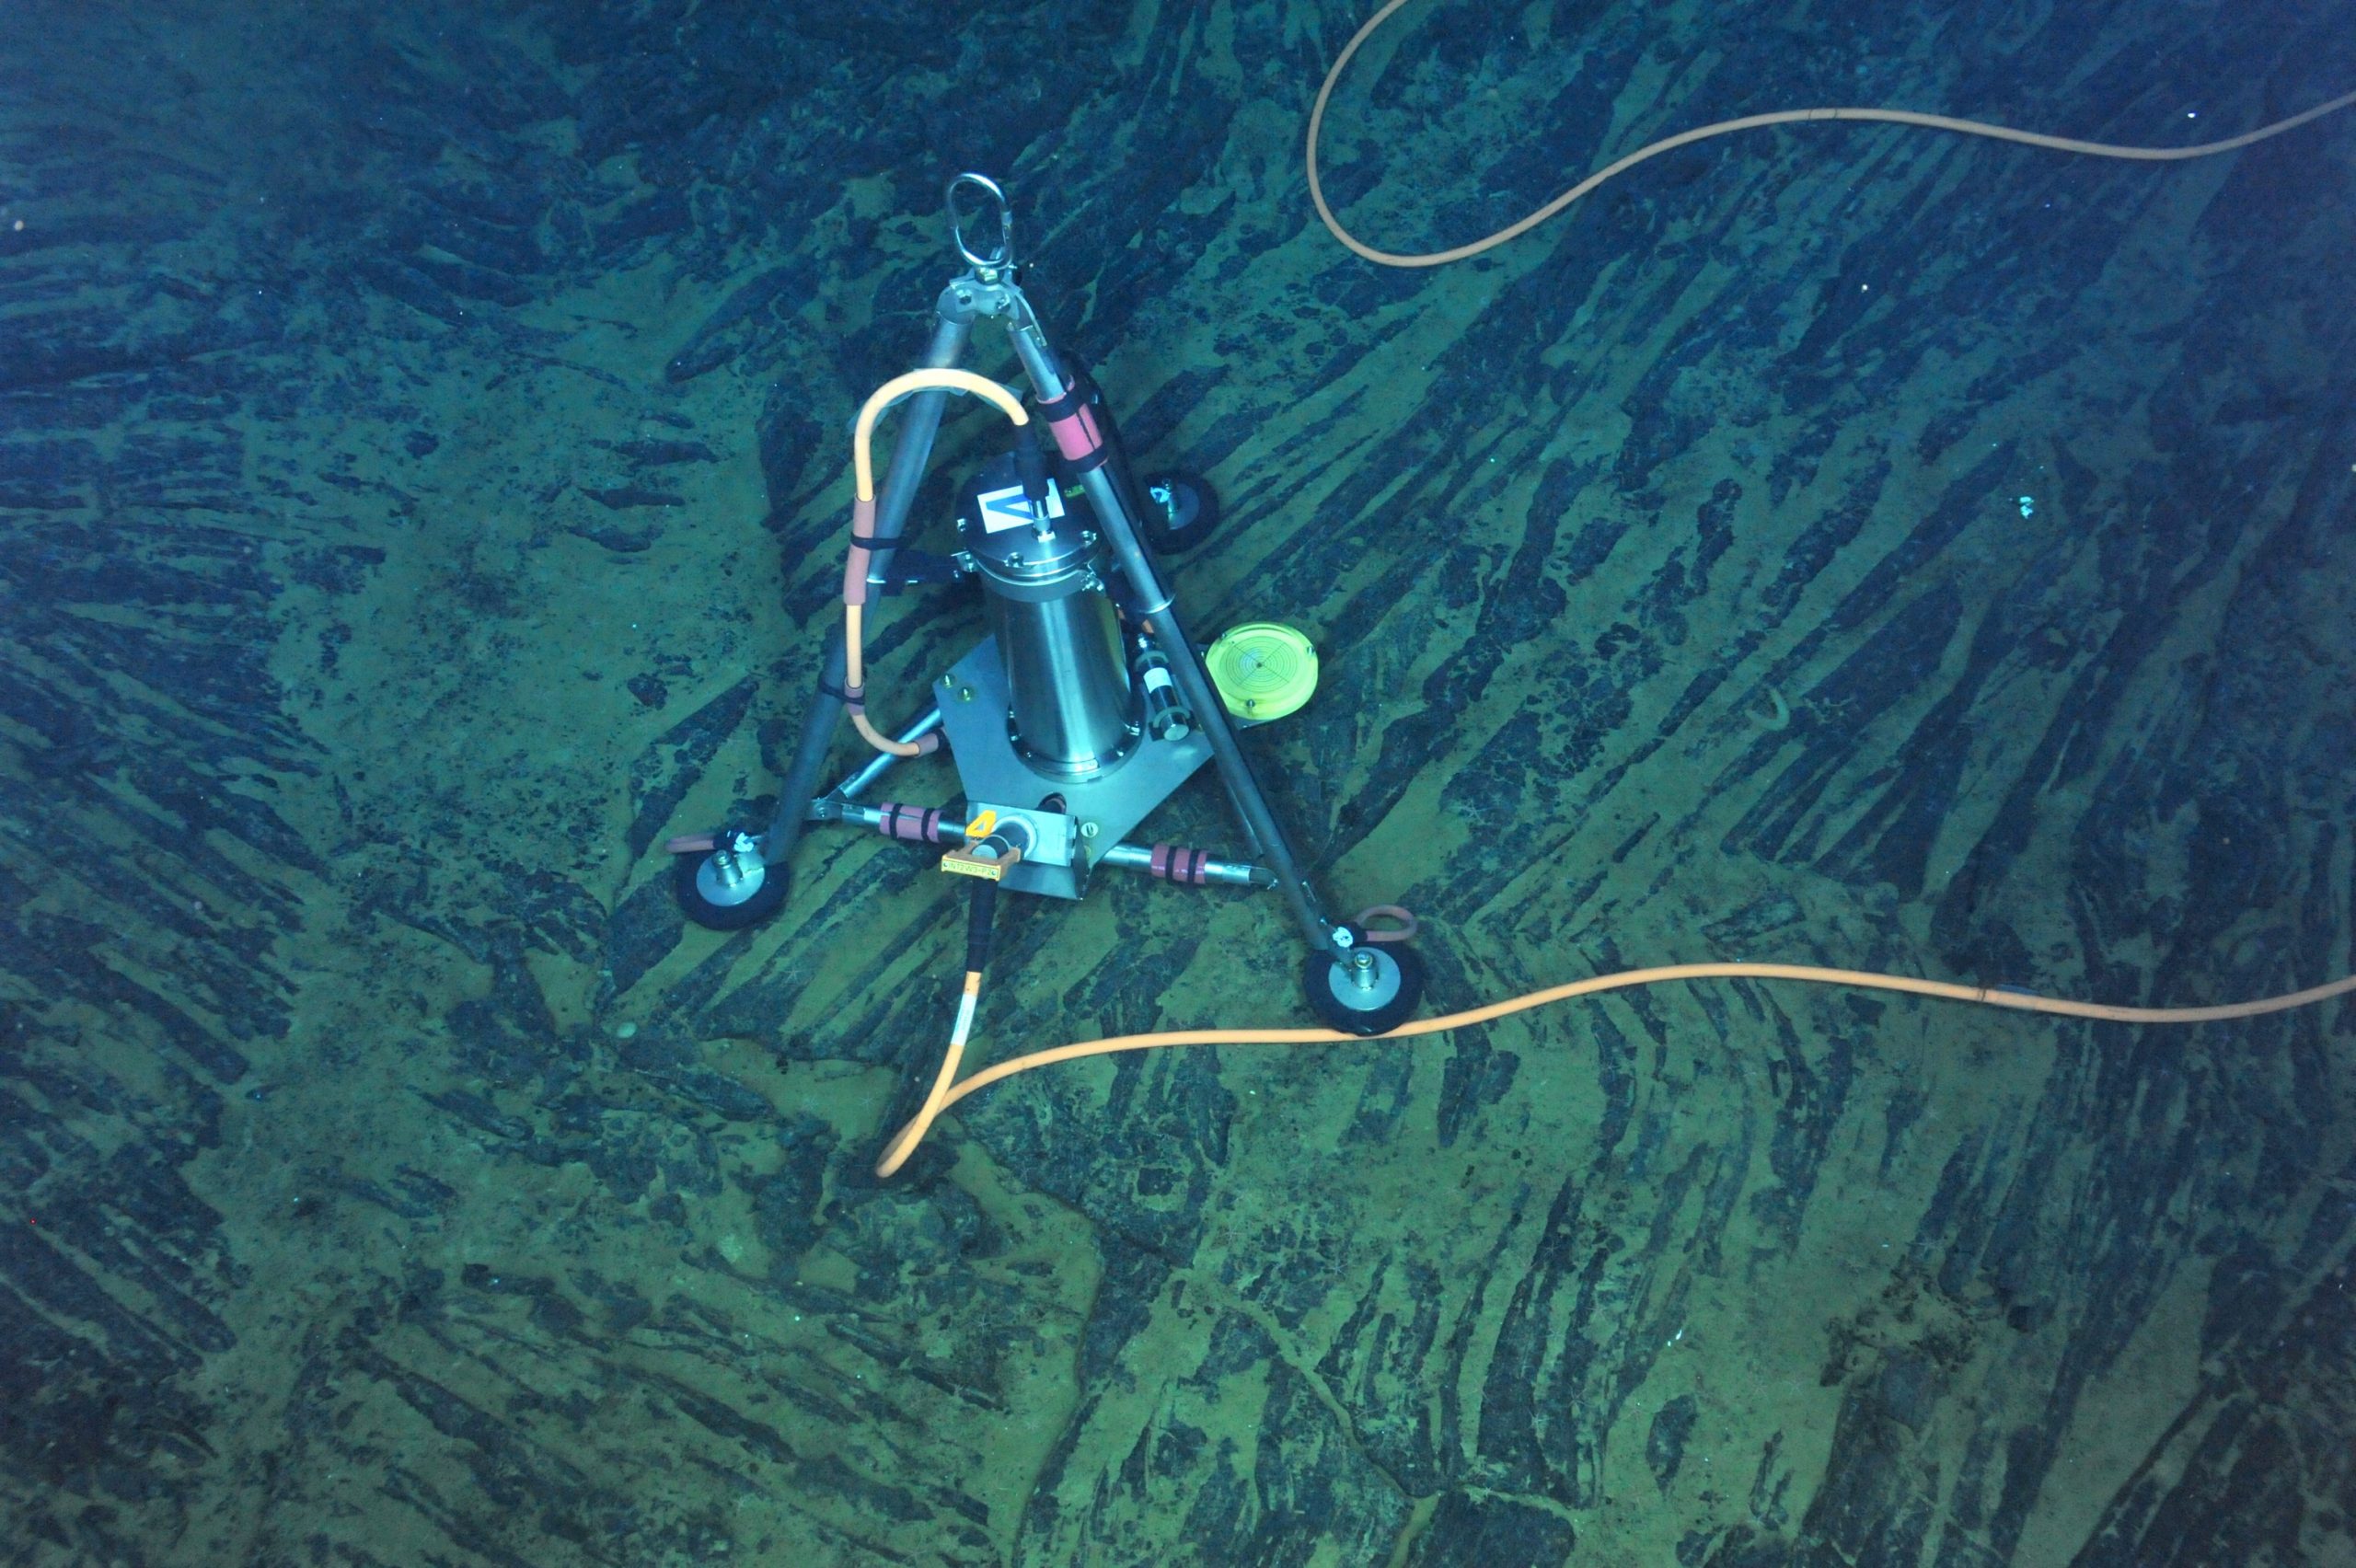
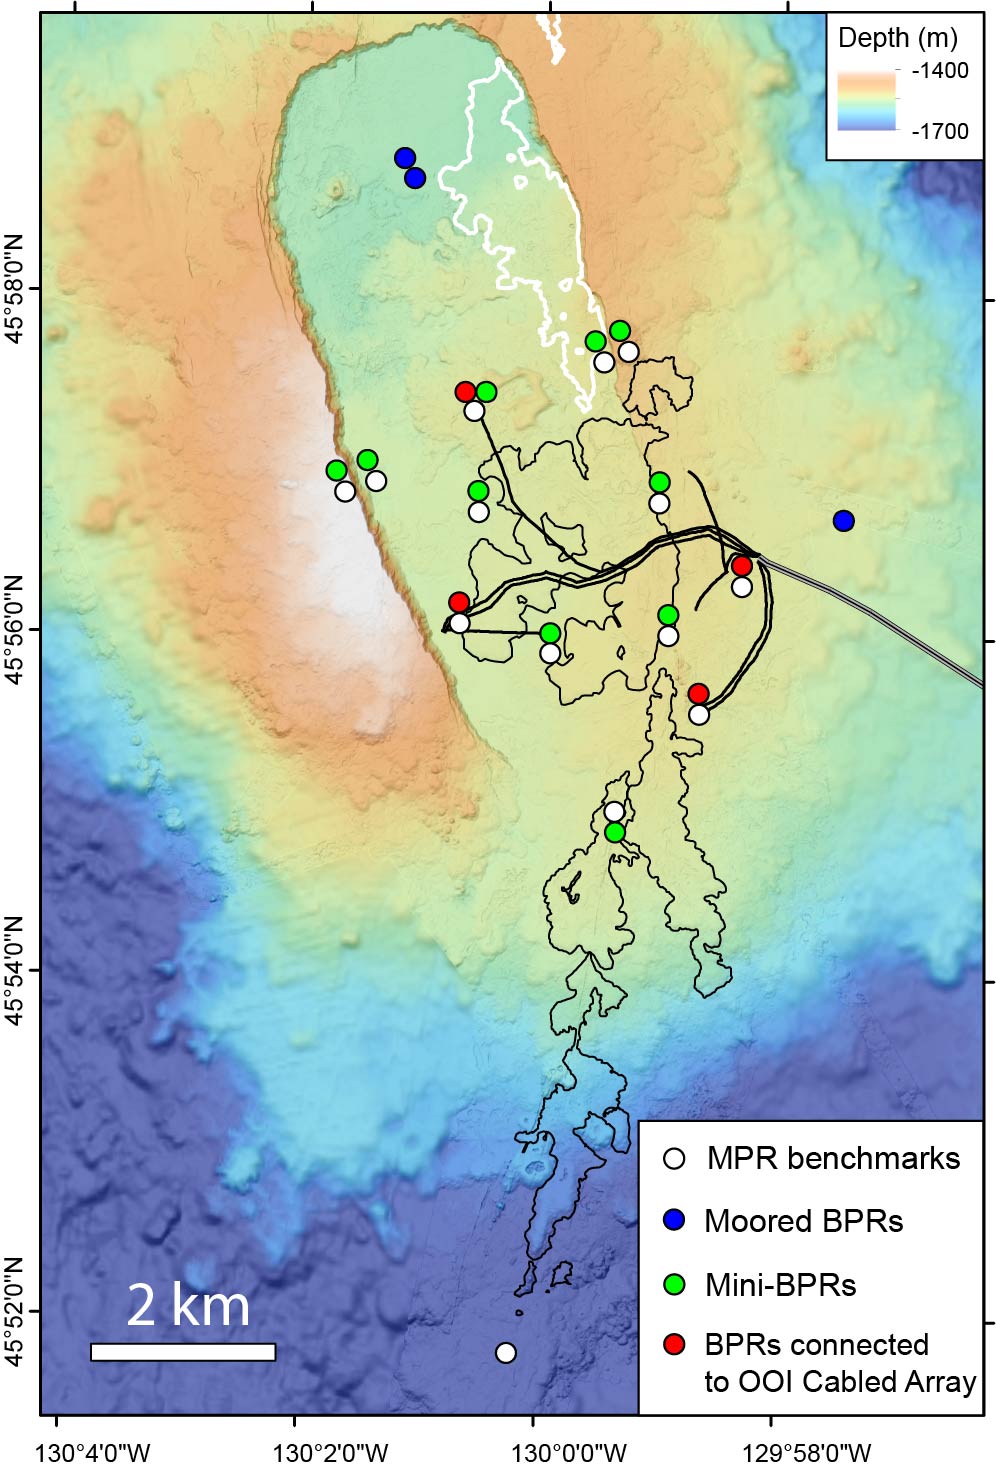
Oregon State University Researcher Bill Chadwick attempted to answer this question in a poster he presented at AGU in December 2023. Chadwick has been watching the “ups and downs” of Axial Seamount for more than 30 years, including its last eruption in 2015. He and other observers monitor the seamount’s activity using bottom pressure recorders (BPR) connected to the US National Science Foundation Ocean Observatories Initiative (NSF OOI) Regional Cabled Array (RCA), operated by the University of Washington, along with additional uncabled BPRs and Mobile Pressure Recorder surveys at an array of seafloor benchmarks every two years using a remotely operated vehicle.
“Axial Seamount has erupted three times in the last 25 years. As of March 2024, the seamount is 90-95% reinflated to the level it reached before the 2015 eruption, so we’re getting close to the eruption triggering point,” said Chadwick. “But on the other hand, the rate of inflation, which started high right after the 2015 eruption, has been decreasing and decreasing since then.”
The inflation rate reached nearly zero last summer (just slightly positive at ~1 cm/year, the lowest rate seen at Axial). “At that very low rate, it was hard to tell how long it would take to reach the 2015 inflation threshold,” Chadwick added.
Since October 2023, however, the rate of uplift has been slowly increasing. University of Washington Researcher William Wilcock’s Axial Seamount Earthquake Catalog page also indicates the seismicity has been on the rise since October 2023, with a large swarm of >600 events on 10 February.
“Since October 2023, the rate of inflation has increased a bit to 5-6 cm/yr, which is still quite low compared to rates we’ve seen over the last 25 years but seems to indicate that Axial may be coming out of its slumber of last summer,” Chadwick explained. “And the earthquake swarm on Feb 10 also seems to support that notion.”
Longer-term eruptive history documented by mapping and dating lava flows at the summit shows that Axial has produced at least 50 eruptions in the last 800 years, (Clague et al., 2013), an average of one every 15-18 years, suggesting that the current lull at Axial might not be long.
“I’m hoping that the rate of inflation will continue to increase, but it’s too early to tell. Anything could happen,“ Chadwick added. “I’m more hopeful than I was a year ago that the next eruption may not be too far off but only time will tell!”
Reference: Clague, D.A., et al., (2013) Geologic history of the summit of Axial Seamount, Juan de Fuca Ridge, Geochem Geophys, Geosystems, doi: 10.1002/ggge.20240.