
OOI Data Sonification
The assumption that quantitative data can be well represented not only in charts and graphs, but by increasingly sophisticated visual displays, is often taken for granted. However, researchers, instructors, and curators of museums and science centers also recognize that even the most sophisticated visual displays are inaccessible to those with low-vision or blindness. There is also the potential for alternative data presentation methods to improve understanding of complex data for sighted individuals. With these considerations in mind, a team led by Dr. Bower (WHOI) has pursued the creation of auditory displays or “data sonifications” using multi-disciplinary U.S. National Science Foundation Ocean Observatories Initiative (OOI) data sets as the basis. The results to date from the NSF-funded data sonification project are reported in a recent publication by Smith et al. (2024).
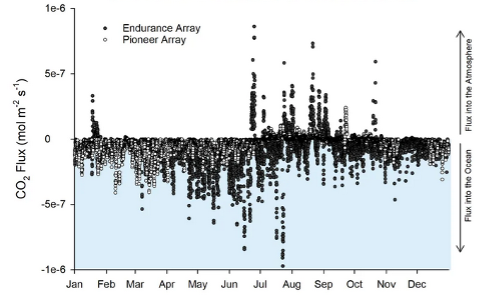
Data sonification involves the mapping of quantitative data from its original form to audio signals in order to communicate complex information content. The project team was interested in using actual ocean data spanning a variety of oceanographic disciplines. Time series data produced by OOI sensors provide an excellent starting point. In particular, the Ocean Data Labs group at Rutgers has reviewed OOI data and created a set of “data nuggets” that are appropriate for sonification (Greengrove et al., 2020). The data nuggets comprise a broad range of oceanographic phenomena observed by OOI sensors, including response to a storm, the diurnal migration of zooplankton, a volcanic eruption, and the flux of CO2 between ocean and atmosphere.
The project team used a rigorous approach to developing and refining the auditory presentations. Starting with a set of learning objectives for each data nugget, a multi-step process was used to create the sonification. First, oceanographers were interviewed to establish the important points to be conveyed for a given data nugget. Next, classroom instructors were interviewed to get feedback on the most effective approaches to using sound to explain data properties. A sound designer then created an initial mapping of the data to sound, which was reviewed by a representative group of researchers, instructors, and blind and visually impaired listeners. After additional rounds of refinement and feedback, the prototype sonifications are now available. Two auditory displays utilizing Pioneer Array data (Fig. 1) are available at https://doi.org/10.5281/zenodo.8162769 and https://doi.org/10.5281/zenodo.8173880 for CO2 flux and storm response, respectively. Other examples can be found in Smith et al. (2024). The sonifications will be evaluated broadly using an on-line survey and by a “live audience” at museums and science centers.
This project is unique in exploiting the rich OOI data set and making ocean science highlights available to a broad community of students and the general public. A significant aspect of the work, as pointed out by the authors, is the systematic and inclusive approach used to develop the data sonifications. Results of the museum testing phase in 2024 will be awaited with great anticipation.
___________________
References:
Greengrove, C., S. Lichtenwalner, H.I. Palevsky, A. Pfeiffer-Herbert, S. Severmann, D. Soule, S. Murphy, L.M. Smith and K. Yarincik, 2020. Using authenticated data from NSF’s Ocean Observatories Initiative in undergraduate teaching, Oceanography, 33(1), 62-73.
Smith, L.M., A. Bower, J. Roberts, J. Bellona and J. Li, 2024. Expanding access to ocean science through inclusively designed data sonifications, Oceanography, 36(4), 96-101.