
Deep-Ocean Vertical Structure
It is often assumed that, at frequencies below inertial, the vertical structure of horizontal velocity and vertical displacement can be reasonably described by a single dynamical mode, e.g. the lowest order flat-bottom baroclinic mode. This is appealing because it would mean that first-order predictions of deep-ocean velocity structure could be determined from knowledge of density and surface currents. However, there is a relative paucity of full ocean depth data to test this idea. A study by Toole et al. (2023) used full ocean depth data from five sites – four of which are Ocean Observatories Initiative (OOI) arrays (Station Papa, Irminger Sea, Argentine Basin and Southern Ocean) – to address the question “does subinertial ocean variability have a dominant vertical structure?”
Data analysis was challenging, because it involved working with gappy records as well as combining information from multiple instruments on different moorings. As noted by the authors, “no single OOI mooring sampled velocity, temperature and salinity over full depth.” Wire-following profiler data from Hybrid Profiler Moorings were combined with ADCP and fixed-depth CTD data from adjacent moorings. While the authors note that “depth-time contour plots of the velocity data from each OOI site clearly reveal the shortcomings of the datasets” they also recognized that despite the shortcomings, “these observations constitute some of the only full-depth observations of horizontal velocity and vertical displacement from the open ocean.”
It was possible to obtain 2-3 years (non-contiguous in some cases) of near-full ocean depth data from each site. Inertial and tidal variability was removed, and the data were filtered over 100 hr (~4 days). Empirical Orthogonal Function (EOF) decomposition was used to identify an orthogonal basis set that described horizontal velocity and vertical displacement. In addition, dynamical modes were determined for three cases: flat bottom, sloping bottom and rough bottom. Note that computing the dynamical modes requires the vertical density profile, which was taken as the mean over each deployment. Analysis was focused on the lowest modes, which accounted for the majority of the variance.
The results (Figure 32) showed that there is an EOF consistent with a dynamical mode at most sites. However, the appropriate dynamical mode is different for each site – no single dynamical accounted for a dominant fraction of variability across all sites. The authors note that differences in bathymetry, stratification and local forcing complicate the picture, with different dynamical processes dominating at different sites. Prior studies (not full ocean depth) that appear to show a “universal” vertical structure may be misleading
This project shows the potential for OOI data, with appropriate processing and analysis, to provide unique insights into ocean structure and dynamics. The researchers have made the combined vertical profile data available to the community on the Woods Hole Open Access Server. The dataset DOI (https://doi.org/10.26025/1912/66426) is also linked here: https://oceanobservatories.org/community-data-tools/community-datasets/.
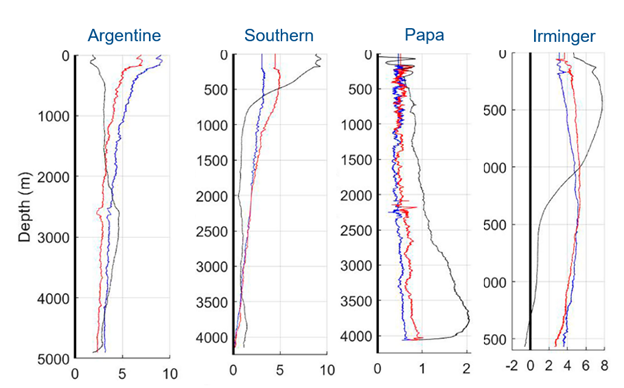
Mode 1 EOFs for velocity (u, red; v blue; cm/s) and vertical displacement (black, decameters) for OOI arrays at (from left) Argentine Basin, Southern Ocean, Station Papa and Irminger Sea. Adapted from Toole et al., 2023.
___________________
References:
Toole, J.M, R.C. Musgrave, E.C. Fine, J.M. Steinberg and R.A. Krishfield, 2023. On the Vertical Structure of Deep-Ocean Subinertial Variability, J. Phys. Oceanogr., 53(12), 2913-2932. DOI: 10.1175/JPO-D-23-0011.1.