
Axial Seamount: The Phoenix Rises
Regional Cabled Array live data feeds from the bottom pressure tilt, seismic, and temperature-resistivity instruments are capturing a marked increase activity at Axial Seamount with total seafloor uplift approaching the threshold depth for the 2015 eruption. As noted by W. Chadwick (OSU), whose website provides daily forecasts, the average differential inflation rate has almost doubled in the last six months. Bottom pressure tilt data at the Central and Eastern Caldera sites, show a marked increase in uplift beginning in April increasing from ~ 6 cm/yr to ~10 cm/year. The increase in uplift rates is coincident with a dramatic increase in seismic activity [viewable on daily plots of earthquakes accessible on W. Wilcock’s Axial Earthquake Catalogue (UW)] with >1000 earthquakes in a 24 hr period also occurring in April: seismic activity remains, high, but has not reached the 1000’s per day as detected prior to the April 2015 eruption (Wilcock et al, 2016). The hydrothermal system in the International District Hydrothermal Field, located on the eastern rift zone within Axial Caldera, is also responding to this increased activity. Fluid temperatures measured by the temperature-resistivity sensor in a parasitic orifice on the side of the hydrothermal vent Escargot show an increase in the past 6 months, with a marked change in the past 3 months (Courtesy of W. Ruef, UW). Excitement is building as we watch this dynamic volcano respond to melt migration 2 km below the seafloor – January 2025 is not far away.
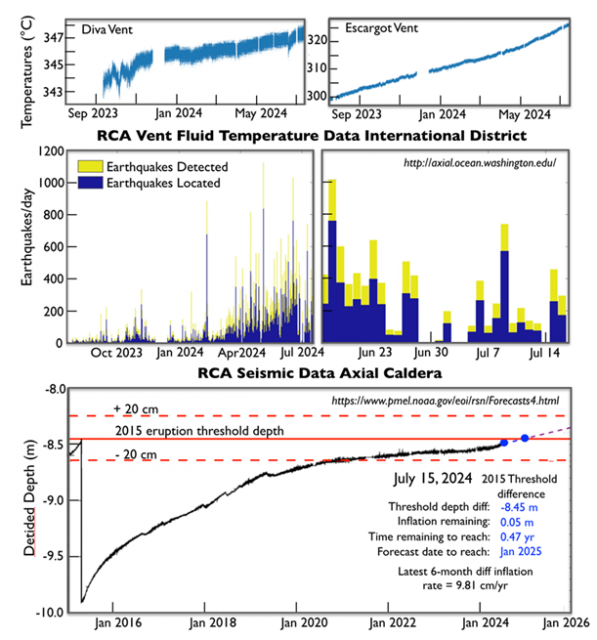
RCA bottom pressure tilt data Central Caldera Axial Seamount