
Subsurface Acoustic Ducts in the Northern California Current System
Xu et al.’s analysis of the hydrographic data recorded along the U.S. Pacific Northwest coastline leads to the identification of a secondary subsurface acoustic duct. A numerical simulation based on the sound-speed field determined from OOI Coastal Endurance and APL-UW glider CTD data suggests that the presence of the duct has major impact on sound propagation at a mid-range frequency of 3.5 kHz in the upper ocean (Figure 31). Specifically, the ducting effect is evident in the trapping of sound energy and the consequent reduction in transmission loss within the duct. Glider observations show that the duct is a large-scale phenomenon that extends hundreds of kilometers from the outer continental shelf to regions offshore of the continental slope. The axis of the duct shoals onshore from between 80 and 100 m depth offshore of the continental slope to less than 60 m over the shelf. Analysis of the sound-speed profiles determined from glider CTD data suggests that the prevalence of the duct decreases onshore, from over 40% in regions offshore of the continental slope to less than 5% over the shelf. In addition, analysis of the long-term time series of sound-speed profiles determined from the CTD data recorded over the shelf slope off the Washington Coast suggests that the duct is more prevalent in summer to fall than in winter to spring. Furthermore, examination of concurrent OOI Coastal Endurance Array (Washington Offshore Profiling Mooring) observations of sound speed and flow velocity indicates that the duct observed over the shelf slope is associated with a vertically sheared along-slope velocity profile, characterized by equatorward near-surface flow overlaying poleward subsurface flow.
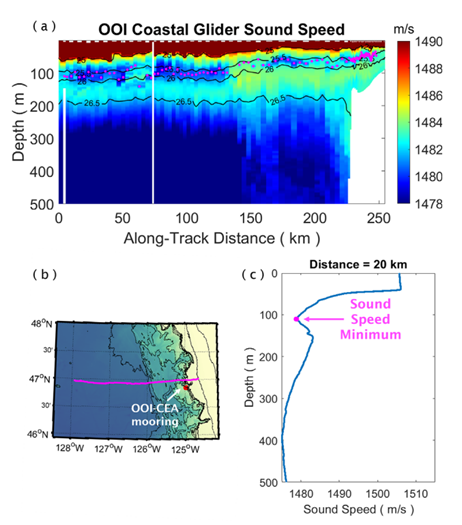
(adapted from Fig. 3 of Xu et al., 2024) (a) The sound-speed field obtained from the CTD data recorded by an OOI-CEA coastal glider during 06-16 October 2018. The contour lines are potential density (in kg/m3). The magenta dots mark the locations of the local sound-speed minima along the axis of the subsurface duct. (b) The trajectory of the Seaglider. The red dot marks the location of the OOI-CEA Washington Offshore profiler mooring. The bathymetry contour lines mark seafloor depths in 100 m increments between 10 and 500 m and then in 500 m increments between 500 and 3000 m. (c) The vertical sound-speed profile at 20 km along-track distance. The local sound-speed minimum at the axis of the duct is labeled.
___________________
References:
Guangyu Xu, Ramsey R. Harcourt, Dajun Tang, Brian T. Hefner, Eric I. Thorsos, John B. Mickett; Subsurface acoustic ducts in the Northern California current system. J. Acoust. Soc. Am. 1 March 2024; 155 (3): 1881–1894. https://doi.org/10.1121/10.0024146