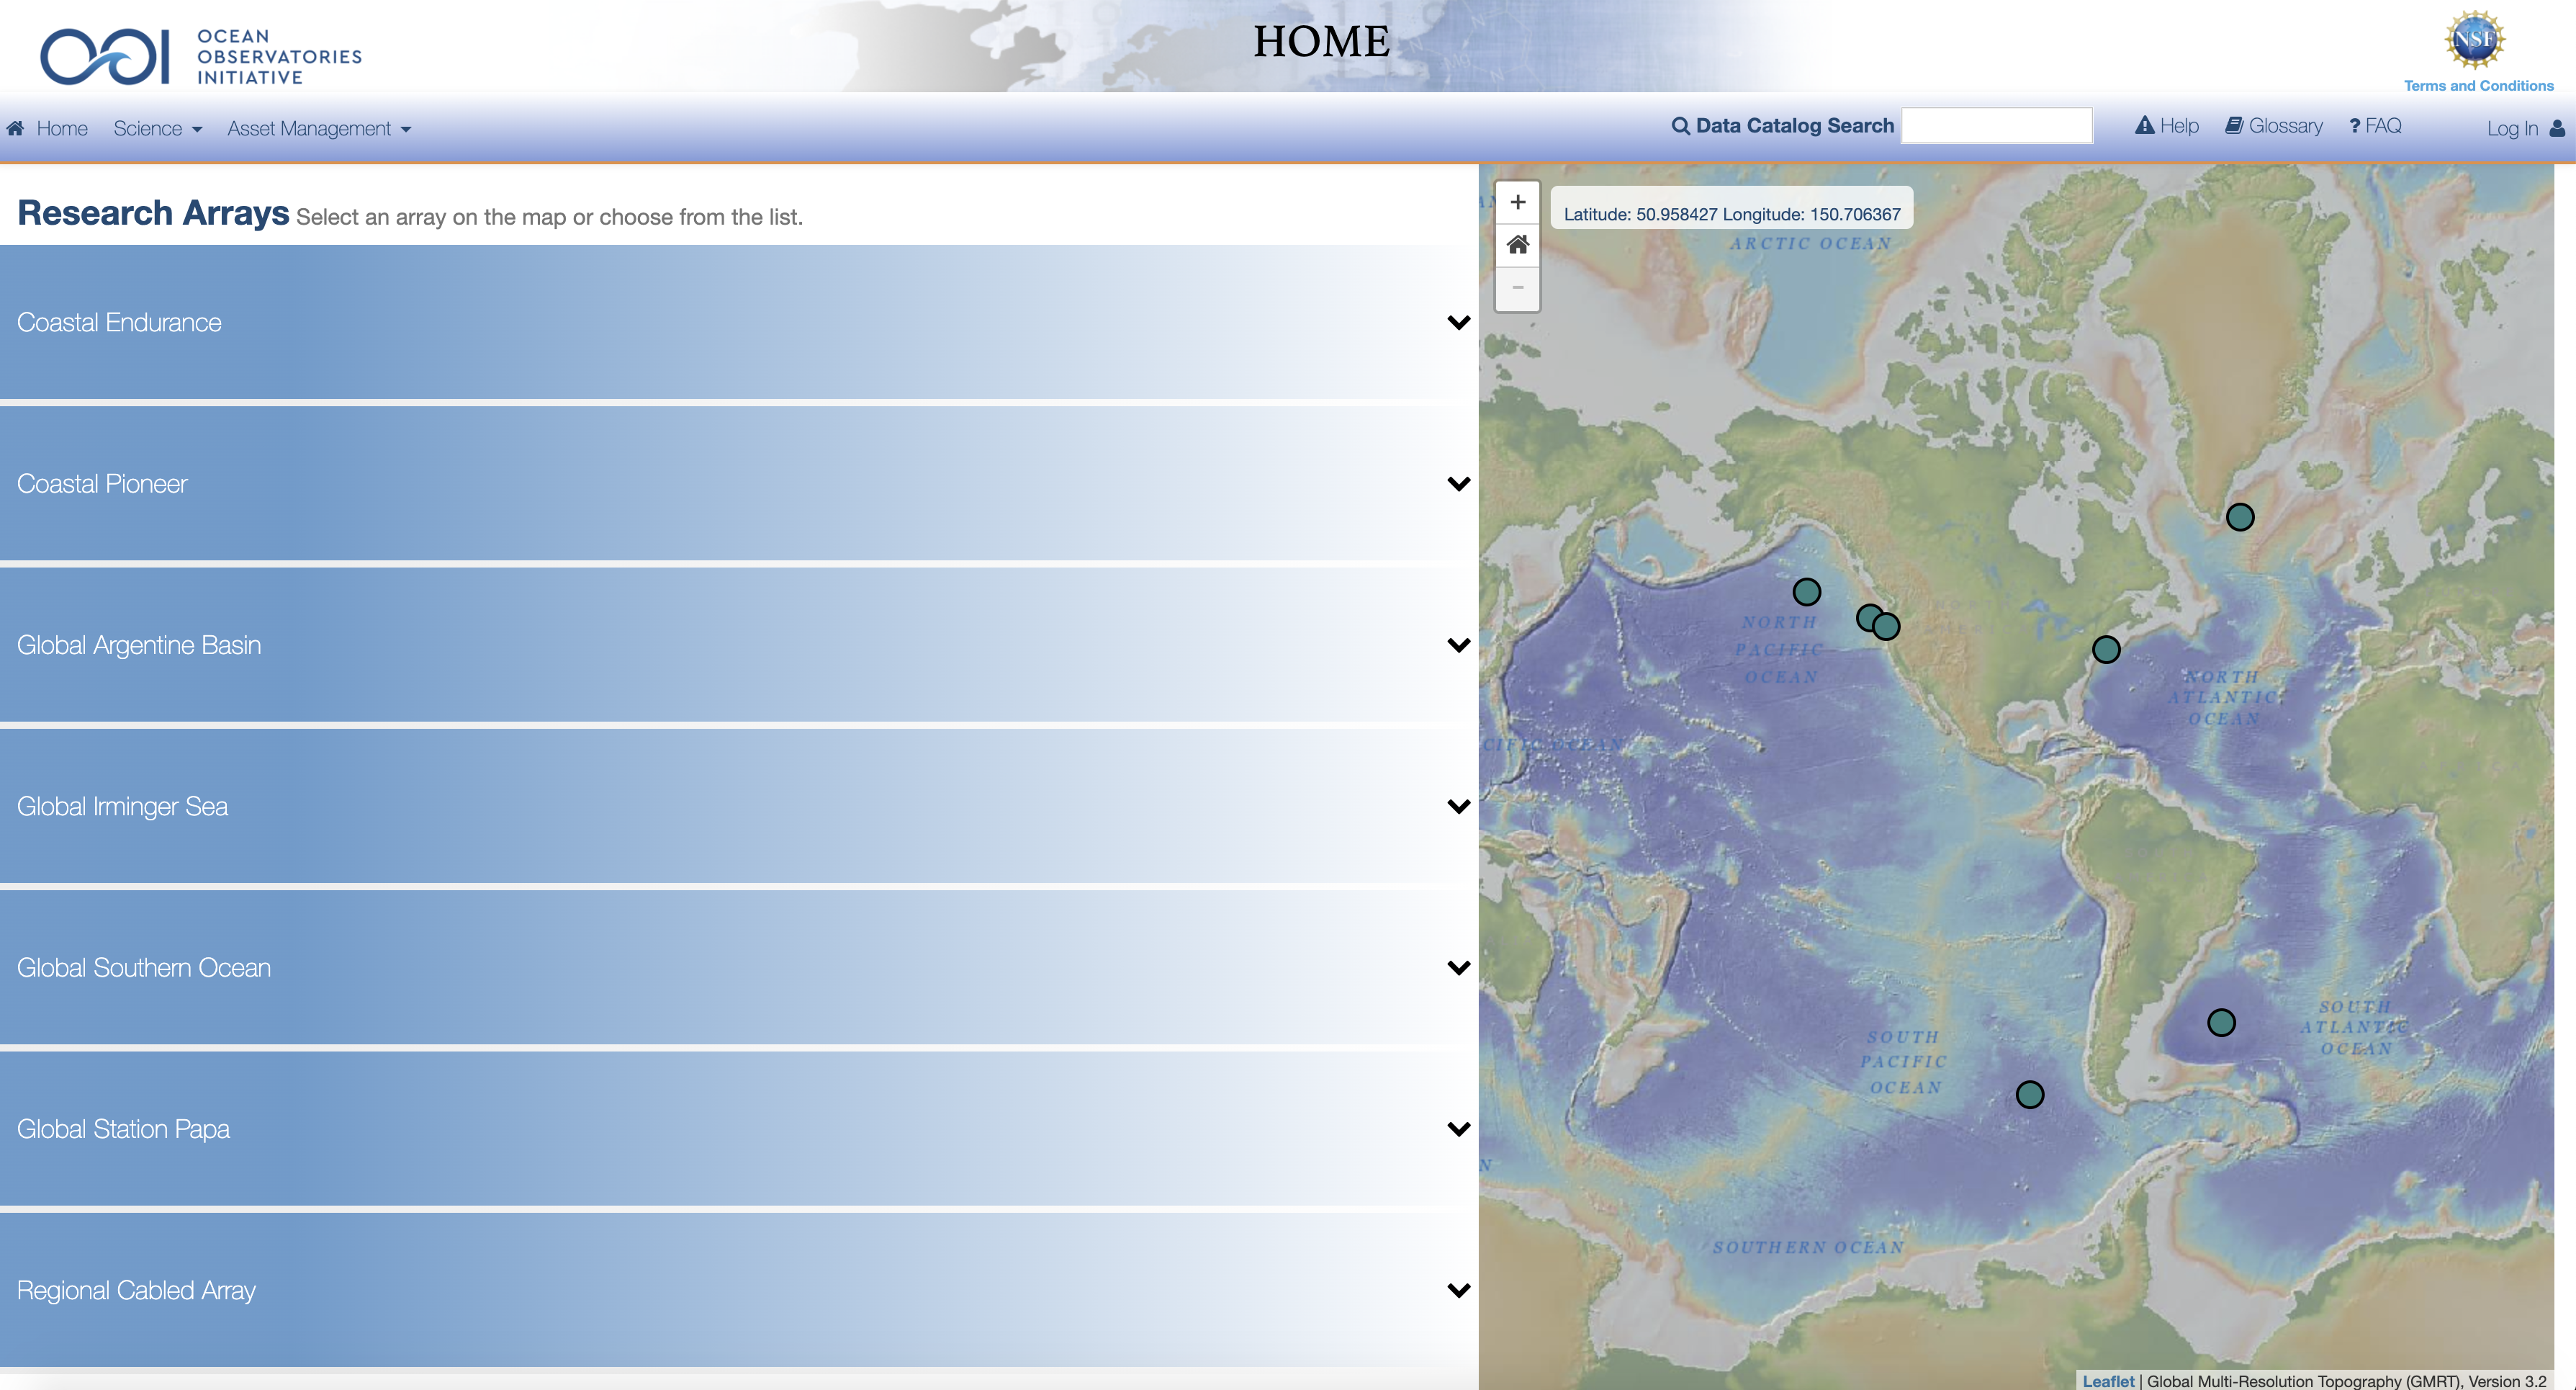
Data Portal
OOI’s data portal contains data from each of OOI’s seven arrays (including the suspended Southern Ocean and Argentine Basin Arrays), 80 platforms, and more than 900 instruments, measuring 200 different ocean parameters. Designed as a one-stop shop to get users the data they need, the portal is a key resource to answer important science questions about the changing ocean.
Users can access real-time data from the Regional Cabled Array. From the Coastal and Global Arrays, users can access both telemetered (real-time data from deployed instruments) and recovered data, which is downloaded once instruments have been recovered, via the portal. You can explore OOI data and create customized searches by location, time, and ocean parameters measured. Users can also avail themselves of portal features such as generating plots and visualizing data for easy incorporation of data results into research papers and classroom activities.
Visit the OOI Data PortalA Quick Tour of the OOI Data Portal
This short video provides a quick overview of the OOI data portal, including how to browse the list of OOI sites, the Data Stream catalog, how to create a quick plot, and more.
To access the data portal (also referred to as OOI.net), you must create a user name and log on to access a wealth of ocean data. You may log on using either an account with your home organization, via CILogon, or a local OOI account using your email address.
If you’d like to see exactly what’s entailed, watch the video below:
Data Portal Tutorials
Looking for more? Check out the following data tutorials in our Knowledge Base.

