OOI Team First to See April 24, 2015 Eruption of Axial Seamount

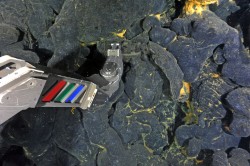
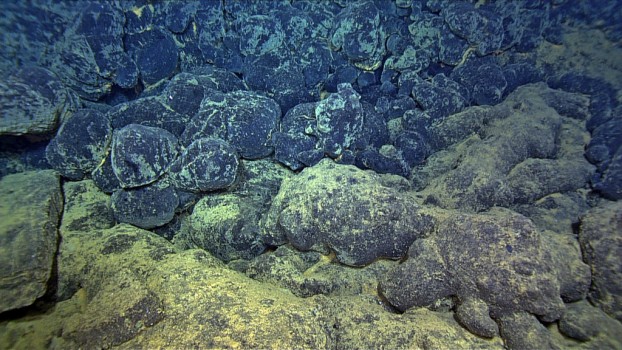
At 7:33 p.m. PST on July 26th, 2015, after descending ~1840 m beneath the oceans surface, the remotely operated vehicle ROPOS and the University of Washington Ocean Observatories Initiative (OOI) Cabled Array team set first eyes on the April 24th, 2015 voluminous eruption of Axial Seamount during the VISIONS’ 15 cruise. Within two minutes of reaching the seafloor, fresh bulbous pillow flows on top of older flows were encountered.
ROPOS slowly ascended the huge mound of glassy basalts, which had cascaded down from a 30° slope above. Spectacular, twisted tubular forms marked the face of the lava flow. From the toe of the eruption, the ROV ascended 90 m (295 ft) up its face, before reaching the summit of this massive flow that reaches 670 m across at its thickest point. A prior bathymetric survey of this area shows that the eruption extends ~ 7 km along the northern rift zone of Axial Seamount.
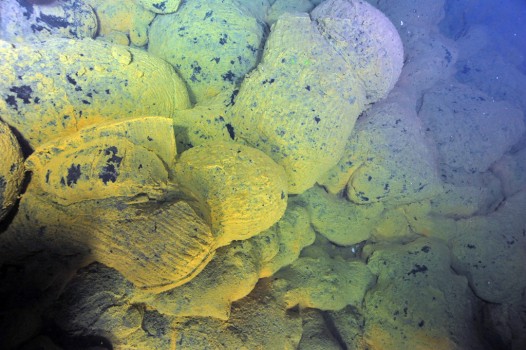
At the flow summit, ROPOS drove through a ‘blizzard’ of white flocculant material issued from small crevices between pillow flows, where water temperatures reached up to 18°C. Methane and sulfur-utilizing organisms, thriving within voids beneath the new lava flow, likely generated this material. Perhaps most impressive were thick orange mats of bacteria that completely coat broad expanses of this three month old flow.
The April 24th eruption was detected in real-time by seismometers, hydrophones and pressure-tilt instruments on the summit of the volcano as part of the OOI Cabled Array infrastructure. Indeed, over an ~24 hr period, the instruments streaming live data back to shore detected ~8000 earthquakes, a drop in the seafloor of 2.4 m, and acoustic signals reminiscent of underwater explosions. Preliminary data from these instruments are currently available here.

This exploration dive occurred while the OOI Cabled Array team was preparing a Deep Profiler Mooring for installation at the base of Axial Seamount. The team was also performing scheduled maintenance on other instrumentation and platforms that were installed in 2014.

Images and bathymetric survey data of the eruption are available through the Marine Geoscience Data System portal. Daily updates on the cruise and digital imagery can be accessed through the University of Washington VISIONS’15 educational website.
