
SAR Imagery Detects Atmospheric Stratification
(Adapted from Stopa et al., 2024)
There is interest in using satellite-based Synthetic Aperture Radar (SAR) imagery to assess phenomena related to atmospheric boundary layer stratification over the ocean. Obtaining such information with high spatial and temporal resolution would advance boundary layer research and would be beneficial to the development of offshore wind energy. However, monitoring marine boundary layer structure remotely is a challenge. A recent paper by Stopa et al. (2024) shows that it is possible to utilize SAR imagery, in conjunction with in-situ meteorology, to characterize boundary layer stratification.
The Central Surface Mooring (CNSM) of the OOI Pioneer New England Shelf Array is located near a region of offshore wind development where SAR imagery is also available. The authors use wind speed, air temperature, and sea surface temperature from the CNSM buoy to estimate the bulk Richardson number (Ri), a measure of marine atmospheric boundary layer stability. OOI quality control flags were used to identify good data, and suspect data were replaced with data from redundant sensors. CNSM data from 2014 – 2021 were used in the analysis.
SAR data are commonly used to provide wind speed estimates, but the images also contain rich information about coherent structures in the atmosphere, and those structures correspond to boundary layer stratification regimes (Stopa et al., 2022). The Stopa et al., (2024) study used European Space Agency Sentinel-1 C-band SAR wave mode (S1 WV) imagery spanning the region of the NES Pioneer Array. SAR Images in 20 x 20 km regions were visually examined and classified based on observed “signatures” of atmospheric phenomena. Of particular interest for this study were signatures indicative of waves, rolls/streaks and convection (Table 1).
The relationship of SAR image classes to wind speed and atmospheric stability was examined by plotting the classified data set vs Ri and U10 (Figure 1). U10 shows a change in slope near neutral stratification (Ri = 0) with indications of a Ri-U10 relationship at higher and lower Ri. Of interest is the appearance of Ri boundaries denoting transitions between unstable (Ri < -0.01), neutral, and stable (Ri > 0.01) regimes. Rolls, streaks and convection dominate the unstable regime, while waves dominate the stable regime. In other words, classification of the SAR images provides information about atmospheric stratification.
This project shows the power of combining remote sensing with long-term, in-situ meteorological measurements to gain insights that neither could provide alone. The authors note that when satellite data are available, the SAR-based determination of boundary layer structure can be used over broad areas and long times, and is more efficient than direct measurements such as buoy-based LIDAR.
Table 1: Atmospheric signatures in SAR imagery
| Class | Phenomena |
| NV | Lack of rolls or cells |
| AW | Atmospheric gravity waves |
| IW | Oceanic internal gravity waves |
| WS | Rolls or wind streaks |
| MC | Microscale convection |
| WS/MC | Combined WS/MC |
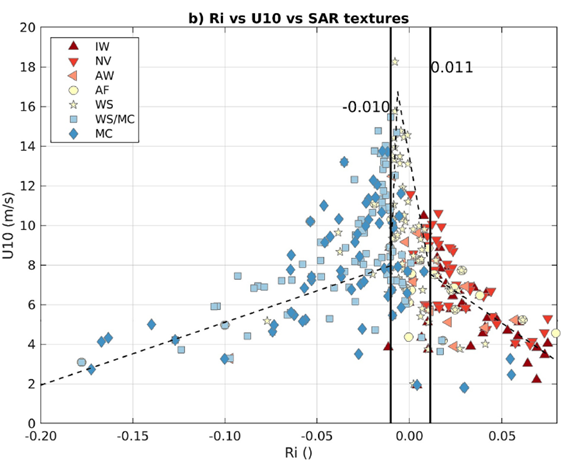
Figure 1. SAR image classes shown as different symbols) vs. Richardson number (Ri) and ten meter wind speed (U10). Note the regime transitions near Ri = -0.01 and +0.01. From Stopa et al., 2024.
___________________
References:
Stopa, J.E., C. Wang, D. Vandemark, R.C. Foster, A. Mouche, and B. Chapron, (2022). Automated Global Classification of Surface Layer Stratification Using High-Resolution Sea Surface Roughness Measurements by Satellite Synthetic Aperture Radar,” Geophysical Research Letters 49(12), e2022GL098686.
Stopa, J.E., D. Vandemark, R. Foster, M. Emond, A. Mouche, and B. Chapron (2024). Characterizing the Atmospheric Boundary Layer for Offshore Wind Energy Using Synthetic Aperture Radar Imagery. Wind Energy, 27:1340–1352, https://doi.org/10.1002/we.2933.