
Nine years of water sampling data from the Pioneer New England Shelf Array now Available through BCO-DMO
OOI’s collaboration with the Biological & Chemical Oceanography Data Management Office (BCO-DMO) continues to expand. A new dataset compiling all discrete water sampling data from the Pioneer New England Shelf (NES) Array from 2013 to 2022 has been archived and is now publicly accessible through BCO-DMO.
OOI and BCO-DMO launched this partnership in 2023 to make OOI water sampling data broadly accessible through both the BCO-DMO website and BCO-DMO’s ERDDAP server. BCO-DMO curates oceanographic data for public use in alignment with FAIR data principles, ensuring datasets are findable, accessible, interoperable, and reusable.
Distributing OOI water sampling data through BCO-DMO provides several key benefits. The cruise-by-cruise discrete data sheets are concatenated into a single dataset, assigned a Digital Object Identifier (DOI), and served via ERDDAP to enable both user-friendly browsing and machine-to-machine access. In addition, each dataset is accompanied by detailed descriptions of sampling and processing methods and includes README files for every contributing cruise.
With the addition of the Pioneer NES Array, BCO-DMO now hosts compiled OOI discrete water sampling datasets from each of the following arrays:
- Station Papa Array
- Irminger Sea Array
- Southern Ocean Array
- Argentine Basin Array
- Pioneer NES Array (newly added)
You can access each of these datasets through this BCO-DMO project record for all OOI Discrete CTD and Water Sampling Cruise Data, or from the BCO-DMO home page by selecting Projects and searching for “OOI Discrete CTD and Water Sampling Cruise Data.”
Figures 1 and 2 provide example plots generated from the nine-year Pioneer NES Array. A Python script (implemented in a Jupyter Notebook available here) was used to access the data from the BCO-DMO ERDDAP server, extract variables of interest, apply available quality control (QC) flags and visualize the data. Figure 1 shows profiles of selected variables for successive cruises to give a sense of the depth-time data coverage. Note that the sample depths are generally concentrated in the upper 200 meters of the water column at Pioneer NES since the OOI sampling goal is to validate instruments on the moorings rather than collect comprehensive profile data. Samples at depths greater than the maximum moored instrument depth of 450 m were collected to support mobile asset or collaborative cruise operations on the outer shelf. Figure 2 represents profile variability over time by overlaying all discrete observations for oxygen, salinity and nitrate with the color gradient representing the date of observations.
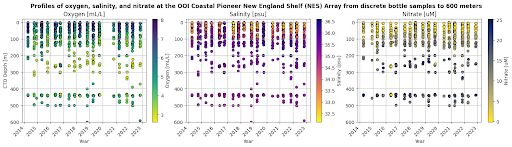
Figure 1. Profiles of oxygen, salinity, and nitrate at the OOI Coastal Pioneer New England Shelf (NES) Array from discrete bottle samples.
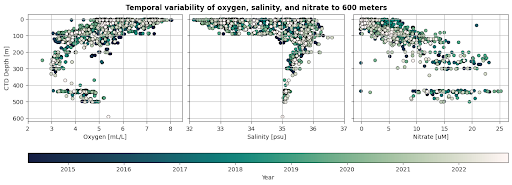
Figure 2. Temporal variability of oxygen, salinity, and nitrate from discrete bottle samples over 9 years depicted as overlaid profiles.
The discrete water samples are collected in conjunction with standard CTD casts. For several variables (e.g. salinity, chlorophyll, oxygen) this allows comparison between CTD sensors and discrete samples at each depth where a Niskin bottle is closed. In Figure 3, discrete sample oxygen observations at the 3 coastal surface mooring sites of Pioneer NES in Fall 2021 exhibit good agreement with the CTD rosette-mounted SBE 43 Dissolved Oxygen Sensor.
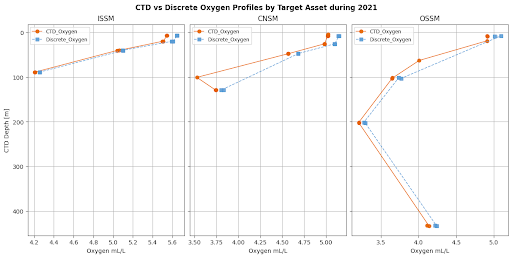
Figure 3. Profiles of discrete sample oxygen and CTD rosette-mounted oxygen observations at the time of bottle closure for comparison.
Note that target asset names for the Pioneer NES array may differ slightly between cruises. For example, “CNSM” (used in Fall 2021) and “CN” (used in Spring 2021) refer to the same station location. Discrete README files within the BCO-DMO dataset and CTD Cast Logs on OOI’s Raw Data Archive can provide useful information to help identify relevant samples.
Figure 4 highlights additional seasonal insights offered by the Pioneer NES dataset through biannual research cruises, usually in the Spring and Fall of each year. The CTD temperature observations at bottle depths show strong seasonal variability as the surface layer transitions from stratified to well-mixed. A similar but more subtle signal also appears below 60 meters. The discrete water sample properties captured during Pioneer NES cruises constitute a long-term record of seasonal changes in water mass properties on the shelf and slope.
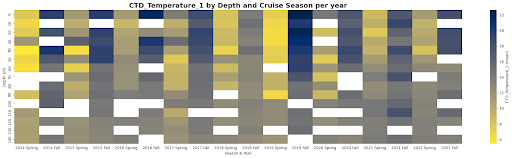
Figure 4. Hovmöller diagram of seasonal mean sea water temperature in the upper 150 meters of the water column surrounding the array.
For additional Python scripts to explore OOI Discrete CTD and Water Sampling Cruise Data as distributed by BCO-DMO, see the Jupyter notebooks available in this GitHub repository: https://github.com/WHOIGit/ooi-on-bco-dmo/tree/main/notebooks.