
Effects of Dissolved Oxygen and Hypoxia on Catch Rates of Nearshore Groundfishes in a Recreational Hook and Line Fishery
Rasmuson et al. (2026) investigate the impact of hypoxic events on a nearshore, multispecies recreational groundfish fishery along the Oregon coast. Using dissolved oxygen (DO) data from the National Science Foundation’s Ocean Observatories Initiative (OOI) Oregon Inshore Mooring (2018–2022, excluding 2020) and trip-level recreational fishery catch data from the Oregon Department of Fish and Wildlife, they modeled catch-per-unit-effort (CPUE) and species encounter rates as functions of DO and regulatory bag limits. Of the 709 days analyzed, 36.8% were characterized as hypoxic (DO < 61 μmol/kg). Of the 4 years, 2021 had the most severe hypoxia and 2019 had the least. Across all trips, CPUE and average number of species encountered generally declined during hypoxic periods, indicating reduced fishing success. However, species-specific responses varied: some, such as blue/deacon and China rockfish (see Fig. 2), showed increased CPUE with higher DO levels, while others like cabezon and quillback rockfish were more frequently caught during hypoxic events. These patterns suggest that hypoxia alters species’ availability and/or catchability, possibly due to shifts in fish behavior, vertical distribution, or tolerance to low DO. Notably, species with increased CPUE under hypoxia are already considered vulnerable or limiting for the Oregon recreational fishery, raising concerns about increased pressure on sensitive stocks. As hypoxic events become more frequent with climate change, incorporating DO metrics into stock assessments and fisheries management would improve population models for exploited species. Their findings highlight the need for fine-scale, species-specific approaches to recreational fisheries management in the context of changing ocean conditions and suggest that recreational fishers may face constraints in adapting to deoxygenation, especially in strongly place-based or single-species fisheries.
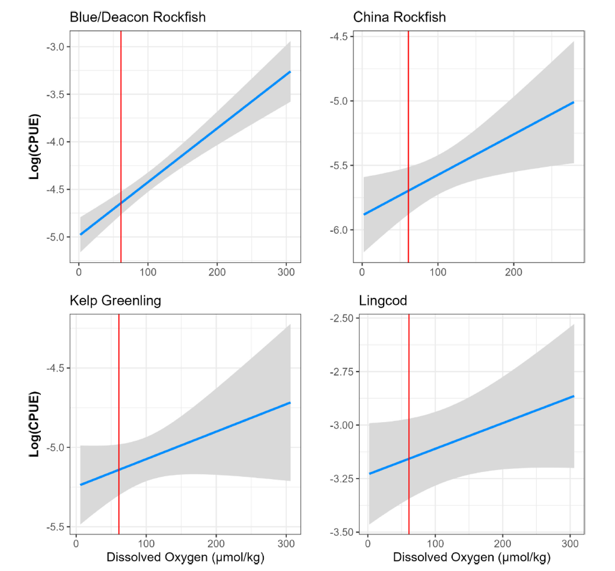
Figure (1) Log (CPUE) for four different species versus DO. Species depicted are those with best-fit Gaussian models that included DO. Gray areas are 95% confidence intervals. Data to the left of the red vertical bar indicate hypoxic conditions and to the right indicate normoxic conditions.
___________________
Reference:
Rasmuson, L. K., A. D. Whitman, B. T. Cervantes, and J. P. Fram. 2026. “ Effects of Dissolved Oxygen and Hypoxia on Catch Rates of Nearshore Groundfishes in a Recreational Hook and Line Fishery.” Fisheries Oceanography 1–13. https://doi.org/10.1111/fog.70046.