
OOI Plankton Imagery and Co-Located Environmental Data Now Ready for Analysis
Since April 2024, the OOI has collected plankton imagery with an Imaging Flow CytoBot (IFCB) on a mooring in the Pioneer Mid-Atlantic Bight (MAB) array. The IFCB is deployed at 7 m depth on the Central Surface Mooring (CNSM), which is located approximately 45 km east of Nags Head, NC in about 30 m of water. The CNSM measures a variety of meteorological and oceanographic variables. A companion mooring at the Central Site contains an ADCP and a wave-powered profiler operating from 2 to 22 m depth. Other moorings and gliders within the Pioneer MAB Array make multidisciplinary measurements from the air-sea interface to the sea floor.
Initially deployed in the spring of 2024, OOI now has 18 months of moored IFCB data, spanning April 2024-April 2025 and November 2025-April 2026. The data are freely available and can be accessed and visualized in several ways. For help choosing a data access point that best fits your data needs, please reference the Quick Access Links post in the IFCB Community forum on the OOI’s Discourse site.
The IFCB dashboard is the primary access point for exploring recovered data, allowing display of images from recovered moored and shipboard data. The dashboard also provides geographical coordinates and allows users to filter samples by relevant tags. The tag for the Central Surface Mooring (“site_cp10cnsm”) can be used to browse a combined shipboard and moored dataset with over 7 million images (Fig. 1).
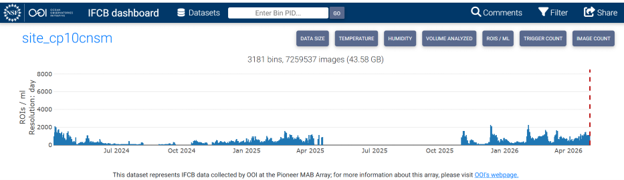
Figure 1: OOI IFCB Dashboard timeline tagged with “site_cp10cnsm” to show both shipboard and moored data from April 2024 to April 2026.
During deployment, the OOI Data Explorer shows selected parameters from the IFCB header file transmitted via satellite telemetry. The moored time series can be viewed individually to change the time period and data binning, see deployment dates, and read annotations. They can also be compared with time series data from other Pioneer MAB instruments.
Even after recovery, Data Explorer can be useful for exploring events of interest. For example, Winter Storm Gianna affected the Pioneer MAB around Feb 1, 2026. Gianna’s passage was associated with a rapid pressure drop and watermass changes, with a drop of about 1 PSU in salinity (Fig 2, upper). At the same time, there was an increase in IFCB images (more specifically, regions of interest, or ROIs) per ml of water. Evaluating imagery from the OOI IFCB Dashboard (Fig. 2, lower) shows a change in the assemblages of plankton and particles before and after the peak of storm activity.
Data Explorer views and IFCB Dashboard mosaics can help researchers identify which full resolution datasets they might want to access. The raw IFCB data files can be downloaded from the OOI’s Raw Data Archive or used directly within OOI’s JupyterHub from either the mooring or the cruise data. Resources for navigating and using the Raw Data Archive can be found on this page.
Researchers can join OOI’s IFCB community of practice and use the OOI Discourse forum, which serves as an entry point to both OOI data and the global IFCB community. After creating an account, users can post to the IFCB Community on Discourse to share methods and results, troubleshoot data issues, and connect with colleagues. Answers to common questions about working with IFCB data may be found in the McLane IFCB Users Google Group; information about accessing those resources is available in this post. As a complement to the OOI and McLane forums, the OOI Facilities Board (OOIFB) is sponsoring a four-part series of IFCB webinars in 2026. More information about the series can be found at https://ooifb.org/meetings/2026-ifcb-webinar-series/ including recordings of past webinars underneath the “Archived Webinars” heading.
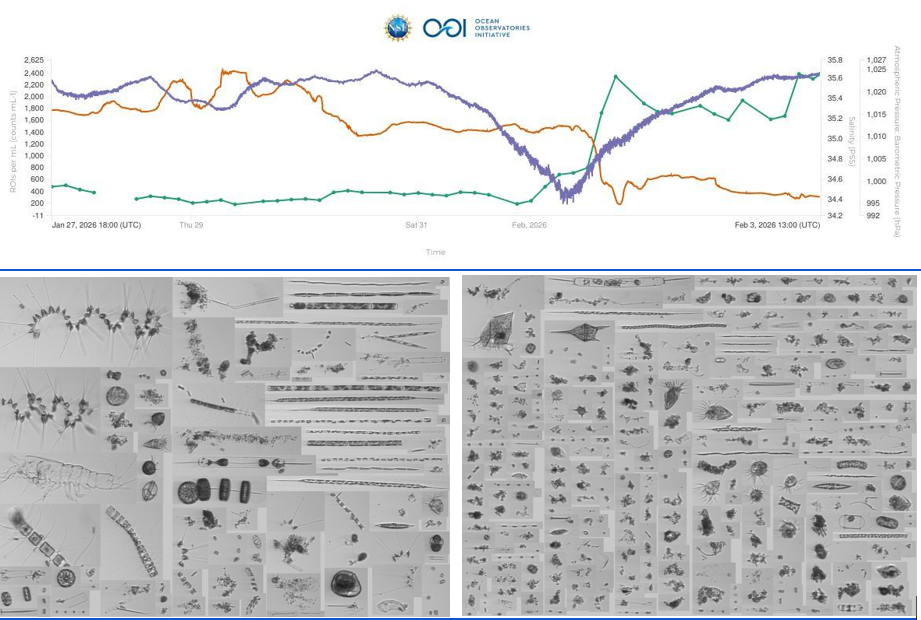
Figure 2: Upper panel: Data comparison chart from OOI Data Explorer showing ROIs per ml (green line with dots), practical salinity (orange line), and atmospheric pressure (purple line) before and after the eye of the nor’easter Winter Storm Gianna passed over CNSM on Feb. 1, 2026. Lower panels: Mosaics of images from the OOI IFCB Dashboard on Feb. 1, 2026 at 00:25 UTC (left) and 15:25 UTC (right).