
A Method for Quantifying Correlation in the Shape of Oceanographic Profile Data
Vertical profiles are widely used to identify physical and biogeochemical features of the water column. Recent studies have shown that oceanographic profiles can be represented as functional data objects, where each profile is treated as a single datum and expressed as a function of pressure. This study applies a recently developed technique, which defines a scalar correlation coefficient for functional data, to the analysis of oceanographic profiles. The method represents each profile using basis functions, whose associated weightings are termed basis coefficients, and quantifies dependence through the variability of these coefficients. An important advantage of this method is that the resulting correlation coefficient reflects similarities in overall profile shape, not just correlations between values at specific depths. Two applications of this method are explored: calculating the correlation coefficient between two different oceanographic variables, and estimating the temporal autocorrelation function of a single variable. Each application is demonstrated using two case study datasets: (1) the Coastal Endurance Washington Offshore Profiler Mooring and (2) biogeochemical-Argo floats. The case study using the Washington Offshore Profiler Mooring demonstrates how the method can be used to identify physical drivers of variability in biogeochemical profile structure. For example, Figure 17 shows temporal autocorrelation functions computed from the full profiles of different variables measured by the Washington Offshore profiler mooring. By computing correlation coefficients and autocorrelation functions directly from full profiles, the authors’ approach complements existing methods and naturally incorporates profile shape.
The method has broad potential applications across oceanographic research. It can be applied to the expanding global collection of profiling observations, as well as to ocean model output, to quantify spatio-temporal variability and coupled physical–biogeochemical dynamics. Potential uses include observing system design, evaluation of sampling strategies, assessment of advective versus local variability, validation of machine learning products, and investigation of ecosystem scale decorrelation timescales. A variety of methodological approaches could be integrated with this technique, such as functional regression, clustering, spatial modelling or time series analyses. Together, these extensions would further enhance the ability to quantify and interpret variability in the rapidly growing volume of oceanographic profiling data.
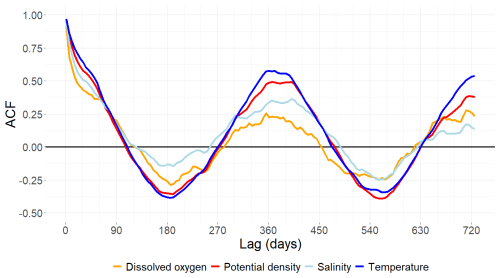
Temporal auto correlation functions for four oceanographic variables measured as profiles at the Coastal Endurance Washington Offshore Profiler Mooring (CE09OSPM).
___________________
Reference:
Taylor, M. and S. Henson, 2026. “A method for quantifying correlation in the shape of oceanographic profile data.” Ocean Sci. 22(2). https://doi.org/10.5194/os-22-1377-2026.