
Cabled Array Preliminary Data
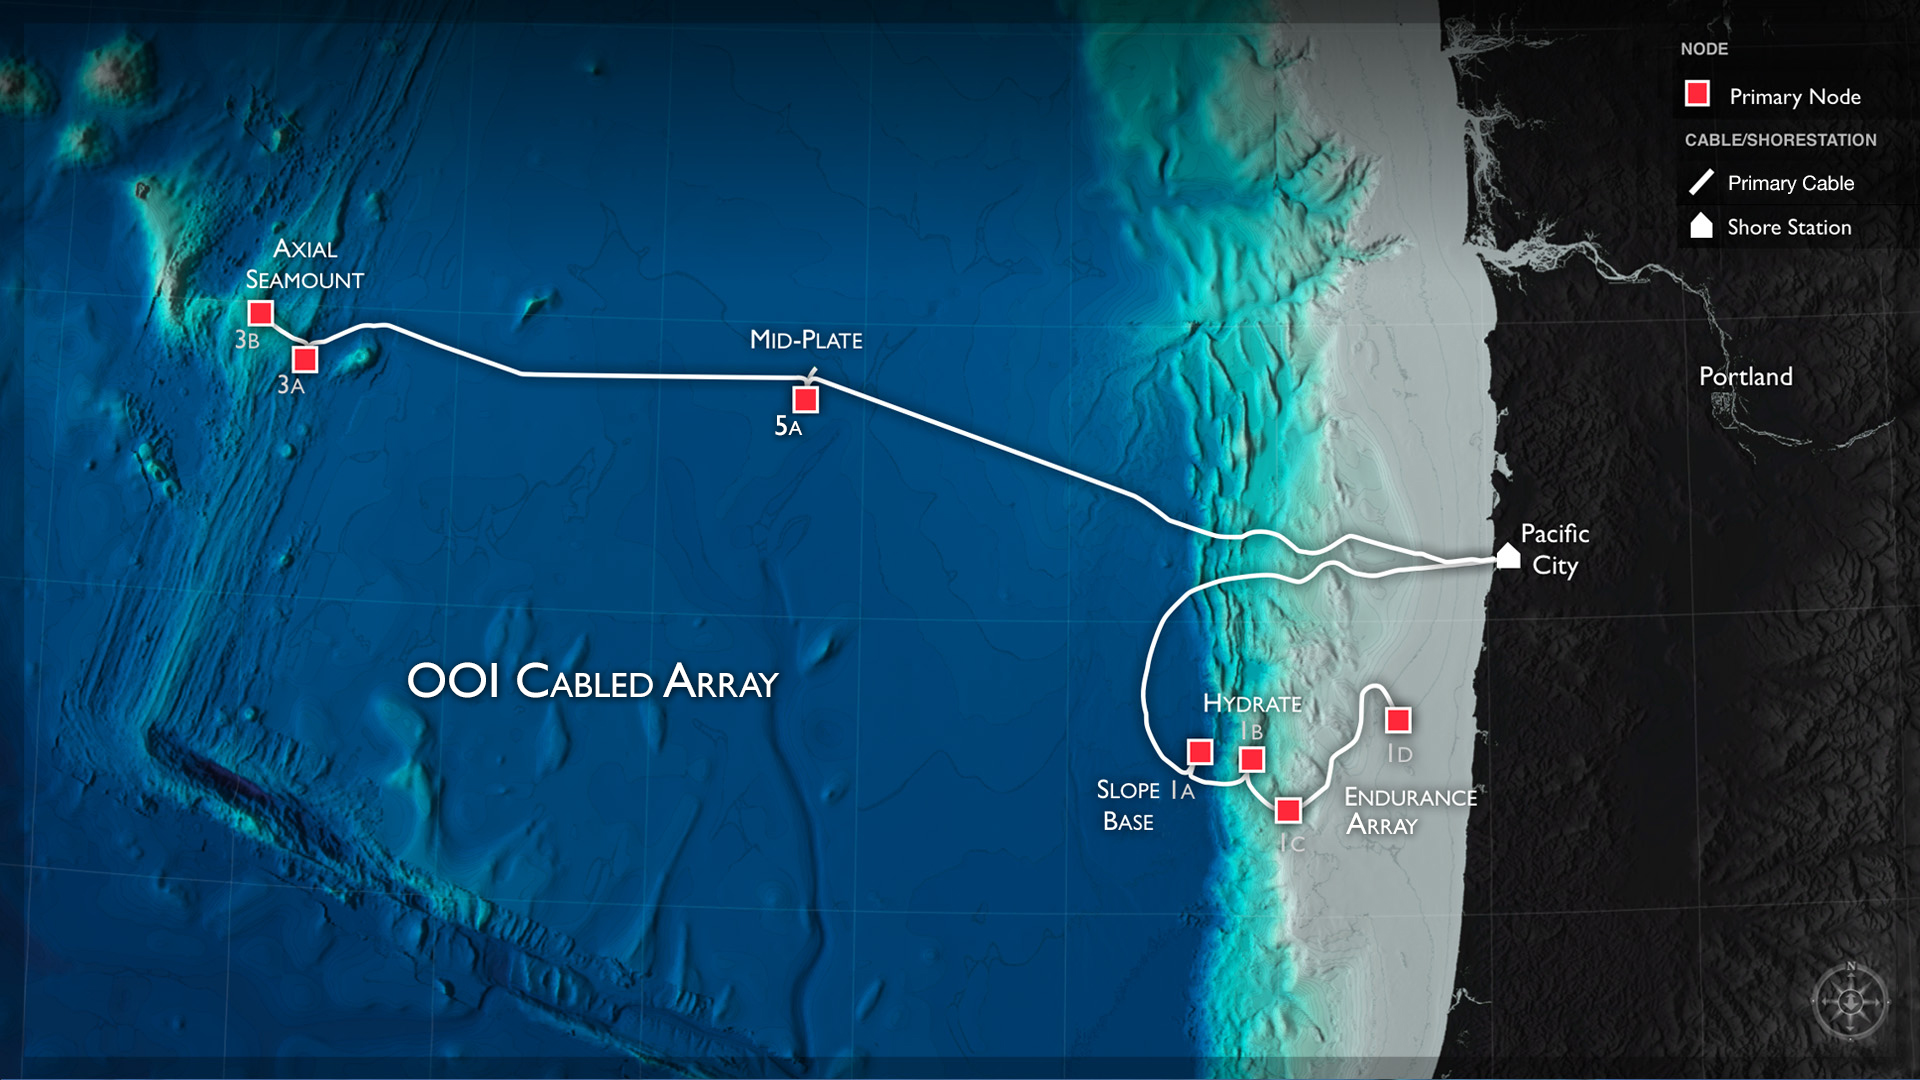
(Click to enlarge) Credit: OOI Cabled Array program and the Center for Environmental Visualization, University of Washington (Disclaimer: Graphics are conceptual designs and are not yet finalized. All data are subject to revision without notice.)
Preliminary Seismometer and Hydrophone Data on IRIS
Data from the OOI broadband and short-period seismometers and low frequency hydrophones at Axial Seamount, Slope Base, and Southern Hydrate Ridge and bottom pressure sensors in Axial caldera installed between July-October 2014 are now available through the Incorporated Research Institutions for Seismology (IRIS). Data may be pulled hourly and are available in a variety of formats. We are extremely grateful to Tim Ahern, Director of Data Services at the IRIS Data Management Center (DMC) in Seattle, and his team, for their time and considerable efforts in facilitating this release of OOI data through the IRIS data system. In particular, we acknowledge the assistance provided by DMC staff Rick Benson, Mary Templeton, and Chad Trabant. Thanks also to John Delaney, Deb Kelley, Brian Ittig, Orest Kawka, Dana Manalang, and Chuck McGuire at the University of Washington for their efforts on the OOI side of the collaboration!
How to Access the Data
The following URLs provide start place to access data within the IRIS system:
- The home page for IRIS is:http://www.iris.edu
- The general link to the IRIS Web Service for timeseries data is: http://service.iris.edu/irisws/timeseries/1/
- The link to the Data Services Directorate is: http://ds.iris.edu
While searching within IRIS for OOI data, use the two-letter IRIS network designator “OO.”
A Google™ map of the OOI seismometer/hydrophone and bottom pressure sensor locations can be found at: http://ds.iris.edu/gmap/OO. This map also provides easy access to the channel descriptions and the metadata associated with the sensors at each of the Stations listed below.
OOI Data are available on the IRIS site under the following IRIS Stations:
- RSN Axial Ashes 1 – Station AXAS1
- Seismometer data
- RSN Axial Ashes 2 – Station AXAS2
- Seismometer data
- RSN Axial Base 1 – Station AXBA1
- Seismometer data
- Hydrophone data
- RSN Axial Central Caldera 1 – Station AXCC1
- Seismometer data
- Hydrophone data
- Pressure Sensor – Location 11
- Channel BDO – Ambient Bottom Pressure in Pa
- Channel BK1 – Sensor Internal Temperature in C
- RSN Axial East Caldera 1 – Station AXEC1
- Seismometer data
- RSN Axial East Caldera 2 – Station AXEC2
- Seismometer data
- Hydrophone data
- Pressure Sensor – Location 11
- Channel BDO – Ambient Bottom Pressure in Pa
- Channel BK1 – Sensor Internal Temperature in C
- RSN Axial East Caldera 3 – Station AXEC3
- Seismometer data
- RSN Axial International – Station AXID1
- Seismometer data
- Pressure Sensor – Location 11
- Channel BDO – Ambient Bottom Pressure in Pa
- Channel BK1 – Sensor Internal Temperature in C
- RSN Hydrate Summit 1-1 – Station HYS11
- Seismometer data
- RSN Hydrate Summit 1-2 – Station HYS12
- Seismometer data
- RSN Hydrate Summit 1-3 – Station HYS13
- Seismometer data
- RSN Hydrate Summit 1-4 – Station HYS14
- Seismometer data
- Hydrophone data
- RSN Hydrate Slope Base – Station HYSB1
- Seismometer data
- Hydrophone data
Users interested in archived data can access data through the IRIS web services at http://service.iris.edu where the documentation for the services can be found.
Additionally, IRIS provides a metadata aggregator that allows users to see details about the data, types of seismometers, locations, etc: http://ds.iris.edu/mda/OO
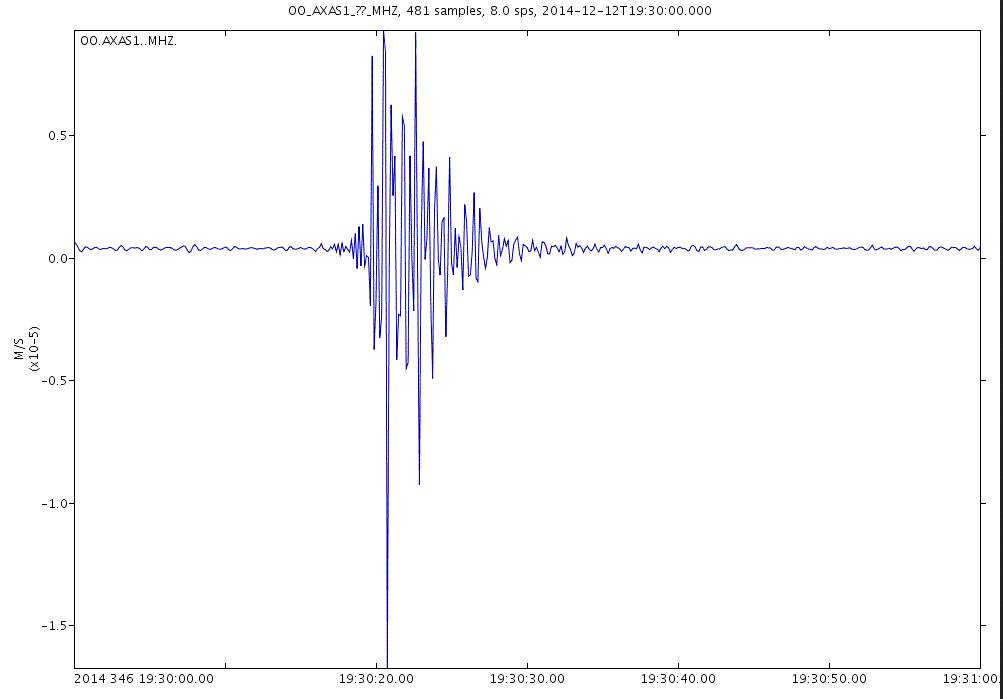
The time series tool at the web services URL allows users to select specific instruments/channels and parameter ranges and generate either plots or downloadable datasets. For example, a plot of a seismic event recorded by one of the OOI seismometers on Axial Seamount during a 1 minute interval on December 12, 2014, from the mid-period channel, high pass filtered at 10 Hz, and converted to units of ground motion (meters per second).
The resulting plot looks like this
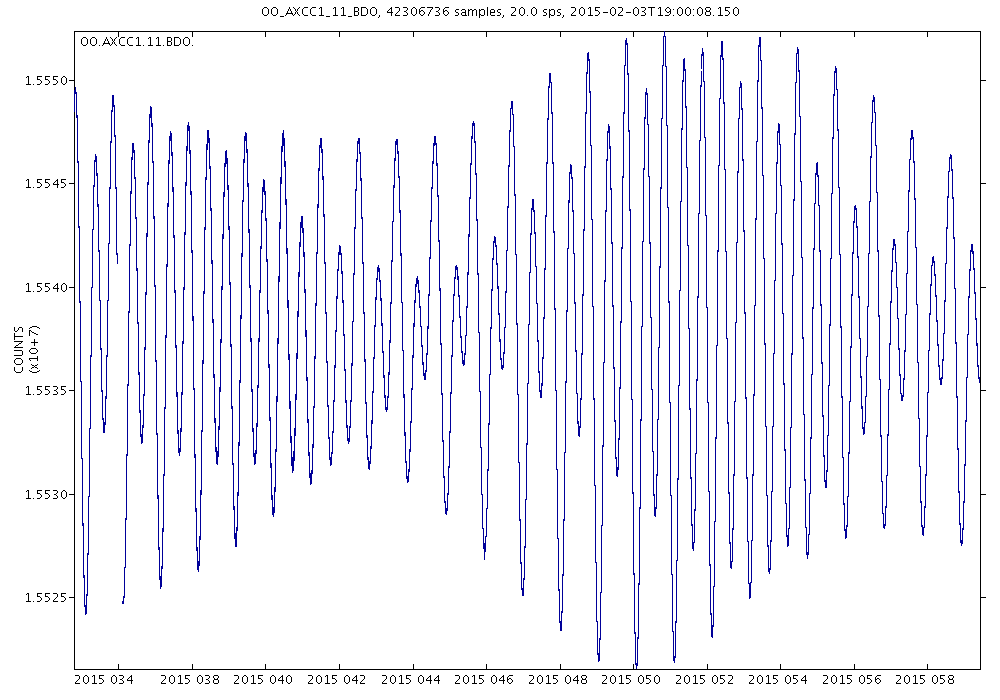
Similarly time series plots can made for longer scale time periods, such as the below plot (also seen here) reflecting pressure data for the Axial Central Caldera for the month of February 2015.
NOTE: These preliminary data were collected by the Ocean Observatory Initiative (OOI) project purely for internal system development purposes during the construction phase of the project and are offered for release to the public with no assurance of data quality, consistency, or additional support. The OOI Program assumes no liability resulting from the use of these data for other than the intended purpose. No data quality assurance steps have been implemented on these data to date.