
Community Data Tools
Here, we have compiled tools that community members have built to access, analyze, and visualize datasets. We hope you find them helpful in advancing your efforts to use OOI data in your work.
These data analysis and visualization tools have been compiled and are maintained by community members. Should you have a question about a specific tool, please reach out to the tool creator directly. If you need further help or a have a tool you’d like to share, please reach out to the HelpDesk.
Getting started
Four-Part Series on How to Use Data Explorer
In eight minutes or less per session, you can learn how to find and visualize time-series, glider, or profiler data and compare time-series data.
Additional Helpful Links
You may also find the following lists on this site helpful in translating OOI instrument and platform codes.
Computational toolboxes
OOIPY: A Python Toolbox
OOI community members Felix Schwock, John Ragland, Matthew Munson, and Shima Abadi created OOIPY, a Python toolbox design to aid in the scientific analysis of OOI data. It allows users to access OOI broadband and low frequency hydrophone data, compute spectograms and power spectral density (PSD) estimates using the Bartlett/Welch method, and visualize spectrograms and PSD estimates.
OOI Data Team Coastal and Global Array MATLAB Toolbox
This MATLAB toolbox is useful for downloading data via the Machine-to-Machine interface.
OOI Data Team R M2M Toolbox
The R M2M Toolbox is helpful for using R for data explorations.
OOI Data Team Python Toolbox
The Python Toolbox is a helpful tool for using python for data explorations.
Rutgers Data Team GitHub Repository
Python scripts made for QA/QC of OOI data that may also be useful to external users for downloading, organizing, and plotting data.
Cabled Array Tilt Meter, Co-located Temperature Plots, and Inflation Forecast
This forecast site, courtesy of Bill Chadwick (Oregon State University/CIMRS), has been updated to add an inflation forecast created by Dr. Chadwick and Andy Lau (Oregon State University/CIMRS). These plots use OOI pressure data to extrapolate the average rate of inflation over the last 12 weeks and calculate the date when level of inflation at Axial Seamount will reach or exceed the pre-2015-eruption level. Note that the average rate of inflation changes with time, and reaching the threshold does not guarantee an eruption, but the volcano is likely to erupt within a year after reaching that threshold. The plots are automatically updated once a day using the latest inflation rate. (edited 05/16/18)
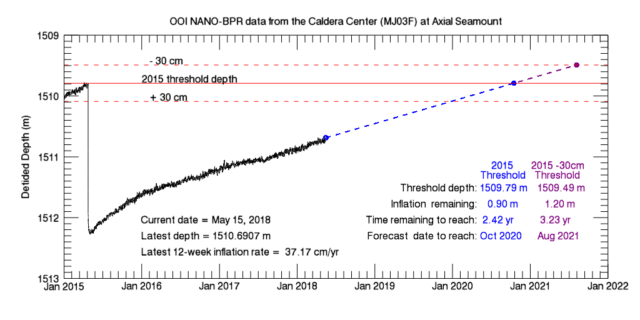
Plot of OOI BPR data from the Caldera Center (BOTPT-A301-MJ03F; black curve) showing deflation during the 2015 eruption (left) followed by re-inflation. Blue dashed line extrapolates into the future using the average rate of inflation from the last 12 weeks; middle blue dot is date when 2015 inflation threshold is reached, right blue dot is when a threshold 30 cm higher will be reached. Plot courtesy Bill Chadwick (OSU/PMEL)
Broadband Hydrophone (HYDBB) Python Module
Use the HYDBB Python module to convert audio MSEED files from the OOI hydrophones into FLAC or WAV format, filters the data, and creates spectrograms. The module is courtesy of Pete Cable (Raytheon).
Media and media tools
Axial Seamount Hydrothermal Vent Time-Lapse Videos
A new computer vision routine, developed by Aaron Marburg (University of Washington, Applied Physics Lab), aided by Timothy Crone (Lamont Doherty Earth Observatory), and Friedrich Knuth (Rutgers University), is able to correctly identify and tag scenes of scientific interest in the CAMHD video stream. These scenes were previously being manually identified by students at Rutgers University. A new set of time-lapse videos has been created with this enhanced metadata record, displaying one frame captured every three hours from November 2015 to July 2016. (edited 09/07/17)
Axial Seamount and Coastal/Slope Biology Catalogs
Here you can view images and video of the many different organisms observed over the years of Regional Cabled Array expedition cruises. The first catalog relates to Axial Seamount, a deep-sea volcano on the Juan de Fuca spreading ridge, and the Coastal catalog contains animals seen at Hydrate Ridge, Slope Base, and Coastal Endurance cabled sites. These archives, compiled by students at the University of Washington under the guidance of Deborah Kelley (University of Washington) and Leslie Sautter, College of Charleston, are designed to be living documents, and will be continually updated to include information from future cruises and additional details provided by experts. (edited 08/29/18)
Calibrations and Corrections
OOI Biogeochemical Sensor Data: Best Practices & User Guide
The OOI Biogeochemical Sensor Data Best Practices and User Guide is intended to provide current and prospective users of data generated by biogeochemical (BGC) sensors deployed on the Ocean Observatories Initiative (OOI) arrays with the information and guidance needed for them to ensure that the data are science-ready. This guide is aimed at researchers with an interest or some experience in ocean biogeochemical processes.
Split-beam calibration of the OOI echosounder
The calibration review compares default vs recommended parameters for the data analysis of EK60 using Echoview