Community Tools available on the OOI website to examine the Axial Volcano
The Axial Volcano eruption in 2015 was captured using strategically placed instrumentation of the Ocean Observatories Initiative Cabled Array. These data were then transmitted from the instruments through a fiber-optic cable to shore in near-real time allowing scientists and the public to view the event live. Seismic activity was recorded by eight seismometers around the caldera and at the base of the seamount. Shifting in the height of the caldera was tracked by bottom pressure tilt instruments (BOTPT).
Since that time, the Cabled Array has continued to collect data surrounding the Axial Seamount and scientists have written numerous articles surrounding the eruption – a few examples include, Chadwick, et al. 2016, Nooner & Chadwick 2016, Wilcock, et al. 2016, Spietz, et al. 2018, Tolstoy et al. 2018, and Wilcock, et al. 2018.
Work continues to explore the dynamics of the Axial Seamount through the intensive OOI infrastructure and other NSF-funded expeditionary research, making it the most advanced underwater volcanic observatory in the world ocean.
In addition to their own work, members of the OOI science community have created tools for anyone to use to visualize OOI data.
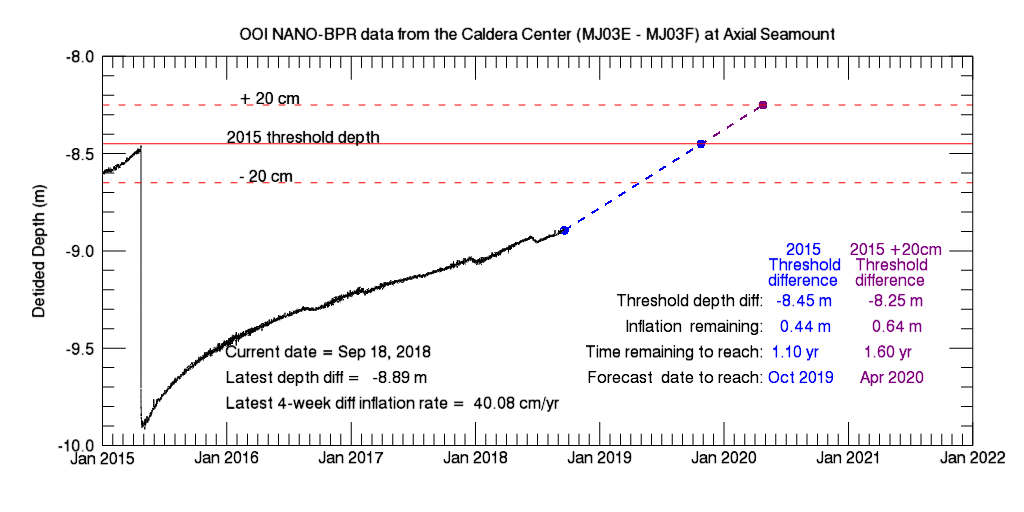
Plots of the data from the OOI BOTPT instruments at Axial Seamount are updated every 15 minutes and are available online courtesy of Dr. Bill Chadwick (Oregon State University and NOAA/PMEL). The plots show the volcano inflation between eruptions and deflation during eruptions.
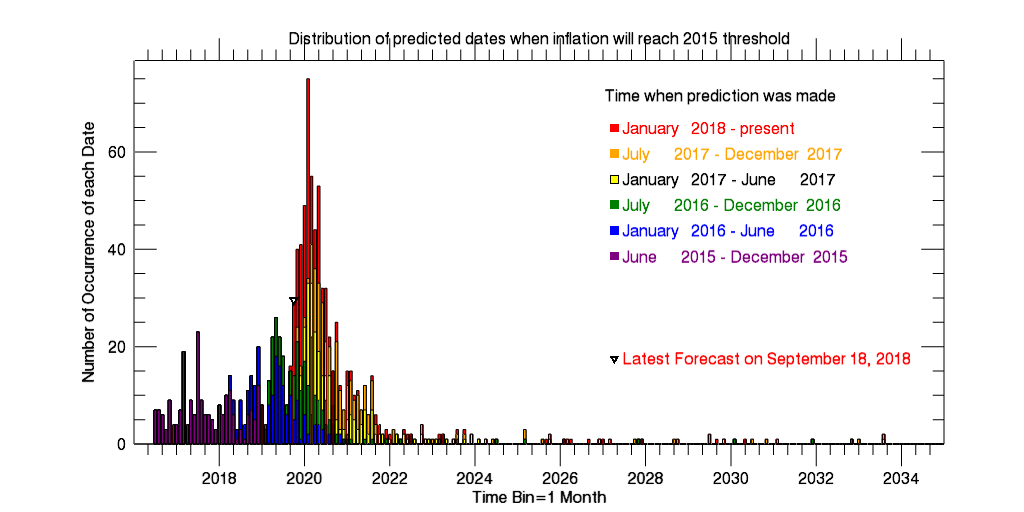
A new Inflation Threshold Forecast web page has also been created by Dr. Chadwick and Andy Lau (Oregon State University/CIMRS). The page uses OOI data to help forecast when the level of inflation at Axial Seamount will reach the pre-2015-eruption level. It uses OOI bottom pressure data from the BOTPT instrument at the center of the caldera and extrapolates the average rate of inflation over the last 4 weeks to calculate the date when the 2015 inflation threshold will be reached (and also a level 20 cm higher, since the inflation threshold before the 2015 eruption was higher than before the 2011 eruption).
Of course, we do not know that the volcano will erupt when the 2015 inflation threshold is reached, but based on its previous behavior it is likely to erupt within a year after reaching that threshold. Also, the average rate of inflation changes with time, so the “predicted dates” will vary with time. There is a histogram on the web page showing that variability, to give an idea of the uncertainty and how the predicted dates have changed with time since the last eruption. These plots will be automatically updated once a day using the latest inflation rate.
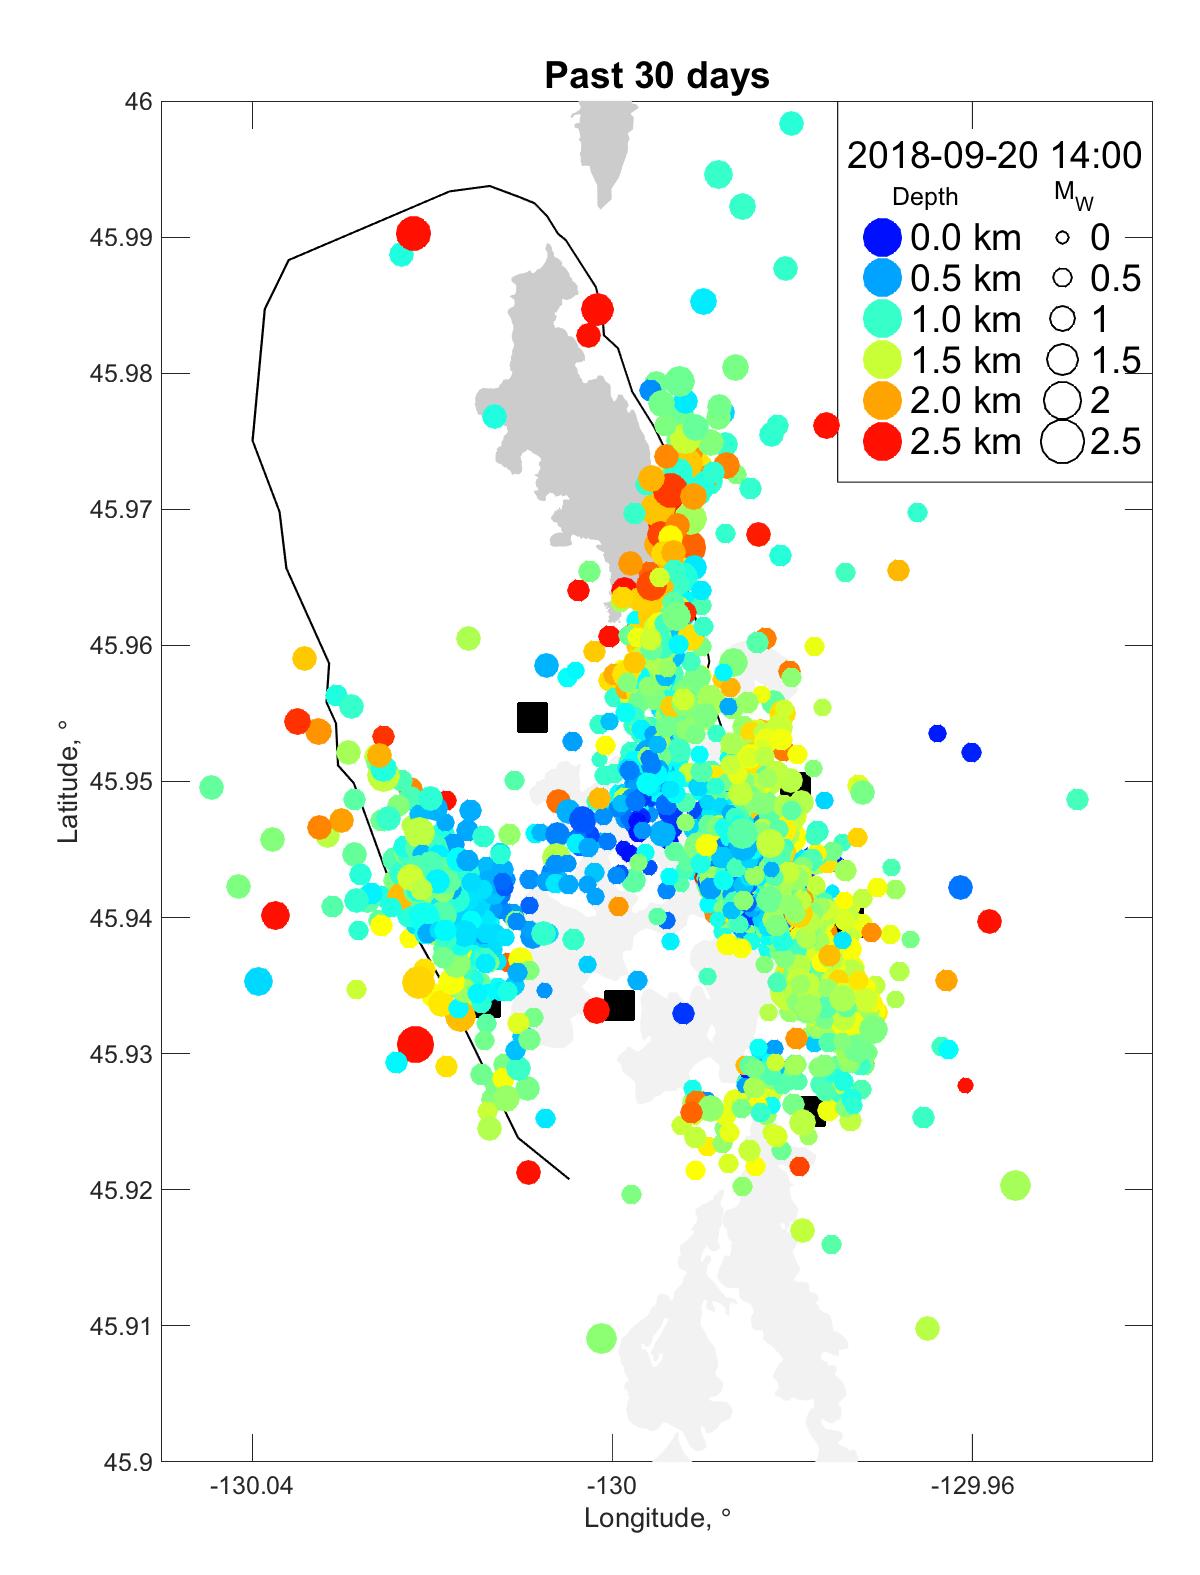
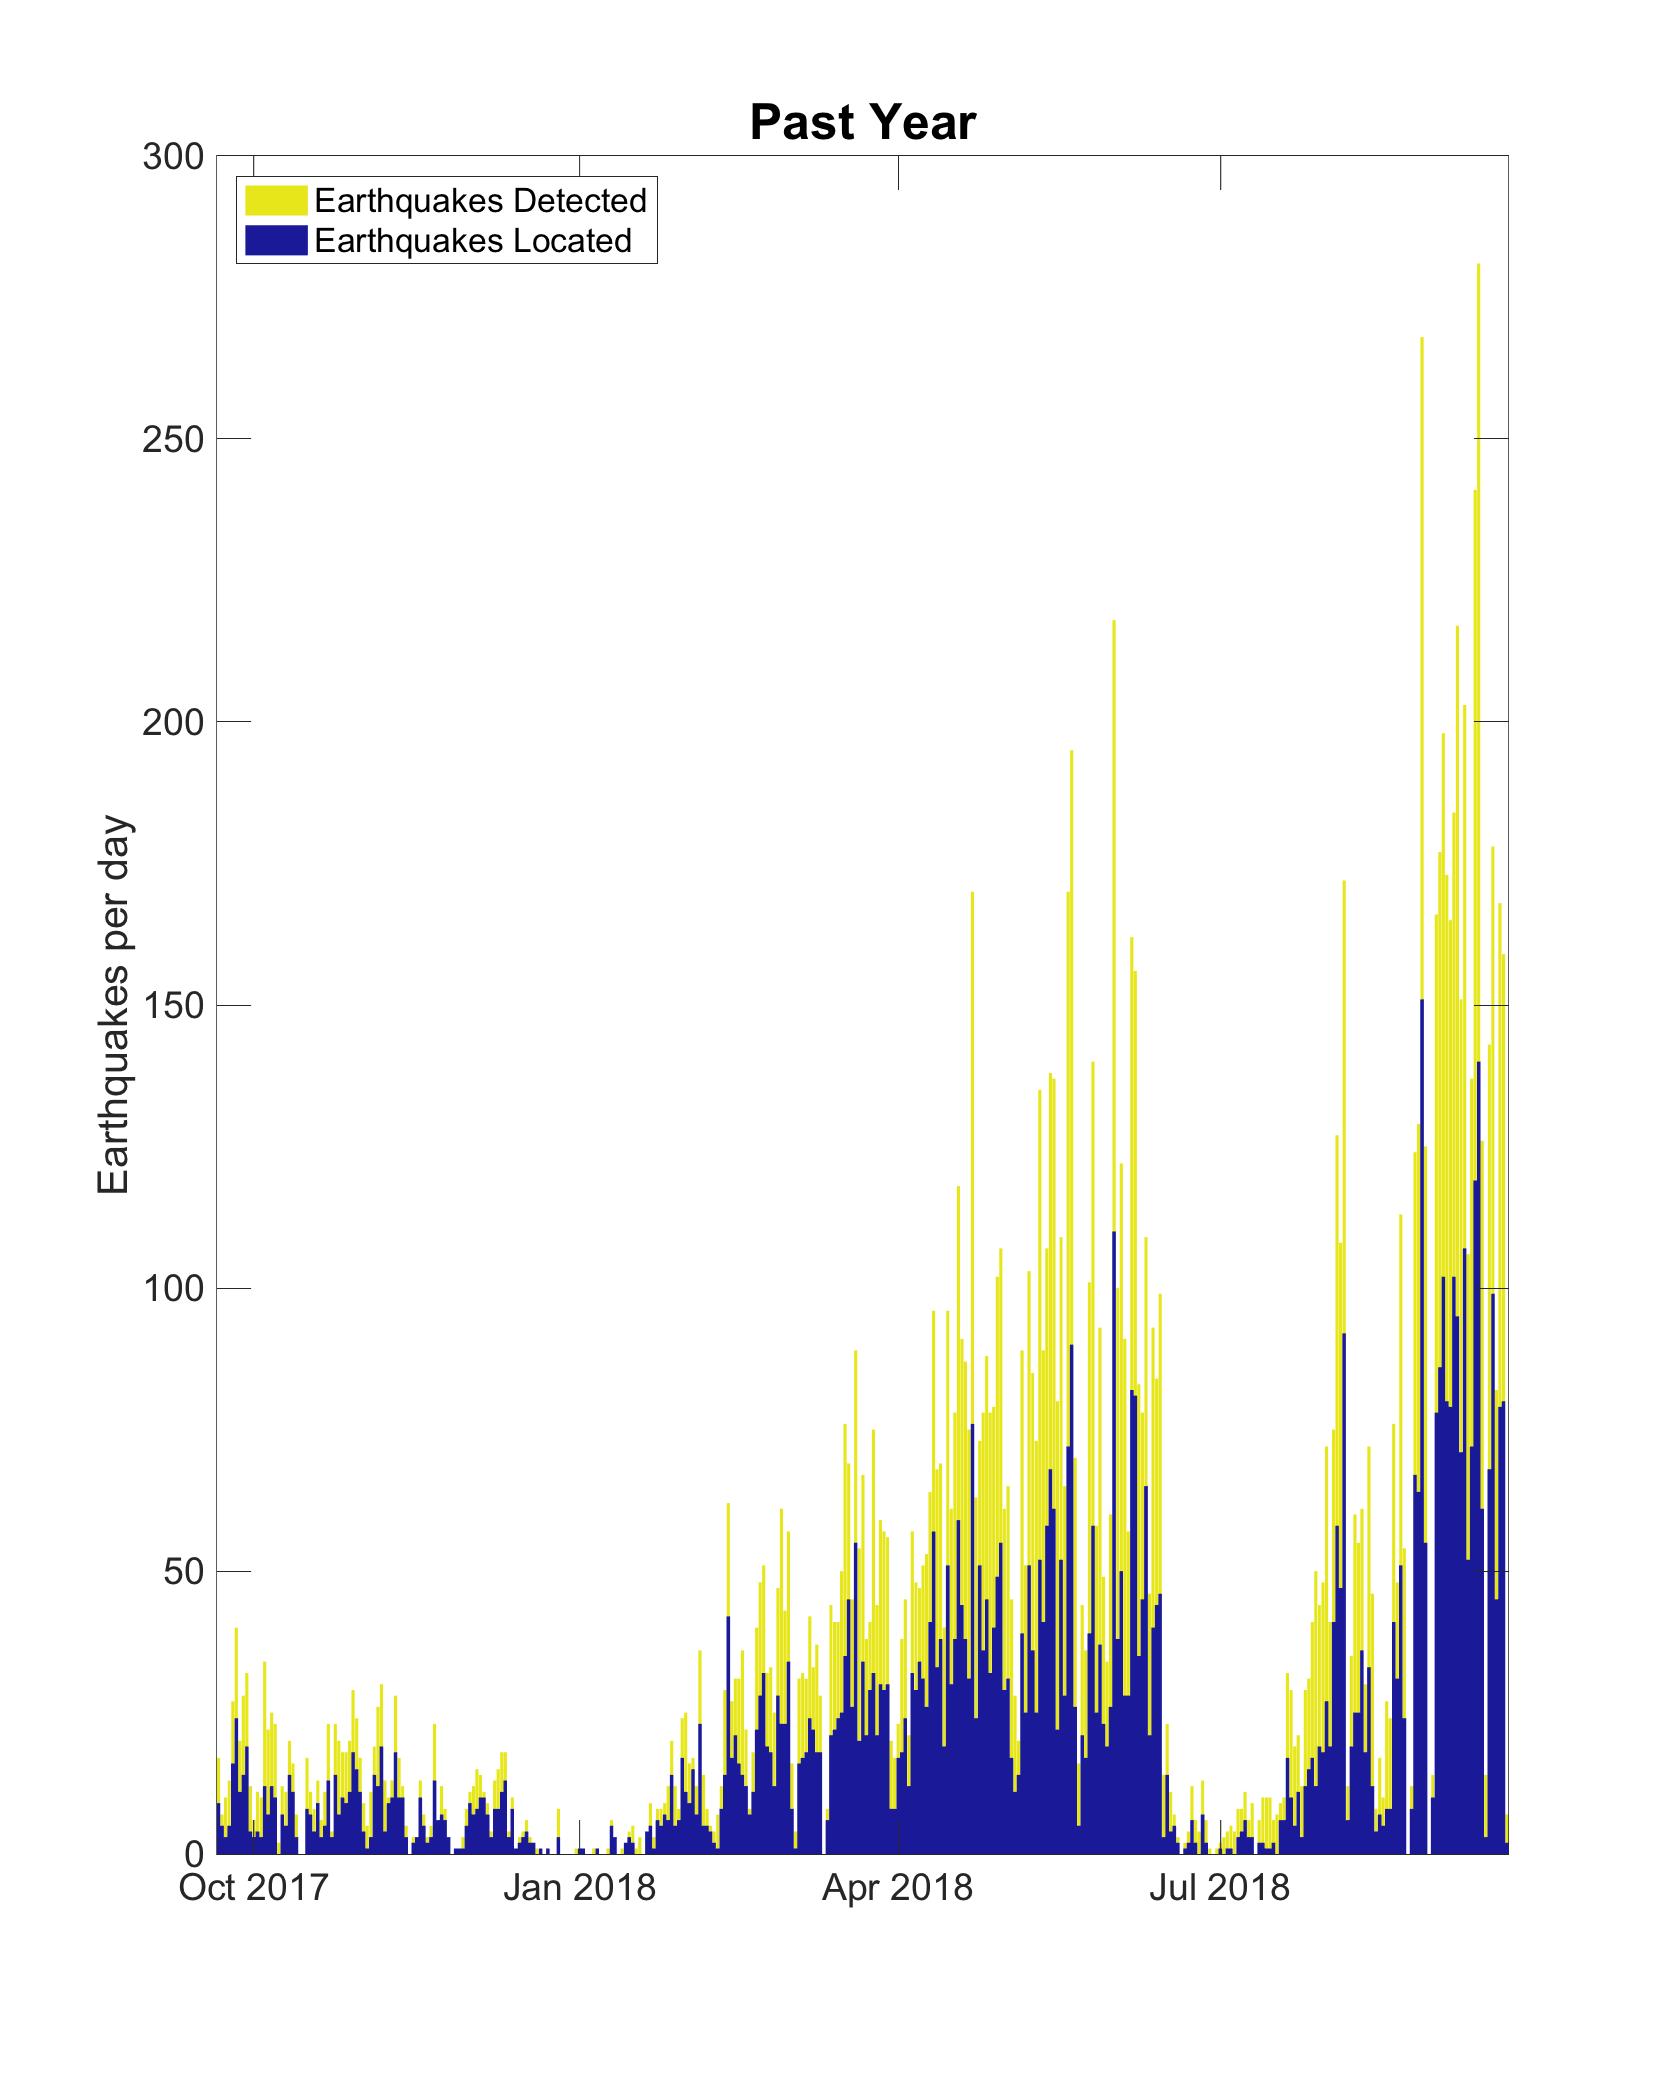
The Axial Seamount earthquake catalog updates each hour and is available on a web site courtesy of Dr. William Wilcock at the University of Washington. The page shows updating histogram plots of earthquake counts and maps with earthquake epicenters and depth. Following the 2015 eruption the earthquake counts were quite low but starting in early 2018 there was a steady and quite noticeable increase in earthquake rates until mid-June when they suddenly decreased in response to an apparent pause in volcano inflation. In the longer term, we expect that the peak rates of seismicity will continue to increase as the volcano becomes critically stressed as it approaches the next eruption.
The Community Tools and Datasets page compiles tools that community members have built to access, analyze, and visualize datasets. If you have a resource you’d like to share, please send a note to the HelpDesk. Please note that these sites are not maintained by the OOI program, as they are supported by outside resources.