Posts by Amber Stronk
Connecting Science and Community: Key Insights from the OOIFB Pioneer MAB Workshop
The Coastal Pioneer Southern Mid-Atlantic Bight (MAB) Array Community Workshop, held from September 10-12, 2024, at Old Dominion University, brought together a diverse group of scientists, educators, and stakeholders to explore the potential of the Pioneer MAB Array in advancing oceanographic research in the region. Funded by the U.S. National Science Foundation (NSF) and dedicated to the memory of Dr. Larry Atkinson, the event organized by the Ocean Observatories Initiative Facilities Board (OOIFB), aimed to highlight the array’s capabilities, evaluate regional research progress, and promote collaboration within the ocean research community.
Workshop Focus and Objectives
The workshop offered an in-depth exploration of the Pioneer MAB Array, showcasing its measurement capabilities and ability to improve our understanding of the Southern Mid-Atlantic Bight’s complex oceanographic processes. Participants reviewed past research, discussed data access, and assessed current knowledge and gaps in the region, guided by insights from local stakeholders to align research priorities with community needs.
Day 1: Setting the Stage for Collaborative Research
The first day began with a dedication to Dr. Larry Atkinson, whose career laid the groundwork for many oceanographic initiatives in the region. The morning sessions featured an overview of NSF funding opportunities, encouraging participants to propose innovative research projects using OOI data.
The OOI presentations showcased the successes of past research and outlined the proposal process for adding instruments to the array. These discussions set the stage for deeper dives into key science themes, such as the dynamics of shelf-slope exchange, biogeochemical cycling, and the impact of extreme events like hurricanes, winter storms and freshwater outflows.
The afternoon was dedicated to breakout sessions, where participants engaged in discussions on specific science themes. These sessions allowed for the exploration of collaborative research ideas and the identification of potential projects that could leverage the capabilities of the Pioneer MAB Array.
Day 2: Harnessing Data for Research and Innovation
The second day focused on data access and utilization, with hands-on demonstrations of the latest OOI data tools. Participants were introduced to the OOI Data Explorer and other data access methods that facilitate the retrieval and analysis of complex oceanographic data. These sessions also highlighted the program’s approach to data quality assurance and control, ensuring that researchers have access to reliable and accurate information.
Breakout sessions offered practical experience with data access through various platforms including Jupyter notebooks. These tools enable researchers to leverage the rich datasets provided by the Pioneer MAB Array for a wide range of projects, from studying physical oceanography and biogeochemistry to investigating ecosystem dynamics and the effects of extreme weather events.
The day concluded with a panel discussion on the use of modeling in interdisciplinary projects, providing insights into how data can be integrated into complex models to better understand ocean processes.
Day 3: Expanding Broader Impacts and Future Directions
The final day of the workshop shifted focus to the broader impacts of using OOI data in educational and community contexts. Panel discussions explored innovative ways to integrate OOI data into K-12 and higher education curriculums, as well as engaging citizen scientists and the fishing community in data collection and its many uses. These sessions highlighted the potential for data-driven outreach and education programs to inspire the next generation of oceanographers and to raise public awareness of ocean science.
Key Takeaways
The workshop highlighted the Pioneer MAB Array’s potential to advance our understanding of the Southern Mid-Atlantic Bight and emphasized the importance of accessible data for researchers, educators, and citizen scientists. It effectively fostered collaboration within the scientific community, paving the way for new research initiatives that will propel scientific progress in the region for years to come.
[caption id="attachment_34869" align="alignnone" width="640"]
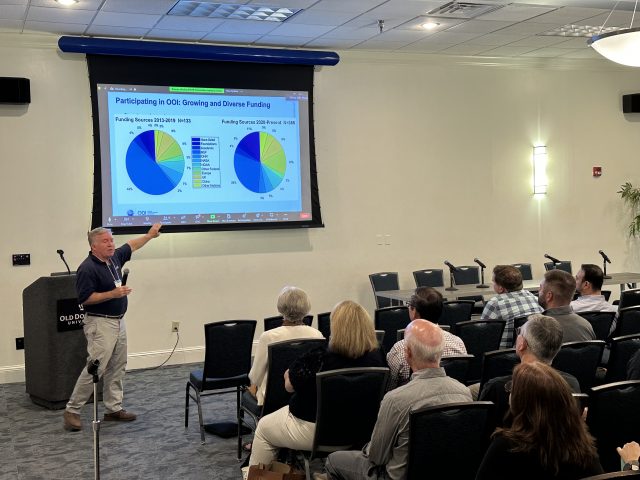 OOI Principal Investigator, James Edson[/caption]
[caption id="attachment_34866" align="alignnone" width="640"]
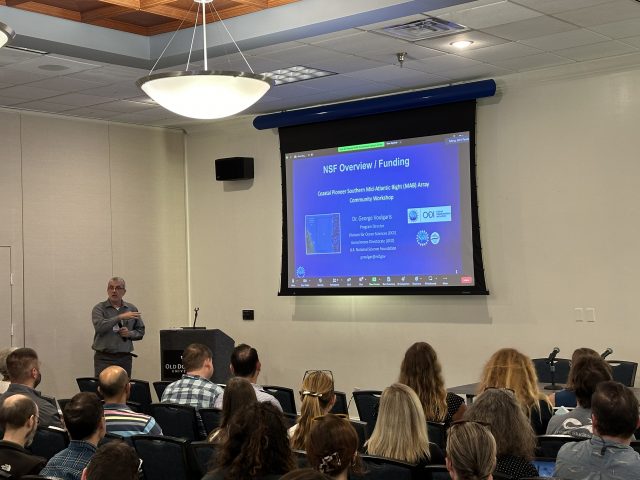 George Voulgaris, NSF OOI Program Director[/caption]
Read More
 URI Receives $3.2 Million NSF Award to Support OOI
University of Rhode Island Receives $3.2 Million NSF Award to Support Ocean Observatories Initiative.
Read MoreDeep-Sea Biodiversity: VIAME and OOI JupyterHub Accelerate Research
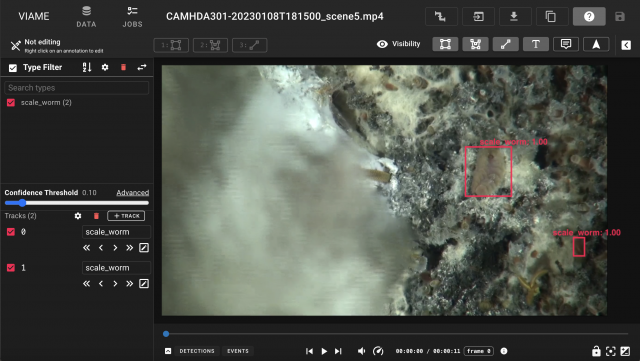
Off the coast of Oregon, the Axial Seamount on the Juan de Fuca Ridge hosts the ASHES vent field, a site rich in hydrothermal activity and diverse marine life. Principal Investigators, Dax Soule and Karen Bemis, and their teams are leveraging footage from past expeditions, captured by the OOI CamHD video archive, to study species diversity and abundance in this extreme environment.
With hundreds of terabytes of video data available, manual analysis is impractical. To address this, master’s student Julia Sandke and a team of undergraduate researchers are utilizing VIAME (Video and Image Analytics for a Marine Environment), a tool that helps build machine learning datasets by automating the annotation and classification of vent organisms. The goal is to use these datasets to train models that can autonomously analyze species diversity and abundance.
The integration of VIAME’s directories into the OOI JupyterHub environment, along with the addition of Nvidia L40S GPUs, has been a pivotal advancement. Previously, the team faced long delays using the shared VIAME web interface. Now, with dedicated resources in JupyterHub and the enhanced power of GPUs, they can significantly speed up machine learning processes, such as video training and data analysis, which once took days to complete.
This new computational power allows the team to begin unlocking the wealth of data in the CamHD archive, delving deeper into the species diversity around these vents. The long-term goal of the project is to use computer vision and machine learning to develop models that can track species abundance and predict key changes in the ecosystem. For example, these models could forecast where target species may appear after volcanic eruptions at Axial Seamount, providing researchers crucial insights into the shifting biological landscape of hydrothermal vent environments.
[caption id="attachment_34847" align="alignnone" width="640"]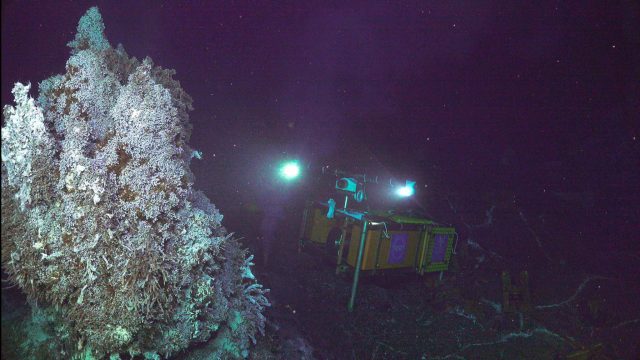 Credit: UW/NSF-OOI/WHOI; J2-1613. V24[/caption]
Read More
 Data Systems Committee – Call for Applications
The Data Systems Committee (DSC) of the Ocean Observatories Initiative Facility Board (OOIFB) was established to help ensure timely and reliable access to high-quality U.S. National Science Foundation (NSF) Ocean Observatories Initiative (OOI) data. The Committee evaluates and recommends improvements to the data services policies and practices of the NSF OOI Facility that will lead to more efficient and effective scientific use of NSF OOI data. The DSC is now soliciting applications to fill one open position. This 3-year appointment will begin October 2024. The selected individual will be eligible to serve a second 3-year term, if fitting.
The DSC holds at least one in-person meeting per year and one web conference each month. Some objectives of the DSC include:
- Keeping abreast of the current state of the NSF OOI cyberinfrastructure and data services with the goal of helping to promote maximum scientific use of NSF OOI data. These efforts will be informed by the FAIR Guiding Principles for scientific data management and stewardship, such that data are: a) Findable, b) Accessible, c) Interoperable, and d) Reusable.
- Encouraging the use of best practices, standards, and naming conventions established by the oceanographic community.
- Engaging with the user community to gauge user needs in regard to NSF OOI data systems, and to facilitate the promotion of a positive user experience.
- Staying current on potential new modes of data service and access, data analysis methodologies, and related technologies that facilitate the use of NSF OOI data.
- Engaging with the NSF OOI Program team regarding the priorities and plans of the NSF OOI cyberinfrastructure groups.
- Making recommendations for data products, usage metrics, and improving the user experience on the OOI Data Explorer, as well as other data service systems employed by the NSF OOI.
Scientists with interests and/or experience using scientific observing systems such as the NSF OOI, as well as those with experience in successfully delivering data from large-scale multi-sensor observing systems to scientific users are encouraged to apply. Interested applicants should submit a letter of interest and accompanying CV to Holly Morin, at the OOIFB Administrative Support Office (holly@ooifb.org), no later than September 17, 2024. The statement of interest should highlight the applicant’s experience with OOI data services and/or with other similar data services. Applicants might also include their experiences with OOI data services and/or a vision for how these might evolve in the future. All applications will be considered. Applications will be reviewed by the DSC members who will give due consideration to the qualifications of applicants, as well as to maintenance of gender, career level, disciplinary, and regional balance on the Committee. For more information about the DSC and its activities, please visit the OOIFB website: http://ooifb.org or contact Jim Potemra, DSC Chair (jimp@hawaii.edu).
Read MoreSummer Science Tours: CGSN Engages Young Environmentalists
The U.S National Science Foundation (NSF) OOI Coastal and Global Scale Nodes (CGSN) Team at WHOI has had a busy summer of talks and tours. With the help of Mashpee Wampanoag WHOI Tribal Liaison and Native Land Conservancy (NLC) founding board officer, Leslie Jonas, CGSN hosted two notable sets of visitors in July and August 2024. The NLC is an Indigenous-led land conservation nonprofit based on Cape Cod that seeks to preserve land for future generations.
As a part of their Preserving Our Homelands (POH) summer science program, a group of students from the Mashpee Wampanoag tribe visited WHOI on 18 July. The POH program provides 6th, 7th, and 8th grade native students with hands-on science experiences in order to deepen their understanding of the environment from a western science perspective and its relationship to tribal culture, and traditional ecological knowledge. Their visit included a stop at the LOSOS facility, where CGSN team members talked about the scientific and technical aspects of the OOI program and provided an opportunity to see ocean observing technology up close. CGSN is grateful to WHOI engineer Ben Weiss and Sea Grant Marine Educator, Grace Simpkins, for organizing the visit and looks forward to ongoing interactions with the POH program.
Before the excitement from the POH tour had died down, a second group of visitors was hosted in early August. The group was made up of about 20 members of the Black, Indigenous, and People of Color (BIPOC) environmental science community. This included the NLC Executive Director, Diana Ruiz, and thirteen members of the Massachusetts Audubon Society and four NLC First Light Fellows. First Light is a paid summer fellowship program for rising Native American conservationists ages 18-25. With mentors from Mass Audubon, Fellows develop individual projects with topics in areas of ecological research, wetland restoration, water quality or land protection that build career skills and advance the NLC’s work. The fellowships combine indigenous culture, environmental sciences, and career development in order to open up career pathways. The four Indigenous Fellows who visited WHOI are studying at Brown, Yale, and Salish Kootenai College and got exposure to real-world instrumentation and engineering tools used to address pressing questions in ocean science research.
Read more about the NLC Fellows.
[caption id="attachment_34683" align="alignnone" width="640"]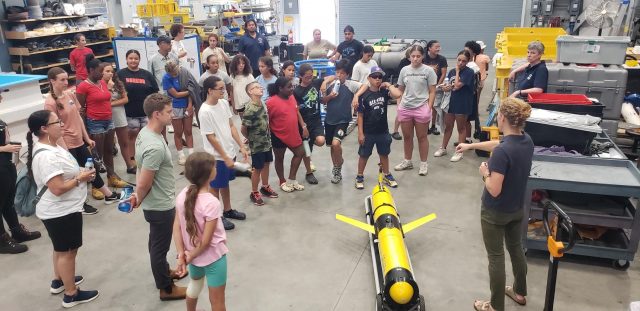 WHOI Senior Engineering Assistant Diana Wickman discusses the operation of an OOI ocean glider with Mashpee Wampanoag POH visitors. Photo credit J. Lund.[/caption]
[caption id="attachment_34684" align="alignnone" width="640"]
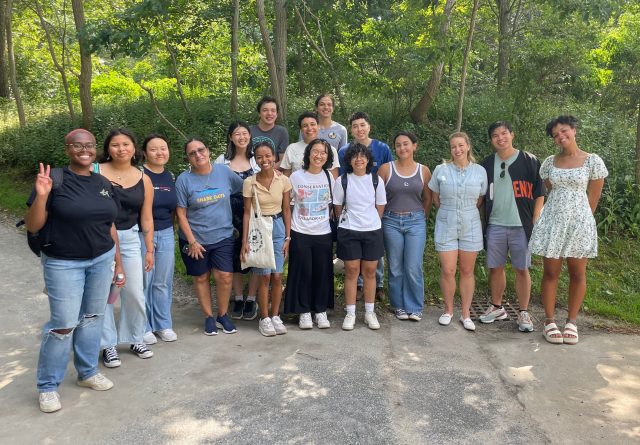 The August group included Native Land Conservancy First Light Fellows and members of the Massachusetts Audubon Society. Photo credit: L. Jonas.[/caption]
Read More
 CI Compass Fellowship: Empowering Undergraduates Through Hands-On Experience with OOI
The CI Compass Fellowship Program (CICF), funded by the U.S. National Science Foundation (NSF), is a key initiative for NSF CI Compass to provide undergraduate students with hands-on experience in cyberinfrastructure and data-intensive research.
CICF hosts a 12-week virtual Spring Program where students are taught skills they would utilize in a cyberinfrastructure career at an NSF Major of Mid-scale Facility. Students can then apply for the Summer Program, which places a limited number of students in hands-on cyberinfrastructure projects at collaborating NSF Major Facilities.
CI Compass Fellows Cailin, Connor, and Palina, earned internships at the Ocean Observatories Initiative (OOI) this summer.
Nicole Virdone, Project Manager and Director of Outreach for CI Compass, emphasizes that the program’s goal is to offer real-world experience by placing students in internships with major scientific projects like the OOI. “It’s crucial for students to gain practical skills that prepare them for the complexities of professional research environments,” she says.
Through the CI Compass Fellowship, students work directly on projects that support the OOI’s mission, applying their academic knowledge to real-world challenges.
Summer Internships with OOI Included:
- Cailin, a Computer Science major at Villanova University, worked to create a professional dashboard using WordPress, HTML, CSS, and Beaver Builder. The project involved developing a centralized hub where users could access a calendar and view key datasets. By integrating data from Google Sheets via an API, Cailin ensured real-time updates were displayed in tables and charts. The result was a clean, responsive, and functional tool that enhanced the user experience, combining web development with effective data integration.
- Palina, a Computer Science major at the New Jersey Institute of Technology, worked on two projects with OOI. In the first project, she gathered and organized data from various programs, including OOI, NEON, ONC, and AOOS and complied it in Jupyter Notebooks, aligning the data by matching sampling rates and timestamps. In the second project, Palina analyzed how data trends over time related to El Niño and La Niña events allowing her to apply her research and data analysis skills while gaining a deeper understanding of environmental events.
- Connor, a Computer Science major at Ball State University, worked primarily on computer vision projects. One of his main tasks was automating the summarization of over 46,000 videos captured by OOI’s cameras. He developed a method to select 9 key frames from each video to represent its overall content. He created a pipeline to identify blank frames for annotation, helping to streamline and organize the data.
Virdone highlights the program’s success in attracting a diverse group of students, “We’ve seen incredible growth and interest in the program, particularly from underrepresented students in computer science,” she explains. “The impact on these students is clear – they’re gaining experiences that will shape their careers in STEM.”
The CI Compass Fellowship Program not only enriches students’ education but also brings fresh perspectives and technical skills to the OOI. “Mentorship and matching students with the right projects based on their interests and skill levels are key priorities for us,” said Virdone.
Jeffrey Glatstein, Senior Manager of Cyberinfrastructure at OOI emphasizes the impact of the student’s contributions, “The students’ innovative approaches and fresh perspectives have led to tangible impacts in our data management and workflows. It’s a win-win; they gain hands-on experience, and we benefit from their enthusiasm and skill.”
As the CI Compass Fellowship Program continues to grow, it remains an important experience for developing the next generation of scientists and researchers.
Learn more about the CI Compass Fellowship Program by visiting the CI Compass website.
For those interested in the application process of the program, please visit the CI Compass Fellowship Program’s Application process webpage.
[caption id="attachment_34659" align="alignnone" width="480"]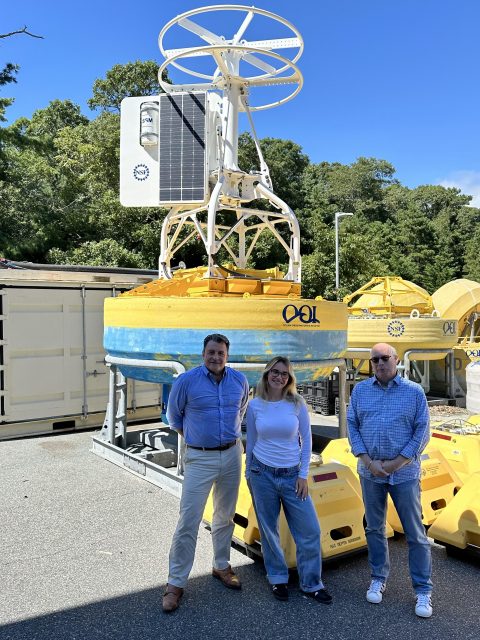 CI Compass Fellow Cailin stands with Matthew Palanza (L), OOI Lead Systems Engineer and Jeffrey Glatstein (R), Senior Manager of Cyberinfrastructure at OOI.[/caption]
[caption id="attachment_34660" align="alignnone" width="640"]
 Palina stands with the CI team at OOI[/caption]
Read More
 Where Sea Meets Sky: Children’s School Explores the Ocean’s Impact on Weather at OOI
Students from the Children’s School of Science recently visited the Ocean Observatories Initiative (OOI) at Woods Hole Oceanographic Institution (WHOI) for a field trip led by Dr. James Edson, Senior Scientist and Principal Investigator at OOI.
The visit focused on how the ocean influences weather and climate. Dr. Edson introduced the students to the OOI’s cutting-edge instruments that monitor ocean conditions and explained how ocean currents and temperatures play a crucial role in storms, hurricanes and global weather patterns.
The students participated in hands-on activities, including using anemometers to measure wind speed, and infrared hygrometers to measure evaporation and CO2 exchange giving them a practical understanding of how scientists study the interactions between the ocean and atmosphere. This immersive experience provided a unique opportunity to understand the ocean’s impact on the planet’s climate, sparking curiosity and inspiring future interest in science.
[caption id="attachment_34619" align="alignnone" width="640"]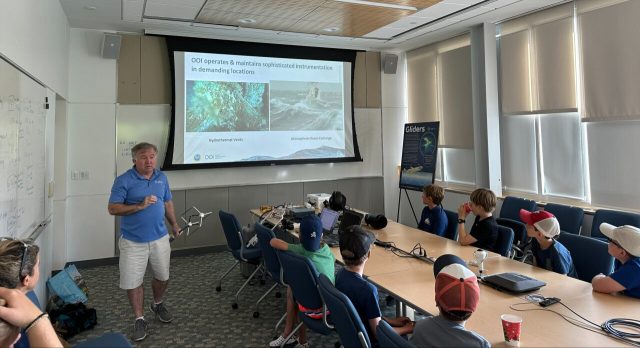 James Edson, Senior Scientist & Principal Investigator[/caption]
Read More
 Inside the Role of a Subsurface Mooring Lead
In the demanding field of oceanic exploration, a dedicated team of professionals from the Ocean Observatories Initiative (OOI) conducted the 11th annual cruise to the Station Papa Array in the Gulf of Alaska aboard the R/V Sikuliaq. Central to this mission was James Kuo, a Subsurface Mooring Lead (SML) at the Woods Hole Oceanographic Institution (WHOI), whose responsibilities were crucial to the voyage’s success.
Key Responsibilities
As the SML, James Kuo manages two flanking moorings and one hybrid profiler mooring. His primary responsibility is to ensure all instruments are fully operational before, during, and after deployment. This involves conducting thorough checks at each stage to confirm the equipment is in optimal condition for the year-long deployment. Occasionally, he must also address any issues that arise during deployment before leaving the array site, ensuring everything is functioning as intended.
During deployment, James primarily monitors engineering metrics, such as power consumption, to evaluate the health of the moorings. He also reviews scientific data—including pressure, temperature, and current velocities—to assess the moorings’ status and ensure that the instruments are positioned at the correct depths. This thorough approach provides a complete understanding of both instrument performance and the environmental conditions affecting the moorings.
When James and his team retrieve previously deployed moorings, they carefully inspect the instruments and analyze the data to identify any failures and determine their causes. Significant findings are annotated in the data stream to help scientists understand any anomalies during processing. Depending on the nature of a failure, these insights may lead to procedural changes or design modifications to improve future deployments.
Veteran of the Seas
James is well-versed in life at sea, having participated in approximately 28 cruises throughout his career. James is well-known for his ever-present smile while working to overcome daily challenges aboard the ship. Over his nine years at WHOI, he’s had the opportunity to explore diverse and exotic locations, including the Arctic, Norway, Italy, Chile, Uruguay, Iceland, Alaska, and various other domestic ports. Each expedition offers him a unique travel experience, venturing to places that are often beyond the reach of most travelers.
Career Development
James’s career in oceanography began in college as an intern at Scripps Institution of Oceanography where he assisted with various tasks and mooring assemblies. After graduating from University of California, San Diego (UCSD) with a degree in Structural Engineering, he joined Scripps full-time, focusing on mechanical design of moorings using CAD software.
During the first OOI Southern Ocean cruise in 2015, James collaborated with the WHOI team responsible for deploying the OOI Surface Mooring. A year later, WHOI recognized James’s expertise and offered him a position to continue his work with OOI. He focused on Subsurface Moorings, where he eventually became an expert in the field, mastering the intricacies of Subsurface Mooring platforms.
Future Aspirations
As the SML on the Papa expedition, James tackles a wide range of tasks and responsibilities, offering both significant challenges and rewarding opportunities. His journey from intern to Research Engineer reflects the dedication and expertise that have allowed him to excel in oceanographic research.
Looking forward, James sees significant growth opportunities at WHOI. He recently secured funding for a proposal to develop a mixed reality system for underwater ROVs, a project that is already underway. “The diverse projects and innovative opportunities offer the potential for a fulfilling and dynamic career,” said James.
[caption id="attachment_34599" align="alignnone" width="640"]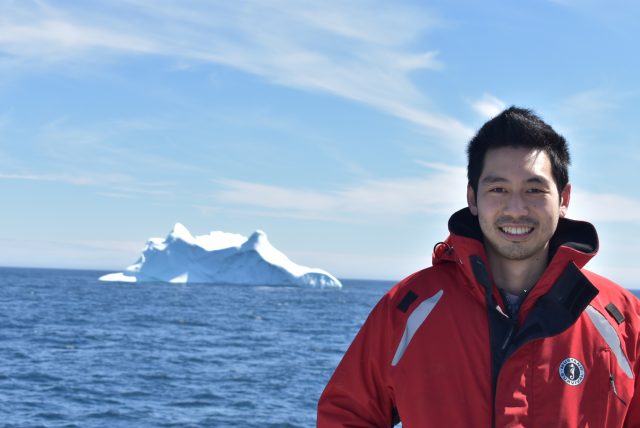 James Kuo, Research Engineer[/caption]
Read More
 Deep-Ocean Vertical Structure
It is often assumed that, at frequencies below inertial, the vertical structure of horizontal velocity and vertical displacement can be reasonably described by a single dynamical mode, e.g. the lowest order flat-bottom baroclinic mode. This is appealing because it would mean that first-order predictions of deep-ocean velocity structure could be determined from knowledge of density and surface currents. However, there is a relative paucity of full ocean depth data to test this idea. A study by Toole et al. (2023) used full ocean depth data from five sites – four of which are Ocean Observatories Initiative (OOI) arrays (Station Papa, Irminger Sea, Argentine Basin and Southern Ocean) – to address the question “does subinertial ocean variability have a dominant vertical structure?”
Data analysis was challenging, because it involved working with gappy records as well as combining information from multiple instruments on different moorings. As noted by the authors, “no single OOI mooring sampled velocity, temperature and salinity over full depth.” Wire-following profiler data from Hybrid Profiler Moorings were combined with ADCP and fixed-depth CTD data from adjacent moorings. While the authors note that “depth-time contour plots of the velocity data from each OOI site clearly reveal the shortcomings of the datasets” they also recognized that despite the shortcomings, “these observations constitute some of the only full-depth observations of horizontal velocity and vertical displacement from the open ocean.”
It was possible to obtain 2-3 years (non-contiguous in some cases) of near-full ocean depth data from each site. Inertial and tidal variability was removed, and the data were filtered over 100 hr (~4 days). Empirical Orthogonal Function (EOF) decomposition was used to identify an orthogonal basis set that described horizontal velocity and vertical displacement. In addition, dynamical modes were determined for three cases: flat bottom, sloping bottom and rough bottom. Note that computing the dynamical modes requires the vertical density profile, which was taken as the mean over each deployment. Analysis was focused on the lowest modes, which accounted for the majority of the variance.
The results (Figure 32) showed that there is an EOF consistent with a dynamical mode at most sites. However, the appropriate dynamical mode is different for each site – no single dynamical accounted for a dominant fraction of variability across all sites. The authors note that differences in bathymetry, stratification and local forcing complicate the picture, with different dynamical processes dominating at different sites. Prior studies (not full ocean depth) that appear to show a “universal” vertical structure may be misleading
This project shows the potential for OOI data, with appropriate processing and analysis, to provide unique insights into ocean structure and dynamics. The researchers have made the combined vertical profile data available to the community on the Woods Hole Open Access Server. The dataset DOI (https://doi.org/10.26025/1912/66426) is also linked here: https://oceanobservatories.org/community-data-tools/community-datasets/.
[caption id="attachment_34586" align="alignnone" width="624"] Mode 1 EOFs for velocity (u, red; v blue; cm/s) and vertical displacement (black, decameters) for OOI arrays at (from left) Argentine Basin, Southern Ocean, Station Papa and Irminger Sea. Adapted from Toole et al., 2023.[/caption]
___________________
References:
Toole, J.M, R.C. Musgrave, E.C. Fine, J.M. Steinberg and R.A. Krishfield, 2023. On the Vertical Structure of Deep-Ocean Subinertial Variability, J. Phys. Oceanogr., 53(12), 2913-2932. DOI: 10.1175/JPO-D-23-0011.1.
Read MoreSubsurface Acoustic Ducts in the Northern California Current System
Xu et al.’s analysis of the hydrographic data recorded along the U.S. Pacific Northwest coastline leads to the identification of a secondary subsurface acoustic duct. A numerical simulation based on the sound-speed field determined from OOI Coastal Endurance and APL-UW glider CTD data suggests that the presence of the duct has major impact on sound propagation at a mid-range frequency of 3.5 kHz in the upper ocean (Figure 31). Specifically, the ducting effect is evident in the trapping of sound energy and the consequent reduction in transmission loss within the duct. Glider observations show that the duct is a large-scale phenomenon that extends hundreds of kilometers from the outer continental shelf to regions offshore of the continental slope. The axis of the duct shoals onshore from between 80 and 100 m depth offshore of the continental slope to less than 60 m over the shelf. Analysis of the sound-speed profiles determined from glider CTD data suggests that the prevalence of the duct decreases onshore, from over 40% in regions offshore of the continental slope to less than 5% over the shelf. In addition, analysis of the long-term time series of sound-speed profiles determined from the CTD data recorded over the shelf slope off the Washington Coast suggests that the duct is more prevalent in summer to fall than in winter to spring. Furthermore, examination of concurrent OOI Coastal Endurance Array (Washington Offshore Profiling Mooring) observations of sound speed and flow velocity indicates that the duct observed over the shelf slope is associated with a vertically sheared along-slope velocity profile, characterized by equatorward near-surface flow overlaying poleward subsurface flow.
[caption id="attachment_34581" align="alignnone" width="462"] (adapted from Fig. 3 of Xu et al., 2024) (a) The sound-speed field obtained from the CTD data recorded by an OOI-CEA coastal glider during 06-16 October 2018. The contour lines are potential density (in kg/m3). The magenta dots mark the locations of the local sound-speed minima along the axis of the subsurface duct. (b) The trajectory of the Seaglider. The red dot marks the location of the OOI-CEA Washington Offshore profiler mooring. The bathymetry contour lines mark seafloor depths in 100 m increments between 10 and 500 m and then in 500 m increments between 500 and 3000 m. (c) The vertical sound-speed profile at 20 km along-track distance. The local sound-speed minimum at the axis of the duct is labeled.[/caption]
___________________
References:
Guangyu Xu, Ramsey R. Harcourt, Dajun Tang, Brian T. Hefner, Eric I. Thorsos, John B. Mickett; Subsurface acoustic ducts in the Northern California current system. J. Acoust. Soc. Am. 1 March 2024; 155 (3): 1881–1894. https://doi.org/10.1121/10.0024146
Read More
