
Technical Innovations
OOI Engineers Develop New Rechargeable Lithium-ion Battery Pack
By John Lund, Research Associate, Woods Hole Oceanographic Institution
The final deployment of the Coastal Pioneer Offshore Mooring (CP04OSPM-00016) was the first deployment of a prototype rechargeable lithium-ion battery pack. The deployment was a success with the battery pack providing power throughout the entire 6.5-month deployment.
Working with Mathews Associates Inc. the OOI engineering team developed a drop-in replacement lithium-ion rechargeable battery pack to replace the original one-time use alkaline packs. Each alkaline pack consists of 72 D-sized batteries that are fabricated into a hexagonal assembly. Nine of these battery packs are fitted into a buoy battery chassis that fits inside the buoy well. The packs are wired together in parallel to provide the required voltage to power the computer (buoy controller) responsible for telemetry and data-logging.
Pioneer moorings are nominally deployed for 6-month intervals. Variability in ship scheduling requires that the buoys be capable of operating for 7+ months. The alkaline battery chassis was designed to fit enough packs to power the buoy for the planned duration and or until the recovery ship arrived.
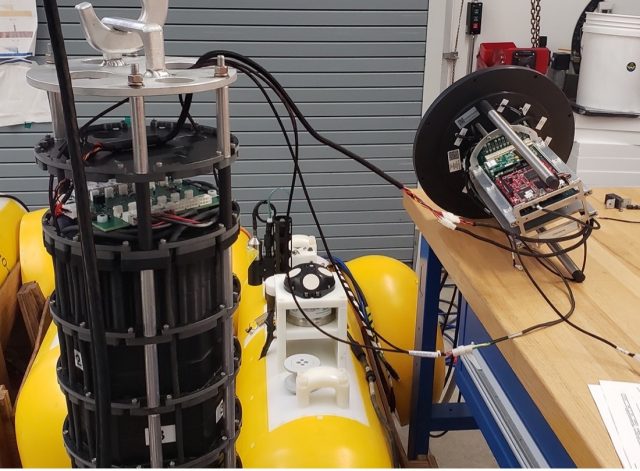
[media-caption path="https://oceanobservatories.org/wp-content/uploads/2023/08/Lithium-batteries.jpg" link="#"]Lithium Battery chassis during testing and integration with the buoy computer. Battery chassis is on the left. Buoy end cap with Linux computer board on the bench. Wire Following Profiler center on the floor collects the majority of the Profiler Mooring data set.[/media-caption]The Offshore mooring was selected to be a test mooring because it is one of the deeper moorings in the New England Shelf (NES) Pioneer Array and as such logs and transmits more data than a shallower mooring. The larger data sets mean that the buoy up-time, and therefore power usage, is greater than one in shallower water so this would be a tougher test of the lithium-ion packs.
Although there is an increased cost to purchasing the initial set of lithium batteries there are many advantages to the rechargeable batteries. Because the alkaline packs are conservatively sized for the deployment there is often a considerable amount of power remaining in the packs when they are recovered, yet this remaining power is insufficient for another full deployment, and new batteries must be used. The chief benefit of the rechargeable batteries will be to keep the one-time use alkaline packs from going to the landfill (~1 ton per year). There is also a considerable labor savings of not having to deconstruct and reload the chassis frames with replacement batteries. Our calculations indicate that we will break in terms of procurement cost compared to alkaline batteries in approximately six years and that the lithium-ion batteries have enough charge cycles (500) to last the duration of the program. With any luck these may be the last batteries we need to purchase for the Profiler Moorings!
Read More
New Controller Latest in OOI Innovations
Having equipment in the water around the clock for six months at a time provides many challenges for the land-based OOI engineering team charged with keeping the equipment operational so there is a continual flow of data to shore. Maintaining consistent, reliable power for the ocean observing equipment is at the top of this list of challenges.
OOI’s data-collecting instruments attached to the moorings run on batteries charged by renewable wind and solar energy. OOI is in the process of replacing the current solar panels with new panels that are more efficient at generating energy, even when shaded. To supplement this upgrade, the OOI arrays are also being outfitted with a brand-new solar controller to manage the energy going into the batteries. Like with the new solar panels, OOI engineers looked for a controller that was available commercially for easier repair and replacement.
“What was important to us was finding a way to use these new solar panels in the best, most optimal way,” said Woods Hole Oceanographic Institution (WHOI) engineer Marshall Swartz. “We looked for a company that would help us specify and build a customized algorithm for a controller that would optimize the functionality of the panels by taking into account battery temperatures.”
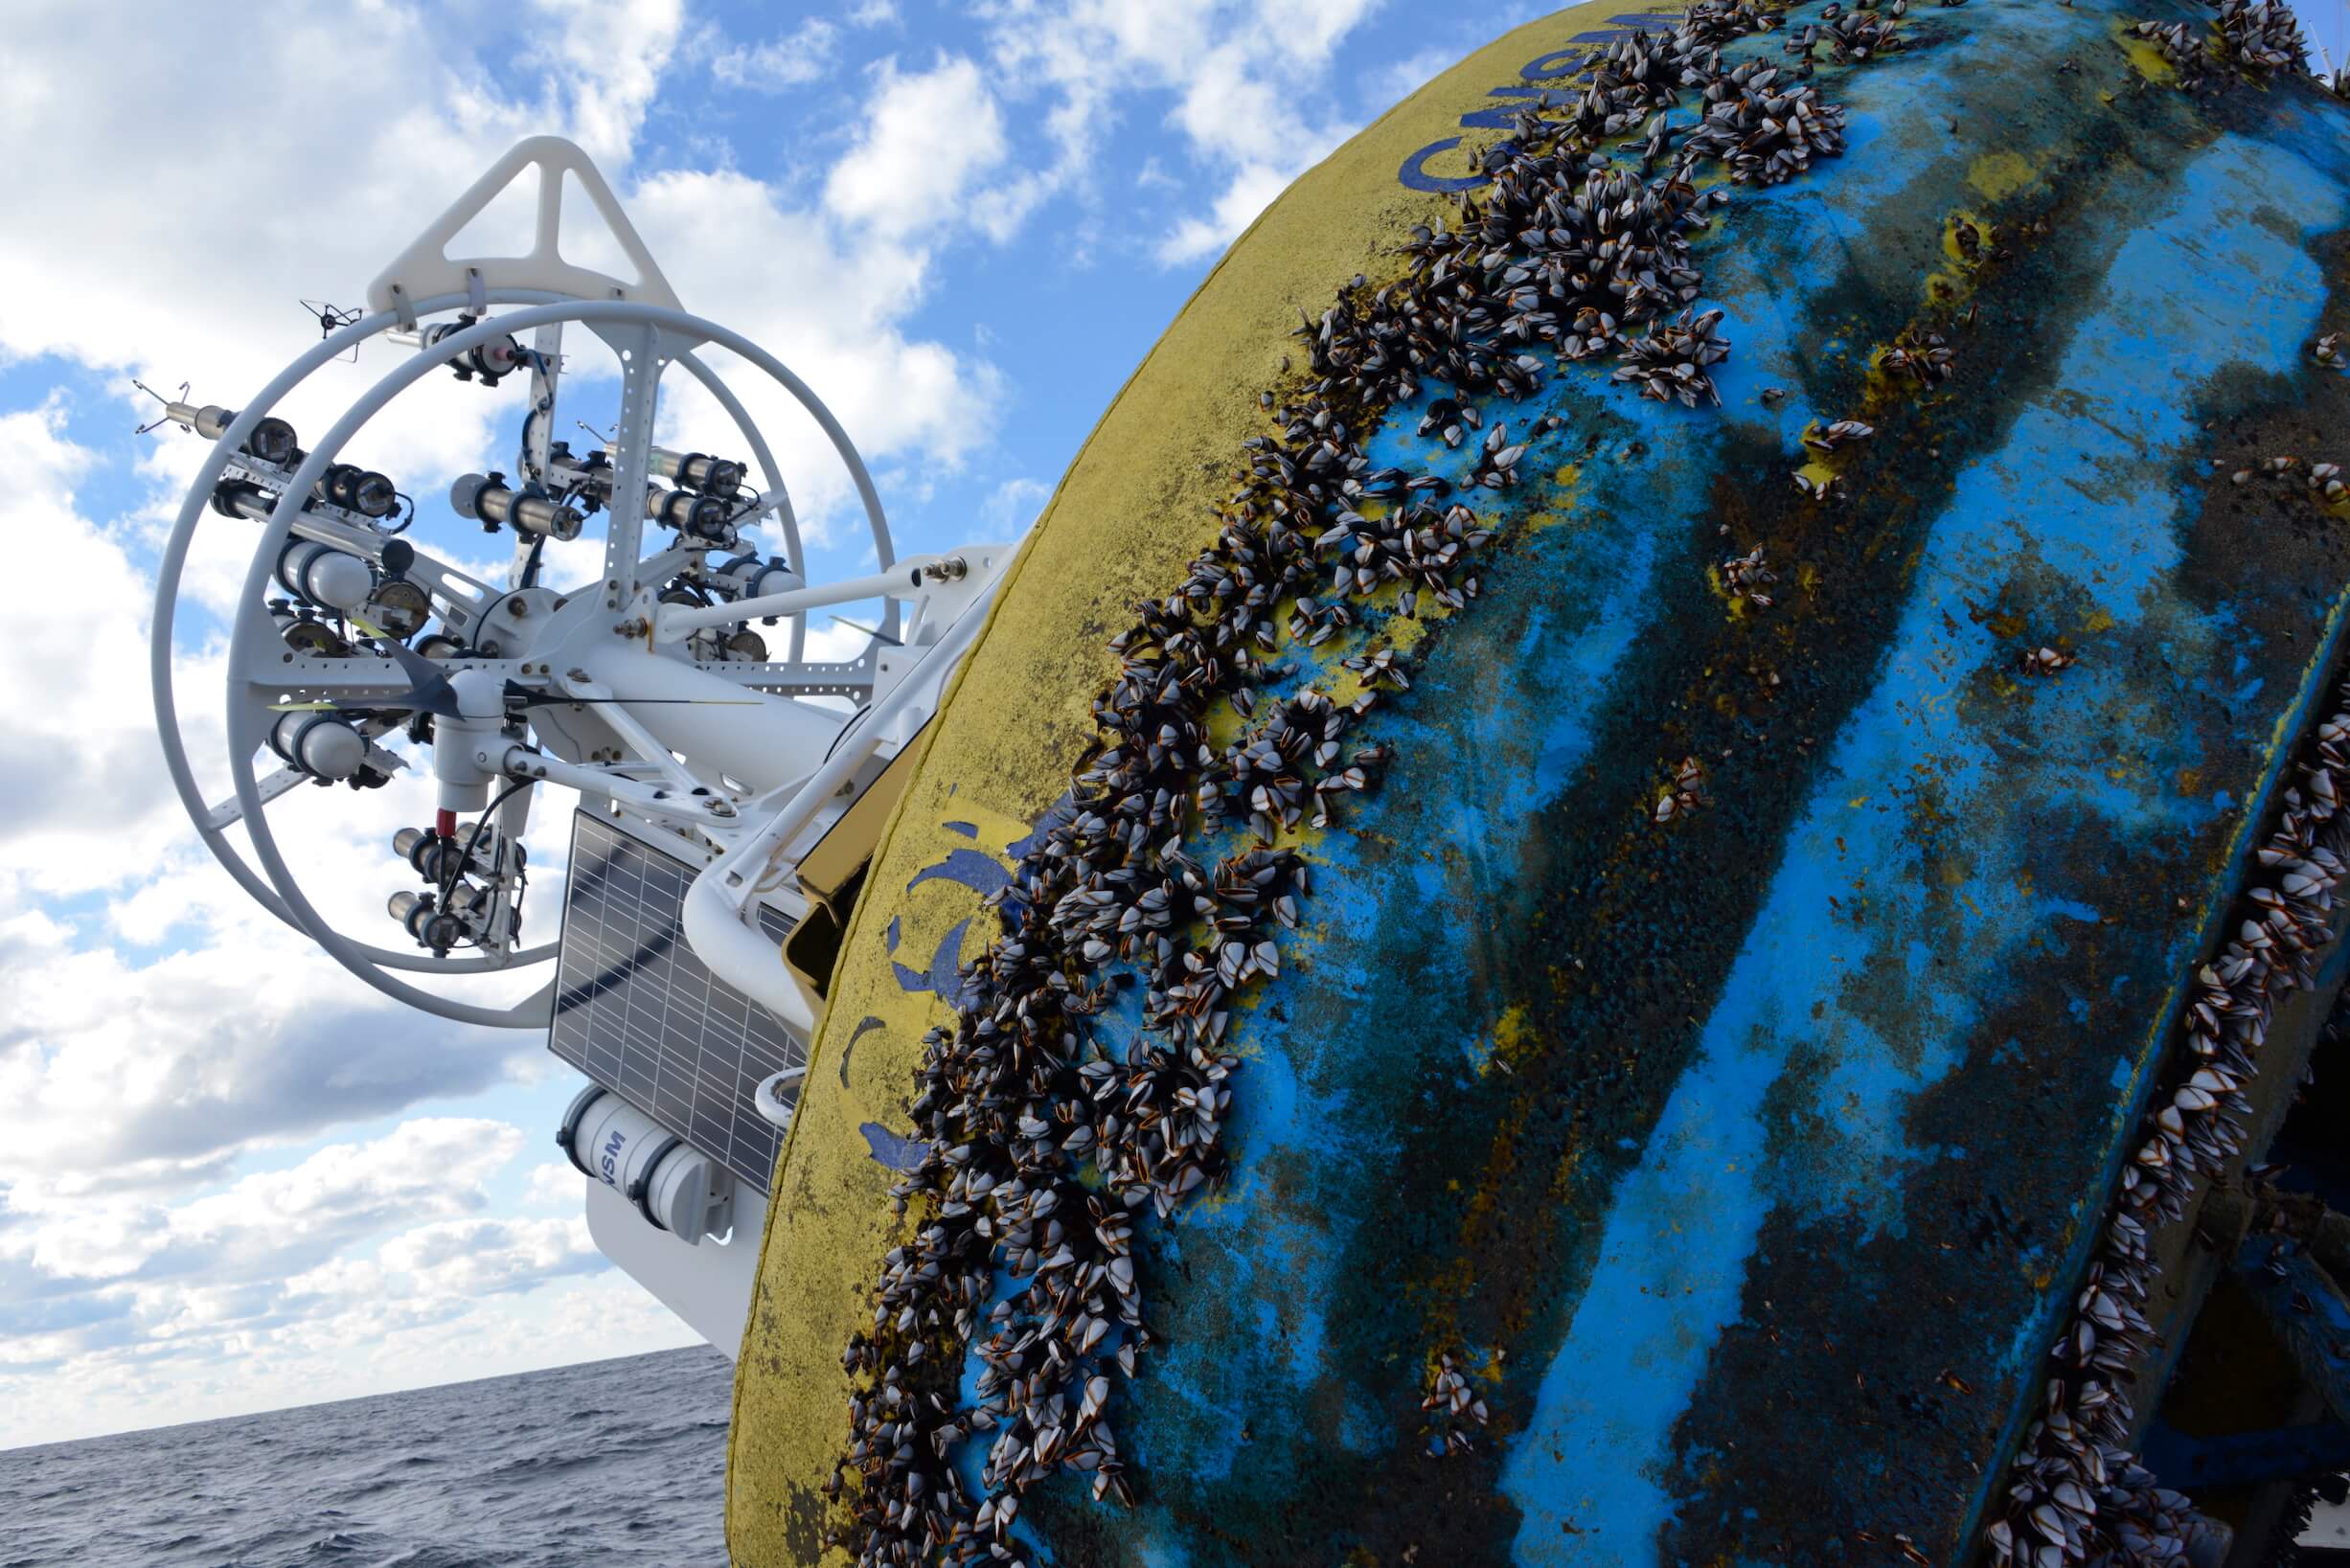
[media-caption path="/wp-content/uploads/2021/12/DSC0486-2.jpeg" link="#"]Buoys get quite the workout when they are in the water for six months and more. Powered by wind, solar, and batteries, OOI has recently improved the way energy from the solar panels is managed with new controllers. Credit: ©WHOI, Darlene Trew Crist. [/media-caption]
Some larger, older controllers can consume up to 3-5% of the energy coming into the device, but the new controller is smaller and more efficient, helping to optimize the amount of energy harvested.
Temperature conditions play a big role in how effectively the energy is managed. Changing battery temperatures require the controller to adjust its charge settings to maintain battery life and capacity. The controllers used on OOI moorings sense battery temperature and automatically adjust to assure best conditions to assure reliable operation.
“It’s really essential for us to maintain the proper charge levels for existing temperature conditions,” said Swartz. The OOI buoys encounter a wide range of temperatures: from subfreezing temperatures up to 40°C (over 100°F) when a buoy is sitting in the parking lot before it is deployed. When the buoys are deployed, water temperatures can vary widely from -1 to 33°C (~30 to 91°F), depending on seasonal conditions.
The new controller automatically regulates the amount of electricity going into the battery under such varying temperature conditions. If the wind turbines are generating more energy than the battery needs, for example, the controllers direct excess power into an external load that dissipates heat and adds resistance to the spinning of the wind turbines, preventing the turbines from spinning too fast, possibly damaging their bearings.
“As parts of the OOI infrastructure need replacing or to be upgraded, this offers us the opportunity to find more efficient, and often times, off-the-shelf, less-expensive replacements that will help us keep the arrays functioning and data flowing,” Swartz said. “It’s a winning combination for all parts of the operation.”
Read More
Update on RCA Broadband Hydrophone Data Availability, File Formats, and Directory Structure
As part of continuing OOI data process improvements, the RCA Data and OOI Software Development Teams have been working closely to expand data availability and improve data file consistency for six Broadband Hydrophones (HYDBBs) located at Axial Base (2), Slope Base (2), and Oregon Offshore (1) and Shelf (1) sites. Additional details are available on these study sites and instruments at these links.
A system update will go live at 17:00 UTC June 7, 2023 and will affect all HYDBB data posted on the Raw Data Archive server after that date. In the near future, the updates will also be applied to historical HYDBB files previously posted on the Raw Data.
OOI HYDBB data are currently provided to the public on the OOI Raw Data Archive server as MiniSEED-formatted files (extension “.mseed”). This lossless, compressed format is a subset of the Standard for the Exchange of Earthquake Data (SEED) that is in extensive use for archiving and serving seismological data (see IRIS). The HYDBB MiniSEED files are served on the Raw Data Archive in daily subdirectories organized by year and month for each of the sites:
- Axial Seamount – Axial Base
- Continental Margin – Slope Base
- Continental Margin – Oregon Offshore
- Continental Margin – Oregon Shelf
Once the system update goes live on June 7, all HYDBB data posted on the Raw Data Archive server after this date will have the following enhancements:
- Currently, only HYDBB data arriving at the OOI data repository in near real-time are provided to the public in the daily subdirectories, updated at nominal 5-min intervals. After the system update, data arriving at the OOI repository after Navy review will also be made available on the Raw Data Archive. These delayed and previously publicly unavailable data will be provided as analogously named MiniSEED datafiles but in separate subdirectories named “addendum” under each daily directory.
- Each individual MiniSEED file will include HYDBB data over fixed 5 min timespans, starting at 00:00 UTC and repeated at subsequent 5 min intervals (beginning at 00:05, 00:10 UTC, etc.). If no data are available for a specific 5 min timespan, the datafile will not be created. Any gaps in the data stream during each 5 min timespan are accounted for by the use of the multi-trace extension of the MiniSEED file format construct, which allows multiple temporal segments within a single file. Previously, each HYDBB file on the Raw Data Archive contained only a single continuous trace of data. An example Python toolbox for accessing/processing such MiniSEED data is available, with additional information on the ObsPy open-source project here.
This change in file construction will allow for more efficient access and delivery of HYDBB data, particularly when there are small and frequent gaps in the data streams which can lead to excessive file fragmentation, as was often the case with these data before this system update.
If you have any questions, please contact the OOI HelpDesk or post your question on the public OOI Discourse Forum.
Read More
RCA Technical Wizards: The Saga of Repairing an RCA Primary Node
Chuck McGuire and Larry Nielson were able to take a cabled power and communications substation that sat inoperable on the dark, cold seafloor of the Pacific for two years and make it work again. The odds were against them. There’s usually less than a 50-50 chance to make a complex technology operational again after this length of inactivity – inactivity compounded by the extreme pressure, cold temperature, and biofouling that occurs on the bottom of the Pacific Ocean. But these two engineering geniuses succeeded in repairing, rebuilding, and ultimately reconnecting Primary Node 1B (PN1B), which provides power to the Southern Hydrate Ridge portion of OOI’s Regional Cabled Array (RCA).
[embed]https://vimeo.com/user110037220/pn1b[/embed]It was an arduous, complicated journey, fraught with delays outside of the engineers’ control. The recovery, repair, and reinstallation took two years to complete. We share some of the highlights below for they illustrate the many challenges of operating seafloor cable infrastructure on an active tectonic plate in the Pacific Ocean.
Chuck McGuire, a senior principal engineer, is the chief engineer for the RCA and principal investigator for the engineering portion of the RCA, which is conducted at the University of Washington’s Applied Physics Laboratory (APL). Larry Nielson is a field engineer three at APL. They have been working on the RCA project since its inception in 2009 (Construction and deployment began in 2013).
When PN1B failed in 2020, the duo was stymied at first. They had to call in a variety of people with different skills to recover, rebuild, and redeploy it.
“Restoration of the PN1B is really a testament to the engineering that went into these nodes, which are good and work well under very harsh conditions, “explained McGuire. The Primary Nodes were designed and built by L3 Maripro with oversight by the APL Engineering team.
A Cable Fault Causes Power Loss
The saga began during RCA’s annual maintenance expedition in summer 2020. Everything was smooth sailing until suddenly the science team aboard the R/V Thomas G. Thompson learned of a cable fault on the southern cable line, which had shorted out. McGuire and team instantly went into troubleshooting mode and determined that the problem was in PN1B, which powers the Southern Hydrate Ridge section of the 900 kilometers of cable that comprise the RCA.
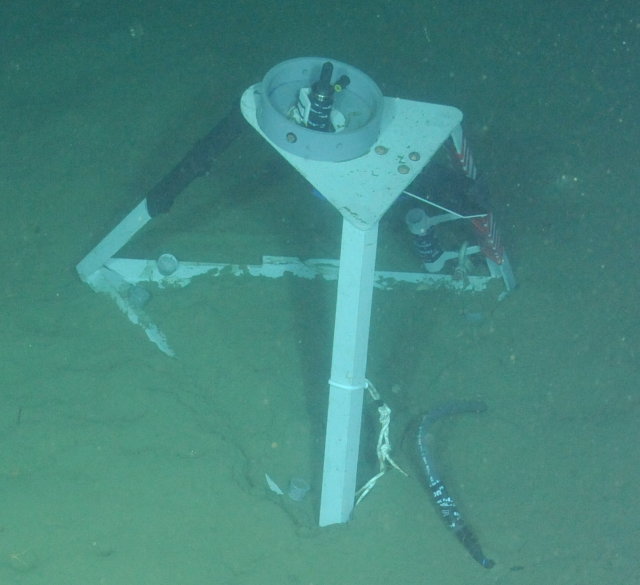
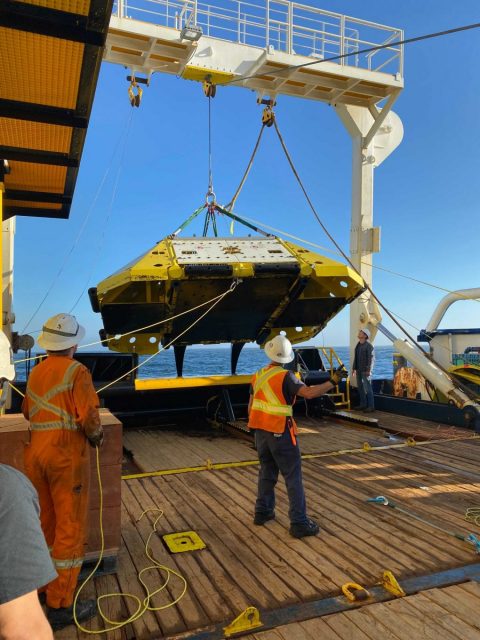
[media-caption path="https://oceanobservatories.org/wp-content/uploads/2023/03/202108-Recovery-of-Failed-PN1B-scaled.jpg" link="#"]Recovery of failed PN1B. Credit: NSF/OOI/UW.[/media-caption]Luckily, they were able to divert the ship, the R/V Thomas G. Thompson, to the PN1B location to investigate. McGuire was on shore at the Shore Station in Oregon where he could troubleshoot the power system. McGuire worked with a team onboard to use the Remotely Operated Vehicle (ROV) Jason, operated by the National Deep Submergence Laboratory of the Woods Hole Oceanographic Institution, to unplug and plug back in the science interface assembly (SIA) that provides power and communication to secondary infrastructure on the array (e.g. extension cables, junction boxes, instruments, and moorings). The SIA was attached to and powered by PN1B. The SIA wasn’t the cause of the short, so the next step was a visual inspection of the cable with the ROV, tracing the cables back from the node to see if there was any external aggression or damage to that cable. None was seen. The next step was to determine where the power was lost. By controlling the power from the Shore Station and sending “tones” (an oscillating frequency) down the cable, they were able to isolate the affected area. They determined that the PN1B was no longer transmitting any power to the southern cable line running east of the node.
McGuire and Nielson set to figuring out how to replace the damaged node with a spare. A specialized cable ship would be required. A request for proposal was released and the cable ship IT Integrity was secured.
With a cable ship lined up, the engineering team set about reconfiguring the Primary Node and a replacement SIA, which would be plugged into PN1B when both were back on the seafloor. The assembly was complicated and required reconfiguration of all the optics in the SIA’s interior. “Larry was able to get the SIA unassembled and rigged up in a way that made it possible for me to go in and remove and replace the components that needed to be replaced,” explained McGuire. “All of this was unexpected work, which took time, and there was much aggravation. But Larry had some amazing solutions to some interesting rigging problems.”
The two engineers had to rely on their experience to tear down the SIA and then reconstruct it. Their challenge included having to create specialized tools to get into extremely tight spaces. McGuire likened the work to repairing a car engine, where one slowly takes things off, working through the engine until finding the problem. The difference between the Primary Node and a car, however, was that spare parts to fix any issues found weren’t readily available and would have to be manufactured if needed. Here, again, the skill, experience, and tenacity of this duo were called into play. After taking the node apart and putting it back together again, they are now experts.
Their work was driven by a tight schedule needed to get the node and SIA ready for the next RCA recovery and deployment cruise in July 2021. The plan was to have the cable ship work simultaneously with the ROV Jason that was aboard the Thompson. During the 2021 expedition, Jason successfully unplugged and recovered the SIA. The cable ship Integrity then dropped a recovery line next to the node and Jason hooked the recovery line to the node. The cable ship recovered the node, returned it to the dock in Newport, where it picked up the replacement node. All seemed to be going well and on schedule.
While the transit and offloading were taking place, the team had tied the cables to a surface buoy to keep them accessible for reconnection to the new node. When back at the buoy, engineers on the Integrity began the process of jointing—essentially splicing—the tied-off cables and attaching them to new cables connected to the replacement node. When all was connected, the next step was to use a cable winch to lower the cables down to the bottom. Unfortunately, during deployment of the replacement PN1B, the system was damaged which resulted in a shunt fault. Tests indicated the damage was most likely in or very close to the cable termination assembly (CTA) making a repair with the node, at that time, not possible. The replacement PN1B was recovered to deck.
Rather than admit defeat, McGuire came up with the idea to bypass the replacement node and connect the cable downslope from the west to the eastern cable together to provide power and communication to Primary Nodes PN1C and PN1D. McGuire figured that if optical power was too high, communications would fail since PN1B would not be in the system to attenuate the signal. After a few quick calculations, McGuire determined what the attenuation needed to be in the line so that the power wasn’t too high to prevent communication down the cable. The required attenuators were driven down to Newport while the ship headed to port to retrieve the critical parts. The cables were then jointed with the attenuators in the optical circuit, restoring about 65 percent of the power and communications lost to the cable system initially and allowing RCA instruments and moorings at the Oregon Offshore and Oregon Shelf sites to become operational again. The maneuver was innovative and an engineering feat.
Upon returning to the lab, the team faced other challenges. They had to reverse engineer a CTA. Because many of the parts could not be seen without destroying other critical parts, a CT scanner was used to scan its many parts, and point clouds (discrete set of data points in space) were developed. These cloud points were then fed into Solidworks, a software program, to create models of each part that needed to be machined or refurbished.
“CTAs are a very complex component,“ explained McGuire. “They terminate a cable into an object that must retain its watertight integrity at over 3000 meters water depth, while withstanding 35,000 pounds of pulling force and protecting the optical fibers in the cable. Also, there’s not a rock solid on-land way to test its water tight integrity once it’s been built with the cable, ready for deployment.”
In getting ready for the next deployment attempt, the engineering duo encountered other obstacles from COVID-related delivery delays to manufacturers who no longer manufactured needed components. They persevered. The team tore down the replacement node a second time and rebuilt it, with the same deliberate process given the first replacement node. Once completed, they took the replacement node through a complete battery of tests, making sure that it was capable of being powered up, could communicate with the SIA, and provide power to the cabled system. They then shipped the node to Portland to be loaded on a larger cable ship, the C.S. IT Intrepid.
In June 2022, the replacement node was again ready for deployment. McGuire boarded the Intrepid with field engineer Paul Aguilar to oversee deployment. After two days of bad weather, the ship finally was on site. The deployment went without incident except that the node landed 400 meters short of where it was to connect to the cable. To reposition the node, PN1B would have to be lifted back on deck and four kilometers of cable would have to be “peeled” off the seafloor. This would greatly increase the risk to PN1B and the cable, so the team came up with the idea of essentially creating an extension cord to make the cables meet.
“The node was working, the whole system was working except we couldn’t plug anything into it yet, because it was too far away from where it needed to be,” said McGuire. “That was in the middle of June. We had until the end of July, (for the 2022 RCA recovery and deployment expedition) to acquire the parts, build an extension cable and come up with a plan to connect the two cable segments. “
As they do, McGuire and Nielson came up with a plan. By the July departure date, McGuire was aboard the Thompson to oversee the connection. Nielson was onshore to support logistics and attend to any contingent plans that might be needed. The deployment included coming up with a new rigging configuration that required hanging 500 meters of cable off the bottom of the Remotely Operated Platform for Ocean Sciences (ROPOS), a 40 hp Science/Work Class ROV operated by the Canadian Scientific Submersible Facility, using Yale grips every 100 meters or so to allow for proper positioning once the cable was on the sea floor. Using ROPOS, the team guided the end of the cable lit with a transponder and put the end right next to the Primary Node. They then “walked” the ship towards where the cable had to be plugged into the node, essentially laying out a long string in the water to the correct spot.
“And it worked on the first shot, which still amazes me today,” concluded McGuire. “I cried and went to bed.”
Read More
Making the Ocean Accessible Through Sound
“Scientists are finding that people can sometimes pick up more information from their ears than the eyes can see. And ears can perceive patterns in the data that the eyes can’t see,” said Amy Bower, a Senior Scientist at Woods Hole Oceanographic Institution and Principal Investigator for the Accessible Oceans project. “Adding sound to science allows more people to experience science, follow their curiosity, and make science more accessible to all. “
Bower joined forces with a multidisciplinary team to explore ways sound could be used to visualize data. Funded by the National Science Foundation’s Advancing Informal STEM Learning Program, Bower and her team have been working for nearly two years on Accessible Oceans: Exploring Ocean Data through Sound. Their goal is to inclusively design and pilot auditory displays of real ocean data. They are implementing a process called sonification, assigning sound to data points. Each member brings expertise to the task at hand. Principal Investigator Bower is an oceanographer. Dr. Jon Bellona is a sound designer with specialization in data sonification at the University of Oregon. Dr. Jessica Roberts and graduate student Huaigu Li, both at Georgia Tech, are Learning Sciences and human-computer interaction experts. Dr. Leslie Smith, an oceanographer and specialist in ocean science education and communication at Your Ocean Consulting, Inc., rounds out the team. Bower is a blind scientist, who lends a crucial perspective in the research and overall execution of the project.
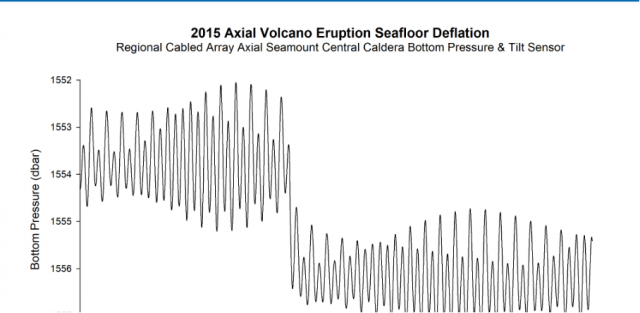
To begin, the team chose to use datasets collected by the Ocean Observatories Initiative (OOI) that had previously been transformed into classroom-ready use by Smith and the Ocean Data Labs. The team is working first on three of these curated datasets: the 2015 eruption of Axial Seamount, the vertical migration of zooplankton during an eclipse event, and carbon dioxide exchange between the ocean and the atmosphere.
“Data is made of numbers. Sonification is basically just translating numbers into sound,” Bower explained. “So instead of seeing numbers go up and down on a graph, for example, you can hear them go up and down.”
To ensure an inclusive final product, the team has undertaken a co-design process in which a variety of stakeholders have been engaged for input throughout the process. The team interviewed both subject matter experts and teachers of the blind and visually impaired to ensure that both scientific and pedagogical needs were being met. They then explored the integration of various auditory display techniques and ended up with a mix of data sonification, narration, and environmental sounds. The team put together a sample of five to six sonification examples for each data set, then surveyed a group of blind, visually impaired and sighted adults and students with science and non-science backgrounds. The survey’s purpose was to ask which sounds and which approaches might work best for both sighted and visually impaired listeners.
“We asked, for example, which of these sounds do you think best represents gases coming in and out of the ocean. The feedback was overwhelmingly in favor of a breathing sound,” said Bower. “As listeners will hear in the first example below that deals with carbon dioxide exchange between the ocean and the atmosphere, the breathing sound, with narration explaining what to expect, really brings the data to life.”
Accessible Oceans is a pilot and feasibility study for a museum exhibit that would introduce the broader public to what it’s like to experience ocean data through sound. At the end of this two-year project, the team intends to submit another proposal to design and build an exhibit that make ocean data come alive in a new and accessible way.
“As we’ve been working on this project, we’ve come to realize that to engage more people in science, technology, engineering and math, we can appeal to their ears as well as their eyes,” added Bower. “And I’m determined to help make science as accessible as possible for everyone.”
________________________________________________________________________
To hear more about Amy Bower’s work as an oceanographer and her exploration of sonification, tune into this episode of The Science of Ocean Sounds, Tumble Science Podcast for Kids.
Read More
New OOI Coastal Surface Mooring Design
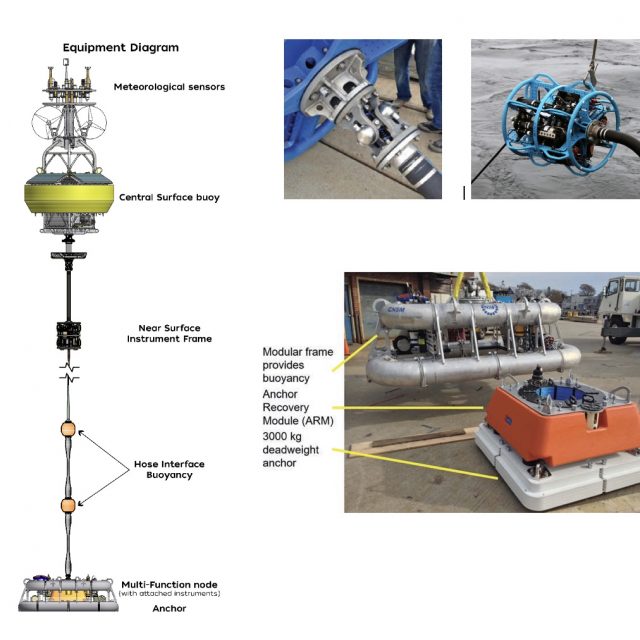
The OOI Coastal Surface Moorings (CSMs) showcase a variety of innovative mooring technologies. Although the design concepts were initially developed as elements of other mooring systems, they were brought together for the first time on the OOI CSM. A recent paper by Peters et al. (2022) describes three areas where new design concepts were particularly impactful: (1) components at the interface between the surface buoy and mooring riser, (2) mooring riser components, and (3) an integrated seafloor anchor and instrument frame. These components work together to provide mechanical integrity for the mooring as well as mounting points for instrumentation and a reliable electrical pathway for the transmission of power from the surface to the seafloor and data from the seafloor to the buoy (Figure above).
Components comprising the buoy-to-riser interface include a universal joint, an electro-mechanical (EM) chain, and a Near Surface Instrument Frame (NSIF). The universal joint, at the buoy base, reduces the translation of buoy pitch and roll motion into bending moments at the top of the mooring riser. The EM chain, a conventional chain wrapped with helically-wound conductors and encapsulated in urethane, provides a flexible strength member between the buoy and the NSIF. The NSIF provides a mounting point for instruments and a mechanical transition from the EM chain to the EM cable.
Components along the mooring riser include the EM cable, EM stretch hoses, and distributed buoyancy elements between stretch hoses. The EM cable employs a wire rope strength member mechanically terminated with a swaged fitting. A molded urethane strain relief boot at the upper end of the cable interfaces with the NSIF bellmouth. The lower termination assembly provides strain relief and a cavity for integration of underwater connectors. The EM stretch hoses were initially developed in the 1990s by WHOI engineer Walter Paul. A novel, multi-layer construction technique was developed for OOI to enable a 24-conductor stretch hose. Hose lengths from 9 to 30 m are employed on OOI moorings. Each hose has a breaking strength of over 10,000 lb and stretches to over twice its original length to provide variable mooring scope and reduction of peak dynamic loads.
At the buoy base is an integrated anchor and instrument frame assembly called the Mult-Function Node (MFN). The MFN frame is a buoyant structure made of air-filled aluminum pipe, configured to allow the mounting of instruments, data loggers and batteries. The MFN is weighted to the seafloor with an anchor assembly that sits in the center of the frame, connected with dual acoustic releases. The anchor assembly consists of a flat-plate anchor below a foam buoyancy element that contains an internal spool with several hundred meters of synthetic line. The buoyancy element is connected to the anchor with dual acoustic releases. This system allows for mooring and anchor recovery in three stages: First, the MFN is separated from the anchor and the mooring riser is recovered. Next, the buoyancy element is released from the anchor allowing it to rise to the surface while offspooling line. Finally, the anchor is hauled using the synthetic line.
This unique combination of design elements creates a mooring system capable of housing and powering complex instrument systems, transmitting data in near real-time, and contributing to the long-term reliability of the OOI Coastal Surface Moorings in the challenging environment of the continental shelf.
Peters, D.B, J.N. Kemp and A.J. Plueddemann (2022). Coastal Surface Mooring Developments for the Ocean Observatories Initiative (OOI). Marine Technol. Soc. J., 56(6), 70-74. doi.org/10.4031/MTSJ.56.6.2.
Read MoreImproving Reliability and Availability of Dissolved Oxygen Glider Data
OOI’s Coastal Endurance Array Team is making great strides in ensuring the accuracy of glider dissolved oxygen measurements and making these data readily available to researchers. The team has compared glider oxygen data with independent transects and climatologies compiled by west coast colleagues. They are increasing the number of in situ comparisons of glider oxygen data with bottle samples taken in proximity to the gliders. They have built a benchtop system to do two-point calibrations for oxygen sensors to help ensure their accuracy when the gliders are in the water. And, working with OOI colleagues at WHOI, the team is helping to design and test improved sensor mounts to perform in situ air calibrations of glider oxygen measurements.
“A couple of years ago, Endurance Glider Lead Stuart Pearce developed code to put all of the oxygen data collected by our glider fleet into the DAC, the national central database for glider data,” said Ed Dever, Principal Investigator of the Coastal Endurance Array and Professor at Oregon State University. “Prior to doing this, Stuart examined the data and metadata for any gross errors and issues. That was the first of many steps we have taken to ensure OOI oxygen data are reliable and available so they can be trusted and used by researchers. Our effort is paying off. The glider data available on the DAC are identical to that now available on OOI’s Data Explorer. Endurance glider lines off Newport, OR and Grays Harbor, WA will be the backbone for the northern Californian Current part of the nascent Boundary Ocean Observing Network. The OOI glider lines map seasonal development of hypoxic areas off Oregon and Washington from the coast to the edge of the continental shelf.”
[media-caption path="/wp-content/uploads/2022/11/glider.png" link="#"]More than 137 glider missions have occurred along the Newport and Grays Harbor lines since 2014. Credit: Coastal Endurance Array at OSU.[/media-caption]
Collaborations
Enough oxygen data has been collected and shared in the northeast Pacific that is now possible to make high resolution regional climatologies of temperature, salinity and oxygen. Risien et al. (2022) compiled ~20 years of data taken by Jennifer Fisher (NOAA) and many others, to develop analysis ready transects of water property data off Newport, Oregon. These datasets include both climatologies and individual interpolated, quality-controlled, transect data. The Endurance Team compared glider dissolved oxygen with shipboard CTD samples collected by Fisher along the Newport transect in July 2021. Oxygen measurements from the gliders and CTDs samples compared well and provided confidence that glider and shipboard transects can map hypoxic conditions at comparable resolution and accuracy. Added Dever, “We were able to do a side-by-side comparison of the temperature, salinity, and oxygen data collected by the gliders over our Newport hydrographic line with the CTD data sampled by the Fisher’s team using the R/V Elakha. The comparison was quite good and served to validate the quality of the glider data that are an integral part of the Endurance Array.”
Engineering Solutions
A couple years ago, team member Jonathan Whitefield worked with Scripps Institution for Oceanography to build an oxygen Winkler titration rig so the team can titrate its own oxygen samples. The system can be used both in the lab and onboard to validate glider and moored oxygen data. The titration rig has been used to increase the number bottle samples taken during glider deployments and recoveries and to reduce the time between sample acquisition and analysis.
Building on this, Whitefield and others recently assembled in-house two-point calibration baths for pre- and post deployment of oxygen data collected by gliders and moorings. Calibrations are performed at anoxic and near-saturated conditions. The two-point calibration system is based on a similar one used at Scripps Institution for Oceanography (López-García, P., et al., 2022). A sodium sulfite solution is injected into bottle samples to get the low endpoint oxygen calibration point. The high endpoint oxygen calibration point is achieved using a stirred bath at 10°C to get to near saturation. The high endpoint oxygen is measured with replicate Winkler titrations. The calibration baths better ensure accuracy by making it possible to perform routine in-house checks of vendor calibrations on glider and moored sensors as well as identify calibration drift after deployment.
What’s ahead
Oxygen data are reviewed weekly by operators and annotated. Real-time automated quality control using QARTOD tests is in development. In-situ air calibration tests of oxygen optodes are planned for spring 2023. At the suggestion of outside investigators, OOI’s Coastal and Global Scale Node team at Woods Hole Oceanographic Institution modified Slocum glider optode mounts to allow in-situ air calibrations of dissolved oxygen on the Irminger Sea and Pioneer Arrays. The mount, however, affected the flow around gliders with radome fins and caused navigation problems. Modeling done at WHOI showed these problems may be due to vortices of the optode on the starboard side of the fin. The Endurance gliders will test a new mount placement during its upcoming bi-annual operations and maintenance cruise in March of 2023.
“We’re part of the community of practice for glider oxygen calibration and validation,” said Dever. “We engage with colleagues, adopt standard practices and widely share data. This community of users will help all of us get a better handle on ongoing changes in our ocean regions.”
References
Risien et al. (2022) Spatially gridded cross-shelf hydrographic sections and monthly climatologies from shipboard survey data collected along the Newport Hydrographic Line, 1997–2021, https://doi.org/10.1016/j.dib.2022.107922
López-García, et al. (2022) Ocean Gliders Oxygen SOP, Version 1.0.0. Ocean Gliders, 55pp. DOI: http://dx.doi.org/10.25607/OBP-1756. (GitHub Repository, Ocean Gliders Oxygen SOP.
Read More
OOI Launches QARTOD
WHAT IS QARTOD?
As part of the ongoing OOI effort to improve data quality, OOI is implementing the Quality Assurance of Real-Time Oceanographic Data (QARTOD) on an instrument-by-instrument basis. Led by the United States Integrated Ocean Observing System (U.S. IOOS), the QARTOD effort draws on the broad oceanographic observing community to provide manuals for different instrument classes (e.g. salinity, pH, or waves), which outline best practices and identify tests for evaluating data quality. A common code-base is available on GitHub and actively maintained by IOOS partner Axiom Data Science.
OOI has committed to implementing available QARTOD tests where appropriate. QARTOD is well-documented and actively maintained with an engaged user-base across multiple data collection and repository programs. It has a publicly available code-base with standardized tests and flag definitions that result in simplified, easy-to-interpret results. However, some instruments deployed by OOI, such as seismic sensors, hydrophones, and multispectral sensors, are not well-suited towards QARTOD. For instruments for which there is no existing QARTOD manual, such as seawater pCO2, OOI is implementing “QARTOD-like” quality control (QC).
HOW ARE QARTOD RESULTS COMMUNICATED?
QARTOD utilizes a standardized data-flagging scheme, where each data point for an evaluated variable (e.g. salinity) receives one of the following flags: 1 if the data point passed the test and is considered good; 2 if a test was not evaluated; 3 if the data point is either suspect or interesting/unusual; 4 if the data point fails the test; 9 if the data point is missing. Importantly, QARTOD only Flags data, it does not remove data. In fact, OOI is committed to delivering all available data, whether good or bad; the goal is to provide further information on the possible quality of the data. Furthermore, a flag of 3 does not necessarily mean a data point is bad – it could also mean something interesting or unusual occurred that resulted in the given data point being outside of the expected test threshold.
HOW IS QARTOD IMPLEMENTED BY OOI?
OOI is prioritizing implementation of QARTOD on instruments and variables which are shared across arrays and with broad or high scientific interest, such as CTDs, seawater pH and pCO2, dissolved oxygen, and chlorophyll/fluorescence. OOI is currently implementing the gross range and climatology tests (see this article for a more detailed description of the specific implementation). Note that the climatology test is a site-specific seasonally varying range test and not a World Ocean Atlas-like climatology. These two tests, in addition to other tests under development, utilize thresholds and ranges which are calculated from existing OOI datasets. The code used to calculate the thresholds is publicly available at the oceanobservatories ooi-data-explorations github repository and resulting threshold tables are available at the oceanobservatories qc-lookup github repository. The tests executed and results are added to the datasets as variables named _qartod_results and _qartod_executed, with the relevant tested data variable name prepended (e.g. practical_salinity would be practical_salinity_qartod_results and practical_salinity_qartod_executed). The _qartod_executed variable is a list of the individual results of each of the tests applied stored as a string. The tests applied and the order in which they were applied are stored in the variable metadata attributes. The _qartod_results provide a summary result of all the tests applied.
WHAT IS THE CURRENT OOI QARTOD STATUS?
The IOOS QARTOD manuals define the tests for each instrument class as “Required,” “Recommended,” and “Suggested”. The OOI priority will be the “Required” tests for each instrument class in use by OOI. “Recommended” and “Suggested” test development will be reviewed, with the support of subject matter experts, in the future. The IOOS QARTOD manuals can be found at Quality Assurance/Quality Control of Real Time Oceanographic Data – The U.S. Integrated Ocean Observing System (IOOS).
Current tests under development are gross range (GRT) and climatology (CT). The gap test (GT) will follow next. The syntax and location tests are considered operational checks and are handled within OOI operations and management systems. QARTOD test data will be available in specific locations where OOI supplies data, starting with M2M, and then propagated to THREDDS and Data Explorer. The current status of QARTOD test development and availability is shown in Table 1.
[media-caption path="/wp-content/uploads/2022/10/QARTOD-Table-1.png" link="#"]Table 1: Current Status of Development & Availability[/media-caption]
[media-caption path="/wp-content/uploads/2022/10/QARTOD-Figure-1.png" link="#"]Figure 1: QARTOD “Required” Test Development Timeline[/media-caption]
Read MoreCanadian and OOI Gliders Meet in Pacific
In an important collaborative undertaking, the Ocean Observatories Initiative (OOI) Glider 363 and a Fisheries and Oceans Canada (DFO) Glider crossed paths along Line P, a transect line in the northeast Pacific. This modern day “intersection” provides an opportunity for scientists to have co-located science profiles to match up with sensor data, but also an efficient way to extend data about ocean conditions along Line P throughout the year.
Line P consists of 27 stations extending from Vancouver Island to Ocean Weather Station Papa (OWSP), also known as “Station Papa.” OSWP (located at 50°N, 145°W) has one of the oldest oceanic time series records dating from 1949-1981. This 32-year-old record is supplemented by data collected by shipboard measurements along Line P conducted by DFO three times/year. The US National Oceanic and Atmospheric Administration also has a surface mooring at Station Papa, which contributes year-round data to this important record. Beginning in 2014, OOI also enhanced Station Papa with an array of subsurface moorings and glider measurements.
An important intersection
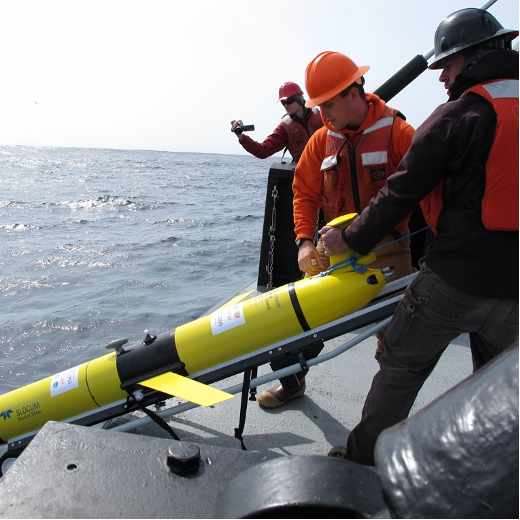
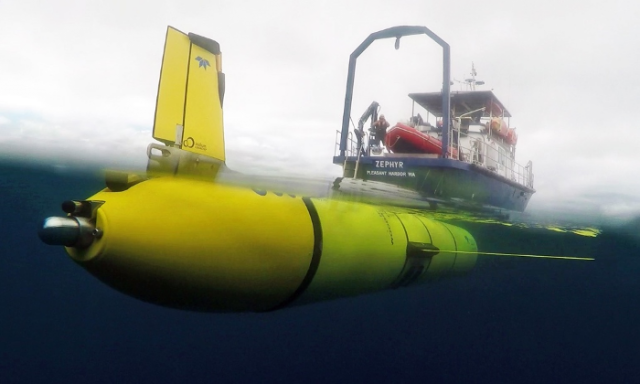
[media-caption path="/wp-content/uploads/2022/09/image012.png" link="#"]The OOI glider left from Newport, OR aboard the RV Zephyr and was deployed on July 3 in open ocean over the Juan de Fuca Ridge. The glider transited along Line P to the Papa Array starting from station P16. A DFO glider was traversing Line P at the same time, providing an opportunity for US and Canadian scientists to have co-located profiles to match up with sensor data. [/media-caption]The DFO glider was deployed in late May returning from OWSP. The OOI glider left from Newport, OR aboard the RV Zephyr and was deployed on July 3 at 46 N 130W in open ocean over the Juan de Fuca Ridge. The glider transited along Line P to OOI’s Global Station Papa Array starting from station P16, which is in international waters just outside the Canadian EEZ. A DFO glider was traversing Line P at the same time, providing an opportunity for US and Canadian scientists to have co-located profiles to match up with sensor data.
At the point of the cross-over the OOI glider had been at sea for about 40 days. Both OOI’s and DFO’s glider have very similar sensors onboard that measure temperature, salinity, pressure, oxygen, optical backscatter, chlorophyll, and colored dissolved organic matter. These measurements when compared to historical data provide insight into existing and possibly changing conditions in the water column.
“At a very basic level these deep-ocean rendezvous provide us with an opportunity to compare the sensor data mid-deployment, instead of just at the start or end of their respective deployments. This can help us look for any trends or offsets that might indicate sensor issues – such as aging, fouling, and other issues that may impede performance. This information helps people understand and be able to use data from these gliders,” explained Peter J. Brickley, OOI’s Glider Lead. “The other outcome is that our joint glider data can contribute extra sampling along Line P. While there are several cruises along this line every year, those efforts are spaced far apart in time (sometimes several months). Autonomous gliders can fill some of the gaps, are relatively inexpensive to operate, and can help better delineate conditions, including changing anomalies as they occur.”
Another contributing factor to making this initial glider cross-over a useful test case is that a scheduled DFO Line P cruise on the Canadian Coast Guard Ship John P. Tully was happening concurrently along Line P. The team aboard the Tully started sampling in early August and are scheduled to complete sampling by the month’s end. The ship collected some data in the vicinity of both gliders, offering another opportunity to compare and contrast data.
[media-caption path="/wp-content/uploads/2022/09/zephyr2.png" link="#"]The OOI glider deployed from the R/V Zephyr heading north to reach Line P in time to cross-over with DFO’s glider to share and contrast data collected. Credit: R/V Zephyr ©WHOI. [/media-caption]While the glider cross-over is an important first, it is emblematic of the ongoing cooperative effort between the Canadian DFO, NOAA, and OOI teams sampling in this important region. Communications occur regularly between OOI team members and the Chief Scientist conducting DFO shipboard sampling, as well as between OOI and NOAA personnel.
Added Brickley, “This recent excursion along Line P was planned, but also a serendipitous opportunity that could be leveraged quickly. Once we all have the chance to assess the data provided, we’ll be in a better position to explore making this a more regular occurrence. If it turns out that our sampling schemes are easily aligned, that could be another step to help advance understanding of ocean processes from coastal, eutrophic waters into the heart of the high nitrate, low chlorophyll area of the NE Pacific.”
Read More
Scientists and Fishers Learning from One Another

At a recent meeting of the Cape Cod Commercial Fishermen’s Alliance, it was evident how much can be learned when scientists and fishers share information. An example was the shifting location of the Gulf Stream. Fred Mattera, President of Commercial Fisheries Research Foundation of Rhode Island, wondered why the temperature of the continental shelf was 72 degrees in December. He contacted Glen Gawarkiewicz, a Woods Hole Oceanographic Institution senior scientist, to share his observation. Gawarkiewicz used data from OOI’s Coastal Pioneer Array to confirm that the Gulf Stream, which carries warm and salty water, had shifted 120 miles north. Gawarkiewicz explained to the audience that he would have never identified this change if it hadn’t been for Mattera’s contact.
This is but one example of how those who use the ocean and those who study it can benefit by sharing information. To read more:
Read More