
Program Updates
OOI Pioneer Array to Relocate to MAB
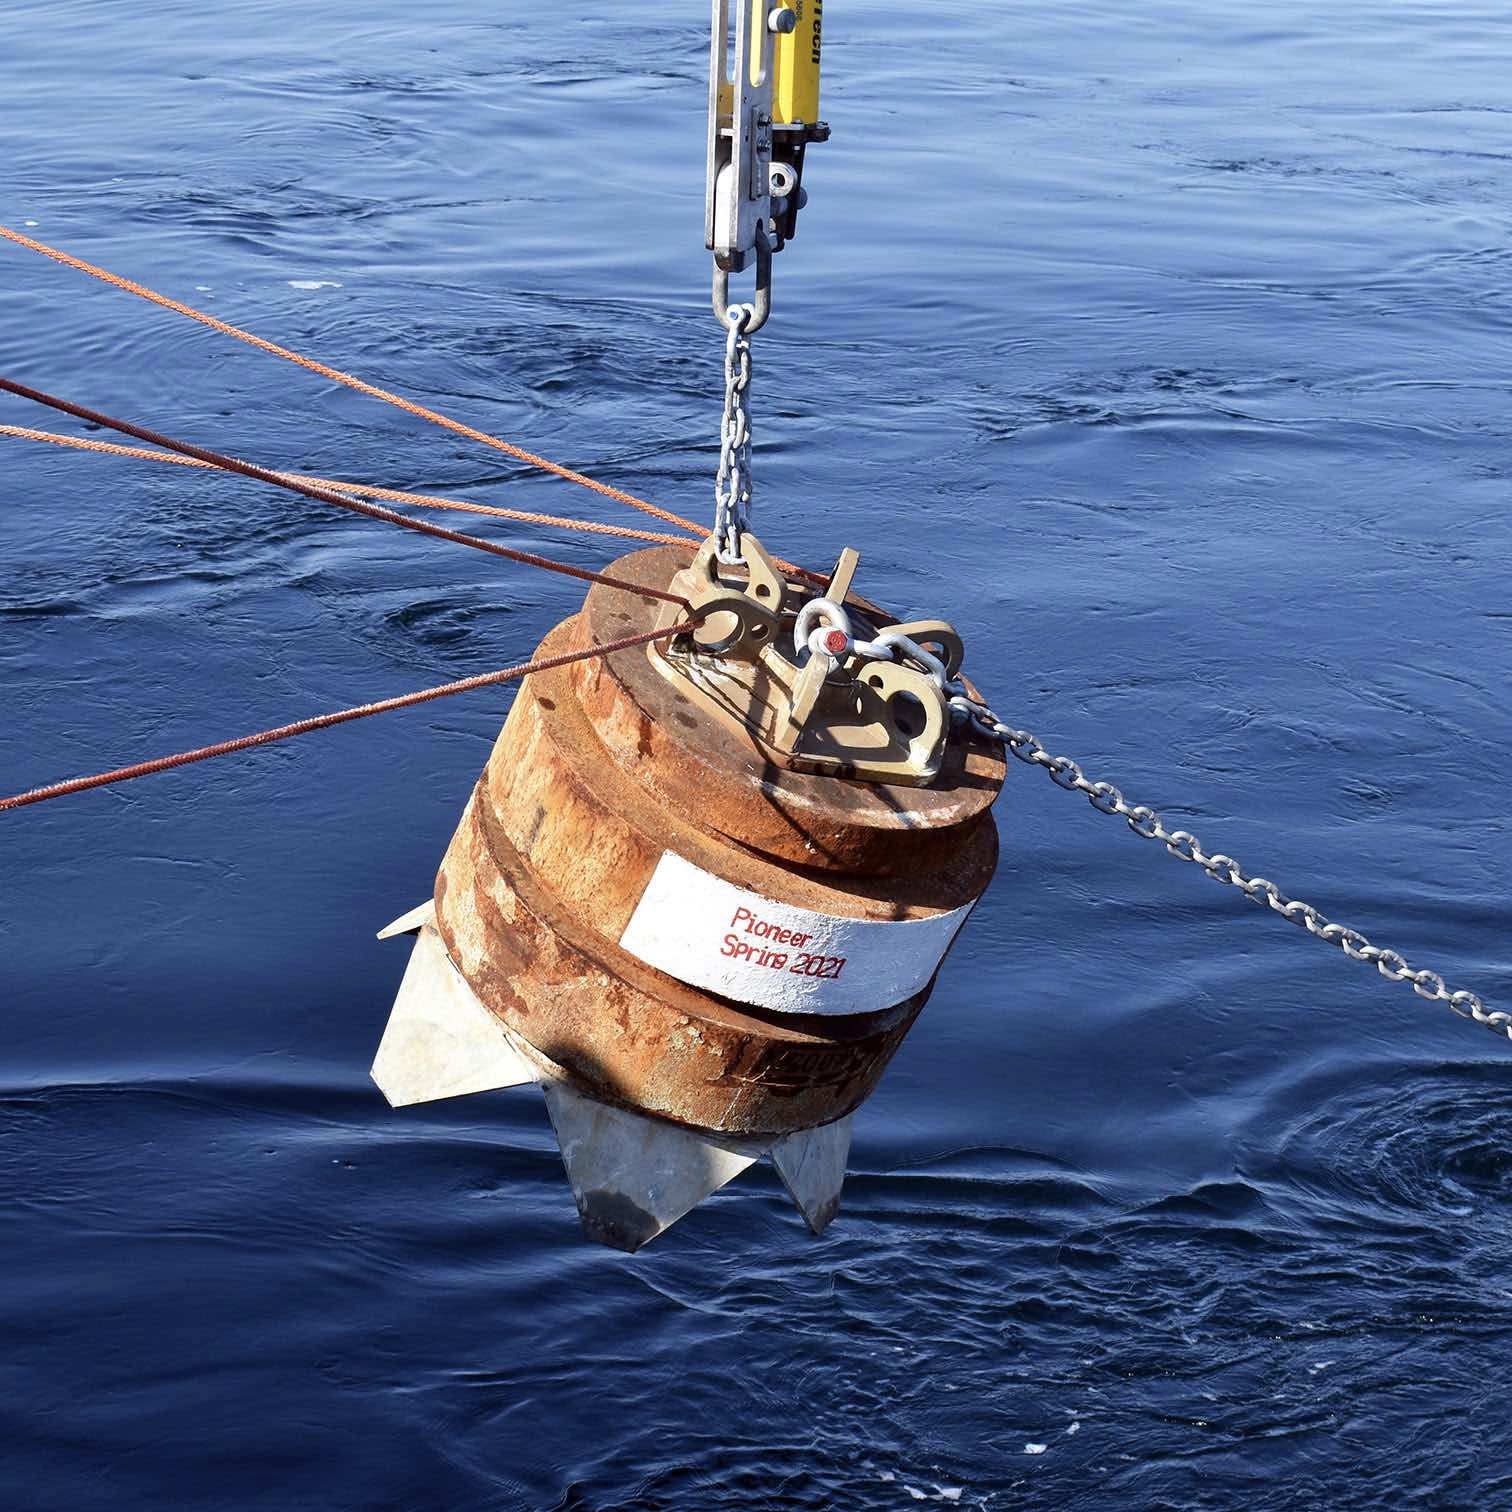
It’s official, the next location of the OOI (Ocean Observatories Initiative) Coastal Pioneer Array is the Mid-Atlantic Bight (MAB) and the move will take place in 2024. The geographic footprint championed during the NSF-sponsored Innovations Lab #1 is the region of the MAB between Cape Hatteras and Norfolk Canyon. This region offers opportunities to collect data on a wide variety of cross-disciplinary science topics including cross-shelf exchange, land-sea interactions associated with large estuarine systems, a highly productive ecosystem with major fisheries, and carbon cycle processes. This location also offers opportunities to improve our understanding of hurricane development, tracking and prediction, and offshore wind partnerships.
As background, the OOI has been in full operations since 2016. The OOI Pioneer Array was designed to be relocatable, and in 2020 the Ocean Observatories Initiative Facilities Board (OOIFB) and the National Science Foundation (NSF) launched a process to select the next OOI Pioneer Array location. A Phase 1 Innovations Lab was held in March 2021 to explore possible locations based on scientific questions of interest. The inputs received helped NSF make its decision to select the MAB.
A second (Phase 2) Innovations Lab is scheduled for the week of June 21-25. During this Lab, participants will work to further identify and refine the opportunities afforded by the new Pioneer Array location. Selected participants will be exploring how the Pioneer Array sensors and platforms can be optimized to achieve science and education goals at the new site, based on environmental, logistical, and infrastructural considerations. Partnership and collaboration potentials at the new location will also be discussed. The OOIFB, in partnership with Know Innovations, will again be facilitating the second Innovation Lab.
There is also an open to all Microlab scheduled for May 12th if you are intrigued and want to learn more: (https://ooifb.org/meetings/pioneer-array-phase2/).
The ocean community is invited to help identify new design considerations that can enable exciting research endeavors at the chosen location. Scientists, educators, and other stakeholders are encouraged to apply for the Phase 2 Innovations Lab. Please visit the OOIFB website for more information.
Read More
OOI Branded Apparel Available to Order
Interested in showing your affiliation with OOI? Now you have an option for purchasing a wide array of OOI Branded merchandise. From tee-shirts to polos to dress-for-success Zoom shirts, we have it all!
Woods Hole Oceanographic Institution’s Gift Shop has graciously offered to help provide OOI apparel to all those who might want to purchase it. You can view the array of products here: OOI Branded Apparel.
Download and complete an order form so we can get your new merchandise on its way. If you are interested in ordering something, please place your order by March 31st.
If you have any questions, please reach out to Darlene Trew Crist.
Read More
OOI’s AGU Virtual Booth and Sessions Schedule 2020
OOI’s Virtual Booth
The Ocean Observatories Initiative has a full plate of activities at its virtual AGU booth during AGU’s exhibit hall hours. Registration is required for the 11 am-noon time slots, indicated below.
Friday 11 December
- 11 am-noon Eastern: Learn how to create data views using the new Date Explorer: Register here.
OOI Data Team and Coastal Endurance team member Craig Risien will guide us through the steps of creating a data view using Coastal Endurance array data to demonstrate this feature of OOI’s new data discovery tool, Data Explorer.
- 1-1:30 pm Eastern: Ask an expert about what scientists are learning using OOI data. Join here.
Join William Wilcock, University of Washington, and Hilary Palevsky, Boston College, to hear what they have learned using OOI data and how you might do the same.
- 6-7 pm Eastern: Early Career Scientists’ Happy Hour. Join here.
Close down the OOI virtual booth by joining your friends and colleagues at a virtual hour. This is an opportunity to network, reconnect with friends and colleagues, and raise a glass together.
All activities other than the 11 am time slots and Friday’s happy hour can be accessed here. Look forward to seeing you soon!
___________________________________________________________________________________________
OOI-Related Sessions
Friday, 11 December 2020
07:00 – 23:59
Posters
B060-0022 Western boundary current instability gives rise to extraordinary subsurface diatom blooms in the Middle Atlantic Bight slope sea
Hilde Oliver1, Weifeng Gordon Zhang1, Walker O Smith Jr2, Philip Alatalo3, Dreux Chappell4, Andrew Hirzel1, Gwyneth Packard5, Corday Selden6, Judson Poole1, Heidi M Sosik1, Rachel Stanley7, Yifan Zhu4 and Dennis Joseph McGillicuddy Jr8, (1)Woods Hole Oceanographic Institution, Woods Hole, MA, United States, (2)Virginia Inst Marine Sciences, Gloucester Point, VA, United States, (3)Woods Hole Oceaonographic Institution, Woods Hole, MA, United States, (4)Old Dominion University, Ocean, Earth and Atmospheric Sciences, Norfolk, VA, United States, (5)Woods Hole Oceanographic Institution, Woods Hole, United States, (6)Cuernavaca, Mexico, (7)Wellesley College, Wellesley, MA, United States, (8)Woods Hole Oeanographic Institution, Woods Hole, MA, United States
Monday, 14 December 2020
07:00 – 23:59
Posters
OS037-0009 Sustained Ocean Observatories Initiative Glider Measurements Over the Oregon and Washington Shelves
Stuart Pearce, Oregon State University, College of Earth, Ocean, and Atmospheric Sciences, Corvallis, OR, United States, Jonathan Whitefield, Oregon State University, College of Earth Ocean and Atmospheric Sciences, Corvallis, OR, United States and Edward Paul Dever, Oregon State University, Corvallis, OR, United States
A151-0011 On the Impact of High-Frequency Wind Variability on Upper Ocean Stratification
Natalie M Freeman, University of Colorado at Boulder, Department of Atmospheric and Oceanic Sciences, Boulder, CO, United States, Donata Giglio, University of Colorado Boulder, Department of Atmospheric and Oceanic Sciences, Boulder, CO, United States, Sarah T Gille, UCSD, La Jolla, CA, United States and Momme Claus Hell, University of California San Diego, Scripps Institution of Oceanography, La Jolla, CA, United States
ED037-0031 What drives variability in nitrate concentration off the Oregon Coast?
Bailey Armos, University of Washington, Oceanography, Seattle, WA, United States and Edward Paul Dever, Oregon State University, Corvallis, OR, United States
ED037-0035 Ocean pCO2 Variability and Drivers at the US Atlantic Coastal Pioneer Array
Alison Thorson, Sarah Lawrence College, Bronxville, NY, United States and Rachel Eveleth, Oberlin College, Oberlin, United States
OS036-0005 Dissolved Oxygen Over The Oregon And Washington Shelves Observed From Sustained Glider, Profiler, And Fixed Depth Time Series
Edward Paul Dever1, Jonathan P Fram2, Michael Vardaro3,4, Wendi Ruef5, Orest Eduard Kawka5, Jack A Barth6, Craig M Risien2, Christopher E Wingard2, Stuart Pearce2 and Jonathan Whitefield1, (1)Oregon State University, Corvallis, OR, United States, (2)Oregon State University, College of Earth, Ocean, and Atmospheric Sciences, Corvallis, OR, United States, (3)Rutgers University, Department of Marine and Coastal Sciences, NJ, United States, (4)University of Washington Seattle Campus, Oceanography, Seattle, WA, United States, (5)University of Washington, School of Oceanography, Seattle, WA, United States, (6)Oregon State University, Marine Studies Initiative, Corvallis, OR, United States
ED037-0044 Vertical Zooplankton Distribution on Continental Slope off Oregon Coast
Lydia Sgouros, Case Western Reserve University, Cleveland, OH, United States and Edward Paul Dever, Oregon State University, Corvallis, OR, United States
Wednesday 16, December 2020
07:00 – 23:59
Posters
V040-0016 Monitoring Hydrothermal Plumes at ASHES Vent Field, Axial Seamount through Quantitative Acoustic Imaging
Guangyu Xu, Applied Physics Laboratory University of Washington, Acoustics, Seattle, WA, United States, Karen G Bemis, Rutgers, The State University of New Jersey – New Brunswick, Marine and Coastal Sciences, New Brunswick, NJ, United States, Darrell Jackson, University of Washington Seattle Campus, Applied Physics Laboratory, Seattle, WA, United States and Anatoliy N. Ivakin, Applied Physics Laboratory University of Washington, Seattle, WA, United States
14:50 – 14:54
Virtual Talk
V043-06 Repeated Short-Term Deflation Events Observed During Long-Term Inflation at Axial Seamount
William W. Chadwick Jr1, Scott L Nooner2, William S D Wilcock3, Suzanne M Carbotte4, Audra Meaghan Sawyer5, Erik K Fredrickson3 and Jeff W Beeson1, (1)Oregon State University, CIMRS, Newport, OR, United States, (2)University of North Carolina at Wilmington, Dept of Earth and Ocean Sciences, Wilmington, NC, United States, (3)University of Washington, School of Oceanography, Seattle, WA, United States, (4)Lamont-Doherty Earth Obs, Palisades, NY, United States, (5)University of North Carolina at Wilmington, Wilmington, NC, United States
Read More
OOI at AGU 2020
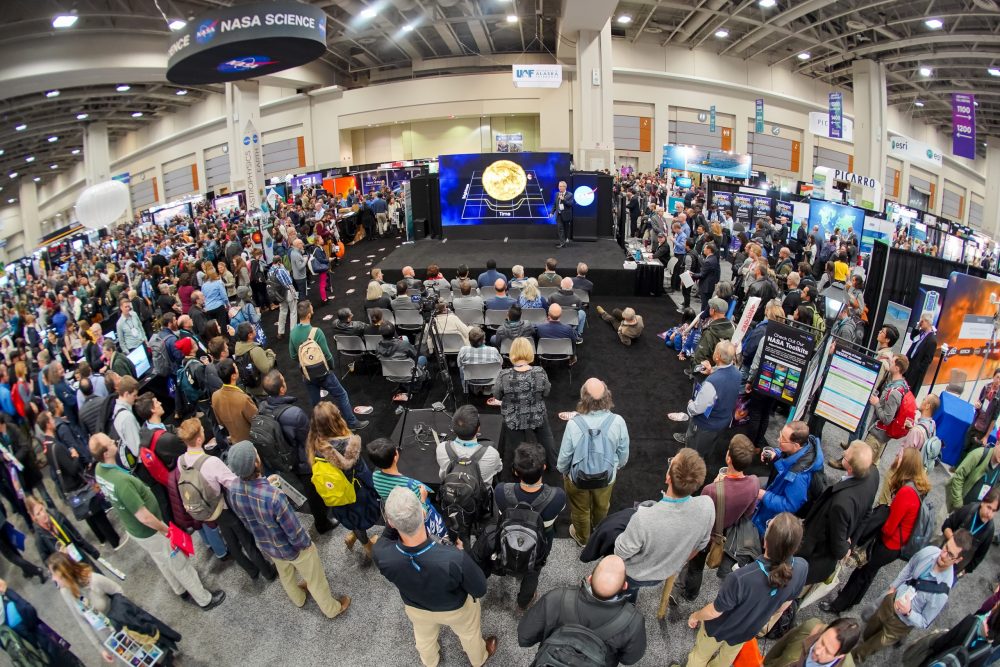
[media-caption path="/wp-content/uploads/2020/10/agufront2-scaled-e1603490292321.jpeg" link="#"]The AGU 2020 Fall Meeting will not be like the 2019 pictured here, but OOI will still have a large presence. [/media-caption]
OOI will be a force at the first online AGU Fall meeting. Join your colleagues as they present their latest scientific findings made possible using OOI data. OOI will also be hosting a virtual booth at AGU this year. Like the meeting of the past, it will provide a place to gather, share experiences, and learn more about OOI.
We have a robust schedule of activities at the OOI exhibit booth (each day at 11 am, 1 pm, and 6 pm) during the week of 7 December. Have a look here. Pre-registration is needed for the 11 am time slots, but all others are accessible with a click of a link. Hope to see you there!
If we’ve missed any OOI-related sessions, please contact dtrewcrist@whoi.edu and we will be happy to add them. Otherwise, see you all online. Hope you will share your stories at #AGU20OOI.
Monday, 7 December 2020
07:00 – 23:59
Posters
ED004-0045 Magnitude and Drivers of the Seasonal Cycle and Interannual Variability of pCO2 in the Washington Coast OOI Endurance Array
Brianna Velasco, Humboldt State University, Arcata, CA, United States, Rachel Eveleth, Oberlin College, Oberlin, United States and Alison Thorson, Sarah Lawrence College, Bronxville, NY, United States
Tuesday, 8 December 2020
10:00-11:00
Ocean Observatories Initiative Facility Board Town Hall
Wednesday, 9 December 2020
19:42 – 19:45
Virtual Talk
V018-14 Submarine Volcano-Hydrothermal Systems and Their Impacts on the Overlying Ocean: Quantification of Erupting Mid-Ocean Ridge Volcanoes- A Generational Goal
John R Delaney1, Dana Manalang2, Kendra L Daly3, Deborah S Kelley4, William S D Wilcock1, Edward T Baker5 and Douglas S Luther6, (1)University of Washington, School of Oceanography, Seattle, WA, United States, (2)University of Washington, Applied Physics Lab, Seattle, WA, United States, (3)University of South Florida, College of Marine Science, St. Petersburg, FL, United States, (4)University of Washington Seattle Campus, School of Oceanography, Seattle, WA, United States, (5)NOAA Pacific Marine Environmental Laboratory, Seattle, WA, United States, (6)Univ Hawaii Manoa, Honolulu, HI, United States
Friday, 11 December 2020
07:00 – 23:59
Posters
B060-0022 Western boundary current instability gives rise to extraordinary subsurface diatom blooms in the Middle Atlantic Bight slope sea
Hilde Oliver1, Weifeng Gordon Zhang1, Walker O Smith Jr2, Philip Alatalo3, Dreux Chappell4, Andrew Hirzel1, Gwyneth Packard5, Corday Selden6, Judson Poole1, Heidi M Sosik1, Rachel Stanley7, Yifan Zhu4 and Dennis Joseph McGillicuddy Jr8, (1)Woods Hole Oceanographic Institution, Woods Hole, MA, United States, (2)Virginia Inst Marine Sciences, Gloucester Point, VA, United States, (3)Woods Hole Oceaonographic Institution, Woods Hole, MA, United States, (4)Old Dominion University, Ocean, Earth and Atmospheric Sciences, Norfolk, VA, United States, (5)Woods Hole Oceanographic Institution, Woods Hole, United States, (6)Cuernavaca, Mexico, (7)Wellesley College, Wellesley, MA, United States, (8)Woods Hole Oeanographic Institution, Woods Hole, MA, United States
Monday, 14 December 2020
07:00 – 23:59
Posters
OS037-0009 Sustained Ocean Observatories Initiative Glider Measurements Over the Oregon and Washington Shelves
Stuart Pearce, Oregon State University, College of Earth, Ocean, and Atmospheric Sciences, Corvallis, OR, United States, Jonathan Whitefield, Oregon State University, College of Earth Ocean and Atmospheric Sciences, Corvallis, OR, United States and Edward Paul Dever, Oregon State University, Corvallis, OR, United States
A151-0011 On the Impact of High-Frequency Wind Variability on Upper Ocean Stratification
Natalie M Freeman, University of Colorado at Boulder, Department of Atmospheric and Oceanic Sciences, Boulder, CO, United States, Donata Giglio, University of Colorado Boulder, Department of Atmospheric and Oceanic Sciences, Boulder, CO, United States, Sarah T Gille, UCSD, La Jolla, CA, United States and Momme Claus Hell, University of California San Diego, Scripps Institution of Oceanography, La Jolla, CA, United States
ED037-0031 What drives variability in nitrate concentration off the Oregon Coast?
Bailey Armos, University of Washington, Oceanography, Seattle, WA, United States and Edward Paul Dever, Oregon State University, Corvallis, OR, United States
ED037-0035 Ocean pCO2 Variability and Drivers at the US Atlantic Coastal Pioneer Array
Alison Thorson, Sarah Lawrence College, Bronxville, NY, United States and Rachel Eveleth, Oberlin College, Oberlin, United States
OS036-0005 Dissolved Oxygen Over The Oregon And Washington Shelves Observed From Sustained Glider, Profiler, And Fixed Depth Time Series
Edward Paul Dever1, Jonathan P Fram2, Michael Vardaro3,4, Wendi Ruef5, Orest Eduard Kawka5, Jack A Barth6, Craig M Risien2, Christopher E Wingard2, Stuart Pearce2 and Jonathan Whitefield1, (1)Oregon State University, Corvallis, OR, United States, (2)Oregon State University, College of Earth, Ocean, and Atmospheric Sciences, Corvallis, OR, United States, (3)Rutgers University, Department of Marine and Coastal Sciences, NJ, United States, (4)University of Washington Seattle Campus, Oceanography, Seattle, WA, United States, (5)University of Washington, School of Oceanography, Seattle, WA, United States, (6)Oregon State University, Marine Studies Initiative, Corvallis, OR, United States
ED037-0044 Vertical Zooplankton Distribution on Continental Slope off Oregon Coast
Lydia Sgouros, Case Western Reserve University, Cleveland, OH, United States and Edward Paul Dever, Oregon State University, Corvallis, OR, United States
Wednesday 16, December 2020
07:00 – 23:59
Posters
V040-0016 Monitoring Hydrothermal Plumes at ASHES Vent Field, Axial Seamount through Quantitative Acoustic Imaging
Guangyu Xu, Applied Physics Laboratory University of Washington, Acoustics, Seattle, WA, United States, Karen G Bemis, Rutgers, The State University of New Jersey – New Brunswick, Marine and Coastal Sciences, New Brunswick, NJ, United States, Darrell Jackson, University of Washington Seattle Campus, Applied Physics Laboratory, Seattle, WA, United States and Anatoliy N. Ivakin, Applied Physics Laboratory University of Washington, Seattle, WA, United States
14:50 – 14:54
Virtual Talk
V043-06 Repeated Short-Term Deflation Events Observed During Long-Term Inflation at Axial Seamount
William W. Chadwick Jr1, Scott L Nooner2, William S D Wilcock3, Suzanne M Carbotte4, Audra Meaghan Sawyer5, Erik K Fredrickson3 and Jeff W Beeson1, (1)Oregon State University, CIMRS, Newport, OR, United States, (2)University of North Carolina at Wilmington, Dept of Earth and Ocean Sciences, Wilmington, NC, United States, (3)University of Washington, School of Oceanography, Seattle, WA, United States, (4)Lamont-Doherty Earth Obs, Palisades, NY, United States, (5)University of North Carolina at Wilmington, Wilmington, NC, United States
Read More
OOI Links Up with U.S. National Committee for the Ocean Decade
[media-caption path="/wp-content/uploads/2020/11/ODUS-Announcements-02-OS.jpg" link="#"]Ocean Decade U.S. is seeking innovative, potentially transformational, ideas about ocean science research. Honor your creativity and submit an “Ocean Shot.” Deadline is 1 December.[/media-caption]
The Ocean Observatories Initiative (OOI) has signed on as partner with the UN Decade of Ocean Science for Sustainable Development, which is geared toward scientists, policy makers, managers, and service users working together to ensure that ocean science delivers greater benefits for the ocean ecosystem and for society. OOI is part of the Ocean Decade’s Ocean Science and Technology community, making its ocean data available to the world community.
To help advance the United States involvement in the UN Decade program, OOI has also joined forces as a nexus organization with the U.S. National Committee for the Ocean Decade (Ocean Decade U.S.). The goal is to ensure that the U.S. ocean science community is aware of and participating in activities related to the UN Decade of Ocean Science.
“OOI offers a wealth of ocean data that is being used to advance understanding of ocean processes,” said John Trowbridge, lead of OOI’s program office at Woods Hole Oceanographic Institution. “We think it is important to offer this valuable resource up to the world community, and by so doing, contribute to the advancement of a sustainable ocean that benefits all users.”
Two opportunities currently exist for members of the OOI community to get involved:
Share your transformative research ideas
The Ocean Decade U.S. is seeking transformative research ideas known as “Ocean-Shots,” that draw inspiration and expertise from multiple disciplines and fundamentally advance ocean science for sustainable development. The hope is that such innovative ideas will spark potentially disruptive advances in ocean science for sustainable development. Applications are due before December 1, 2020, so the time is now to gather your colleagues together and consider proposing some innovative research ideas. To learn more, click here or if you already have a great innovative idea, use a simple online form to submit your winning idea. Submitted “Ocean Shots” will be presented at the Ocean Decade U.S. Kickoff meeting, January 13-14, 2021.
Early Career Scientist Candidates Sought
Knowing that the fate of the global ocean rests with future generations, the US National Committee for the Ocean Decade is also seeking to include early career perspectives in the activities of the Committee. Early career natural scientists, social scientists, engineers, resource managers, and policy specialists are encouraged to apply as liaisons to the Committee. Again, the application deadline is December 1, 2020. If you are looking to have a voice in what the ocean may look like in the future and how it is used, consider applying today.
Adds Trowbridge, “There is no better time than now to consider the future ocean and how it might can be sustainably used now so its many wonders and resources will be available to future generations.”
Read More
OOIFB Town Hall 8 Dec, Includes Lightning Talks

The Ocean Observatories Initiative Facilities Board (OOIFB) will host a Town Hall during the virtual 2020 Fall AGU meeting. The Town Hall is scheduled for Tuesday, December 8th from 10:00 am to 11:00 am EST. The community will have the opportunity to hear the latest information about the OOI facility, meet the OOIFB members, and learn about research using OOI data. The new OOI Data Explorer tool will be demonstrated, the exciting activities of OOI education programs will be featured, and early career scientist activities will be highlighted.
The Town Hall is aimed at researchers who are now using or are considering using OOI data, researchers interested in adding instrumentation to the OOI infrastructure, and educators at all levels interested in the OOI. Lightning talks will be presented during the Town Hall, as well as at OOI’s virtual booth on Thursday 10 December from 6-7 pm. For those interested in the Thursday presentation, join the discussion here.
Event: OOI Facility Board Town Hall
When: Tuesday, December 8th from 10:00 am to 11:00 am EST (7:00 am to 8:00 am Pacific)
Additional Details: https://ooifb.org/meetings/2020-agu-meeting-ooifb-town-hall/
Town Hall Agenda
1000 Welcome, Introductions, Activity Update – Kendra Daly (USF), OOIFB Chair
1005 Updates from the National Science Foundation – Lisa Clough (NSF)
1015 Updates from the OOI Operator – John Trowbridge (WHOI)
1020 OOI Date Explorer Demo – Brian Stone (Axiom)
1025 OOI Education Data Labs Report – Janice McDonnell (Rutgers U)
1030 OOI Activities initiatives by Early Career Scientists – Sophie Clayton (ODU)
1035 Lightning Talk Presentations
1055 Questions, Answers, and Discussion
1100 End of Town Hall
Lightning Talk Presenters
Shima Abadi, University of Washington
Bill Chadwick Oregon State University
Bill Davis, BeachNecessities.com
Rachel Eveleth, Oberlin College
Erik Fredrickson, University of Washington, School of Oceanography
Natalie Freeman, University of Colorado Boulder
Matthew Lobo, Portland State University
Aaron Mau, University of South Carolina
Chris Russoniello, West Virginia University
William Wilcock, University of Washington
Guangyu Xu, Applied Physics Laboratory, University of Washington
Read More
Pioneer 15 Underway
[media-caption path="/wp-content/uploads/2020/11/IMG_0034-scaled.jpeg" link="#"]The Pioneer 15 Team departs aboard the R/V Neil Armstrong, framed by equipment that awaits deployment on leg two. [/media-caption]
On October 28th, ten scientists and engineers from Woods Hole Oceanographic Institution departed aboard the R/V Neil Armstrong headed to the Pioneer Array, about 75 nautical miles south of Martha’s Vineyard in the Atlantic Ocean. This trip is the 15th time that a team has traveled to the Pioneer Array to recover and deploy equipment at the site.
The team will recover and deploy three coastal surface moorings and a profiler mooring, and deploy two winter coastal profiler moorings. They will also conduct CTD (Conductivity, temperature, and depth) casts and water sampling at the deployment and recovery sites. In addition, the team will compare ship and buoy meteorological measurements at the surface mooring sites as a way to validate the mooring measurements.
“We’ve been isolating for 14 days, have successfully passed 2 COVID-19 tests, and are ready to go, “ said Sheri White, chief scientist for Pioneer 15. “This is a two-leg expedition because we can’t fit all of the moorings on the deck for one trip to the array. We plan to be in port on November 4th to swap out gear, but we can adjust our schedule accordingly. If bad weather picks up, we can head back to port early to collect the equipment for leg two and not lose valuable time at sea when we can’t work due to weather.” The ship is expected to return from leg two on 11 November.
The surface moorings being recovered have been deployed for one year – six months longer than intended, due to the COVID-19 pandemic – and so are starting to experience some wear and tear. The new moorings being deployed incorporate design updates intended to improve the robustness of components such as the wind turbines and stretch hoses. The team also will be deploying a prototype quad transducer for the ZPLSC instrument. The ZPLSC is a bio-acoustic sonar which measures acoustic signals of plankton and zooplankton at the OOI Coastal Arrays. It has transducers that emit at frequencies of 38, 125, 200 and 400 kHz (the latter three are all from a single quad-transducer). The new quad transducer design should lead to less failures and improved data collection for that instrument.
In addition to performing OOI tasks, the team will be conducting ancillary work to support the Northeast Shelf Long Term Ecological Research (NES-LTER) program. This will include CTD casts, and sampling from the ship’s underway seawater system with an Imaging FlowCytobot (IFCB) instrument.
The members of the scientific party include:
Sheri White, WHOI, Chief Scientist
Chris Basque, WHOI, Deck Lead
Jennifer Batryn, WHOI, Instrument Lead
Collin Dobson, WHOI, Surface Mooring Lead
Meghan Donohue, WHOI, Deck Ops
Eric Hutt, UNOLS, Deck Ops
John Lund, WHOI, Profiler Mooring Lead
Josh Mitchell, UNOLS, Deck Ops
Rebecca Travis, WHOI, Documentation Lead
Dave Wellwood, WHOI, Water Sampling
Read More
Partnerships Expand Use of OOI Data
The OOI’s primary mission is to make its data widely available to multiple users. One way it achieves this, on a broad scale, is by establishing partnerships with other organizations that also distribute ocean observing data. For example, OOI currently partners with the Integrated Ocean Observing System (IOOS), which provides integrated ocean information in near real-time and tools and forecasts to apply the data, the National Data Buoy Center (NDBC), which maintains a network of data collecting buoys and coastal stations as part of the National Weather Service, the Global Ocean Acidification Observing Network (GOA-ON), which uses international data to document the status and progress of ocean acidification, and Incorporated Research Institutions for Seismology (IRIS), a consortium of over 120 US universities dedicated to the operation of science facilities for the acquisition, management, and distribution of seismological data.
NANOOS: Making data relevant for decision-making
NANOOS, the Northwest Association of Networked Ocean Observing Systems, which is part of IOOS, has been operational since 2003, establishing trusting, collaborative relationships with those who use and collect ocean data in the Pacific Northwest. NANOOS has been an exemplary partner in ingesting and using OOI data. Part of its success lies in advance planning. NANOOS, for example, had determined that OOI assets, in addition to achieving the scientific goals for which they were designed, could fill a data void in IOOS assets running north and south in an area between La Push, WA, and the Columbia River, well before the OOI assets came online.
[media-caption type="image" class="external" path="https://oceanobservatories.org/wp-content/uploads/2020/09/Screen-Shot-2020-09-22-at-2.25.24-PM.png" alt="Endurance Array" link="#"]OOI’s Coastal Endurance Array provides data from the north and south in an important upwelling area in the northeastern Pacific. Gliders also traverse this region, with glider data available through both the IOOS Glider Data Assembly Center and the NANOOS Visualization System. Credit: Center for Environmental Visualization, University of Washington.[/media-caption]According to Jan Newton, NANOOS executive director at the University of Washington, “One of the reasons NANOOS is so effective is that our guiding principle is to be cooperative and not compete. If the public is looking for coastal data, for example, we want to make sure they can access it and use it, rather than having them trying to sort through whether it is a product of IOOS or OOI. We operate with the philosophy of maximizing the discoverability and service of the data and OOI has been a great partner in our mission. We’ve been really happy about how this partnership has played out.”
[media-caption type="image" class="external" path="https://oceanobservatories.org/wp-content/uploads/2020/09/Regional-Cable-Array-revised-.jpg" alt="Revised RCA" link="#"]OOI’s Regional Cabled Array also contributes data in the NANOOS region from its Slope Base and the Southern Hydrate Ridge nodes. Credit: Center for Environmental Visualization, University of Washington.[/media-caption]NANOOS has made a huge effort on its data visualization capabilities, so people can not only find data, but look at it in a relative way to use it for forecasting, modeling, and solving real-world problems. OOI data are integral in helping support some of these visualization and modeling efforts, which commonly play a role in situations facing a wide cross-section of society.
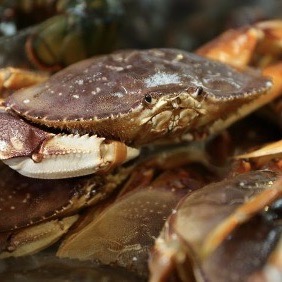
An example of this applicability played out in improved understanding of hypoxia (oxygen-deficient conditions) off the coast of Oregon, which had resulted in mass mortality events of hypoxia-intolerant species of invertebrates and fish, in particular, Dungeness crabs. Allowing access through NANOOS to near real-time oxygen data from OOI assets has allowed the managers and fishers to come up with some plausible solutions to maintaining this valuable resource. The Dungeness crab fishery is the most valuable single-species fishery on the U.S. West Coast, with landed values up to $250 million per year, and plays an enormous cultural role in the lives of tribal communities in the region, as well.
[media-caption type="image" class="external" path="https://oceanobservatories.org/wp-content/uploads/2020/09/Dungeness-Crab.jpg" alt="Dungeness Crab" link="#"]OOI oxygen data have helped resource managers and fishers maintain the valuable Dungeness crab fishery, which is the most valuable single-species fishery on the U.S. West Coast.[/media-caption]Researcher Samantha Siedlecki, University of Connecticut, reports that in late June of 2018, for example, fishers in the region were pulling up dead crabs in pots without knowing the cause. Scientists accessed near real-time OOI observations through the NANOOS data portal and found that the Washington Inshore Surface Mooring of the Coastal Endurance Array (EA) had measured hypoxia from June 7th onwards. So, the data confirmed real-life conditions and explained the crab mortalities.
This is important because such occurrences are helping to confirm models and enhance forecasting to better manage these events by providing guidance to fishers and resource managers. In this instance, the forecast indicates what regions will likely require reduced time for crabs to remain “soaking,” caged in the environment during hypoxia events, to ensure crabs are captured alive, and also aid in spatial management of the fishery itself. OOI data will play a role in continual improvements in forecasting in this region and the fishery by providing data during winter months, ensuring historical data are available and quality controlled for use in forecasting, and continuing to serve data in near real-time.
Adds Newton, “I can’t tell you how many OOI and other PIs come up and tell me how they love that their data are having a connection to real world problems and solutions. It makes their research go farther with greater impact by being part of this NANOOS network.”
Explains Craig Risien, Coastal Endurance Array senior technician at Oregon State University, “OOI is collecting an incredible wealth of data, offering a treasure chest of material to write papers, write proposals, include in posters, and now it is being used in practical ways for finding scientific solutions to environmental problems. Every time we look at the data, there’s a new story to tell. We always find something new, something interesting, and encourage everyone to have a look and experience the same usefulness and excitement about OOI data.”
Sharing OOI data
The OOI is in talks with the IOOS regions serving the Northeast Atlantic and the Mid-Atlantic to see how OOI data might enhance their networks, as well. The OOI also has been providing data to the National Data Buoy Center since 2016, supplementing the data collected by NDBC’s 90 buoys and 60 Coastal Marine Automated Network stations, which collectively provide critical data on unfolding weather conditions. And, the OOI has been providing data to Global Ocean Acidification Observing Network (GOA-ON), since mid-2019, ground-truthing on site conditions in real to near real-time, which is critical to understanding conditions contributing to ocean acidification and improving modeling capabilities to determine when it might occur. OOI’s Regional Cabled Array has been providing seismological, pressure and hydrophone data to Incorporated Research Institutions for Seismology (IRIS) since 2014, providing a wealth of data from Axial Seamount and on the Cascadia Margin. For example, on April 24, 2015 a seismic crisis initiated at the summit of Axial Seamount with >8,000 earthquakes occurring in 24 hrs, marking the start of the eruption. Starting at 08:01 that same day, the network recorded ~ 37,000 impulsive events delineating underwater explosions, many of which were associated with the formation of a 127 meter thick lava flow on the northern rift.
Data examples
If you would like to test drive some of the OOI data in NANOOS, NDBC, and GOA-ON, here are some examples below:
IOOS
· OOI data in the NANOOS Visualization System (NVS)
NDBC
· Coastal Endurance Array data (Stations 46097, 46098, 46099, 46100)
· Coastal Pioneer Array data (Stations 44075, 44076, 44077)
· Global Irminger Array data (Station 44078)
GOA-ON
· Coastal Endurance Array data
IRIS
· Regional Cabled Array (While searching within IRIS for OOI data, use the two-letter IRIS network designator “OO.”)
Read More
A Collaborative Month in the Irminger Sea
A team of 10 Woods Hole Oceanographic Institution scientists, who spent the month of August aboard the RV Neil Armstrong, arrived at home port in Woods Hole on 4 September, having successfully skirted Hurricane Laura as she headed in their direction. The bumpy ride home capped the successful deployment of all OOI Irminger Sea Array moorings in sometimes turbulent seas.
While onsite at the array, the team successfully met all of its mission objectives by recovering and deploying four moorings and deploying two gliders. One glider transits the individual moorings, which are spaced approximately 20 km apart, while the second glider samples the upper 200-meters of the ocean above the centrally located hybrid profiler mooring, which measures the remainder of the 2800-m water column. A third glider was recovered soon after deployment because it had a microleak. The team also conducted CTD casts at each of the moorings, which measure onsite temperature, salinity, and oxygen conditions and validate data being collected and sent to shore by the array.
“The Irminger Sea array presents both unique opportunities and challenges for reporting ocean data,“ explained Sebastien Bigorre, who served as chief scientist on the Irminger Seven expedition. “It is located in a remote area of the North Atlantic with high wind and large surface waves, which present operational challenges. The area is also of great interest for scientists and society because of the intense exchange of energy and gases between the atmosphere and the ocean. The ocean there captures heat and carbon dioxide from the atmosphere, thus it is an important component of the climate system. It is also a region of high biological productivity, making it an important fishery. Recent studies have shown that the data collected at the Irminger array are essential to correctly describe the ocean circulation of the North Atlantic.”
It is an eight-day transit from Woods Hole to the Irminger Sea Array and another eight-day transit to return to home port. To maximize the use of ship time, the Irminger Sea Array Team shared ship space and mission time with scientists from OSNAP (Overturning of the Subpolar North Atlantic Program). OSNAP is seeking to provide a continuous record of the horizontal transport of heat, mass, and freshwater in the subpolar North Atlantic, and is complemented by the much longer-term records of water-column properties and air-sea transfer of momentum, heat, and moisture that are provided by the OOI Irminger Sea Array. Once on site, the expedition started with deployment of OOI moorings and gliders, switched its focus to recovery and re-deployment of OSNAP moorings, before finishing with the recovery of the previous year OOI Irminger Sea moorings.
“Our partnership with OSNAP is an example of how we try to maximize our resources for scientific research, from cruise planning, to operations at sea. During transits, we test and triple check our equipment to ensure that comes deployment day, everything goes as smooth as possible. On site, we coordinate operations to accommodate for weather conditions or to optimize shared equipment or personnel. When there is a lull in scientific activities, we plan for the ship’s instrumentation to collect data that is relevant to our scientific objectives, so every hour of the cruise is used to its full potential,” added Bigorre.
The following images show the many tasks undertaken during the month-long expedition:
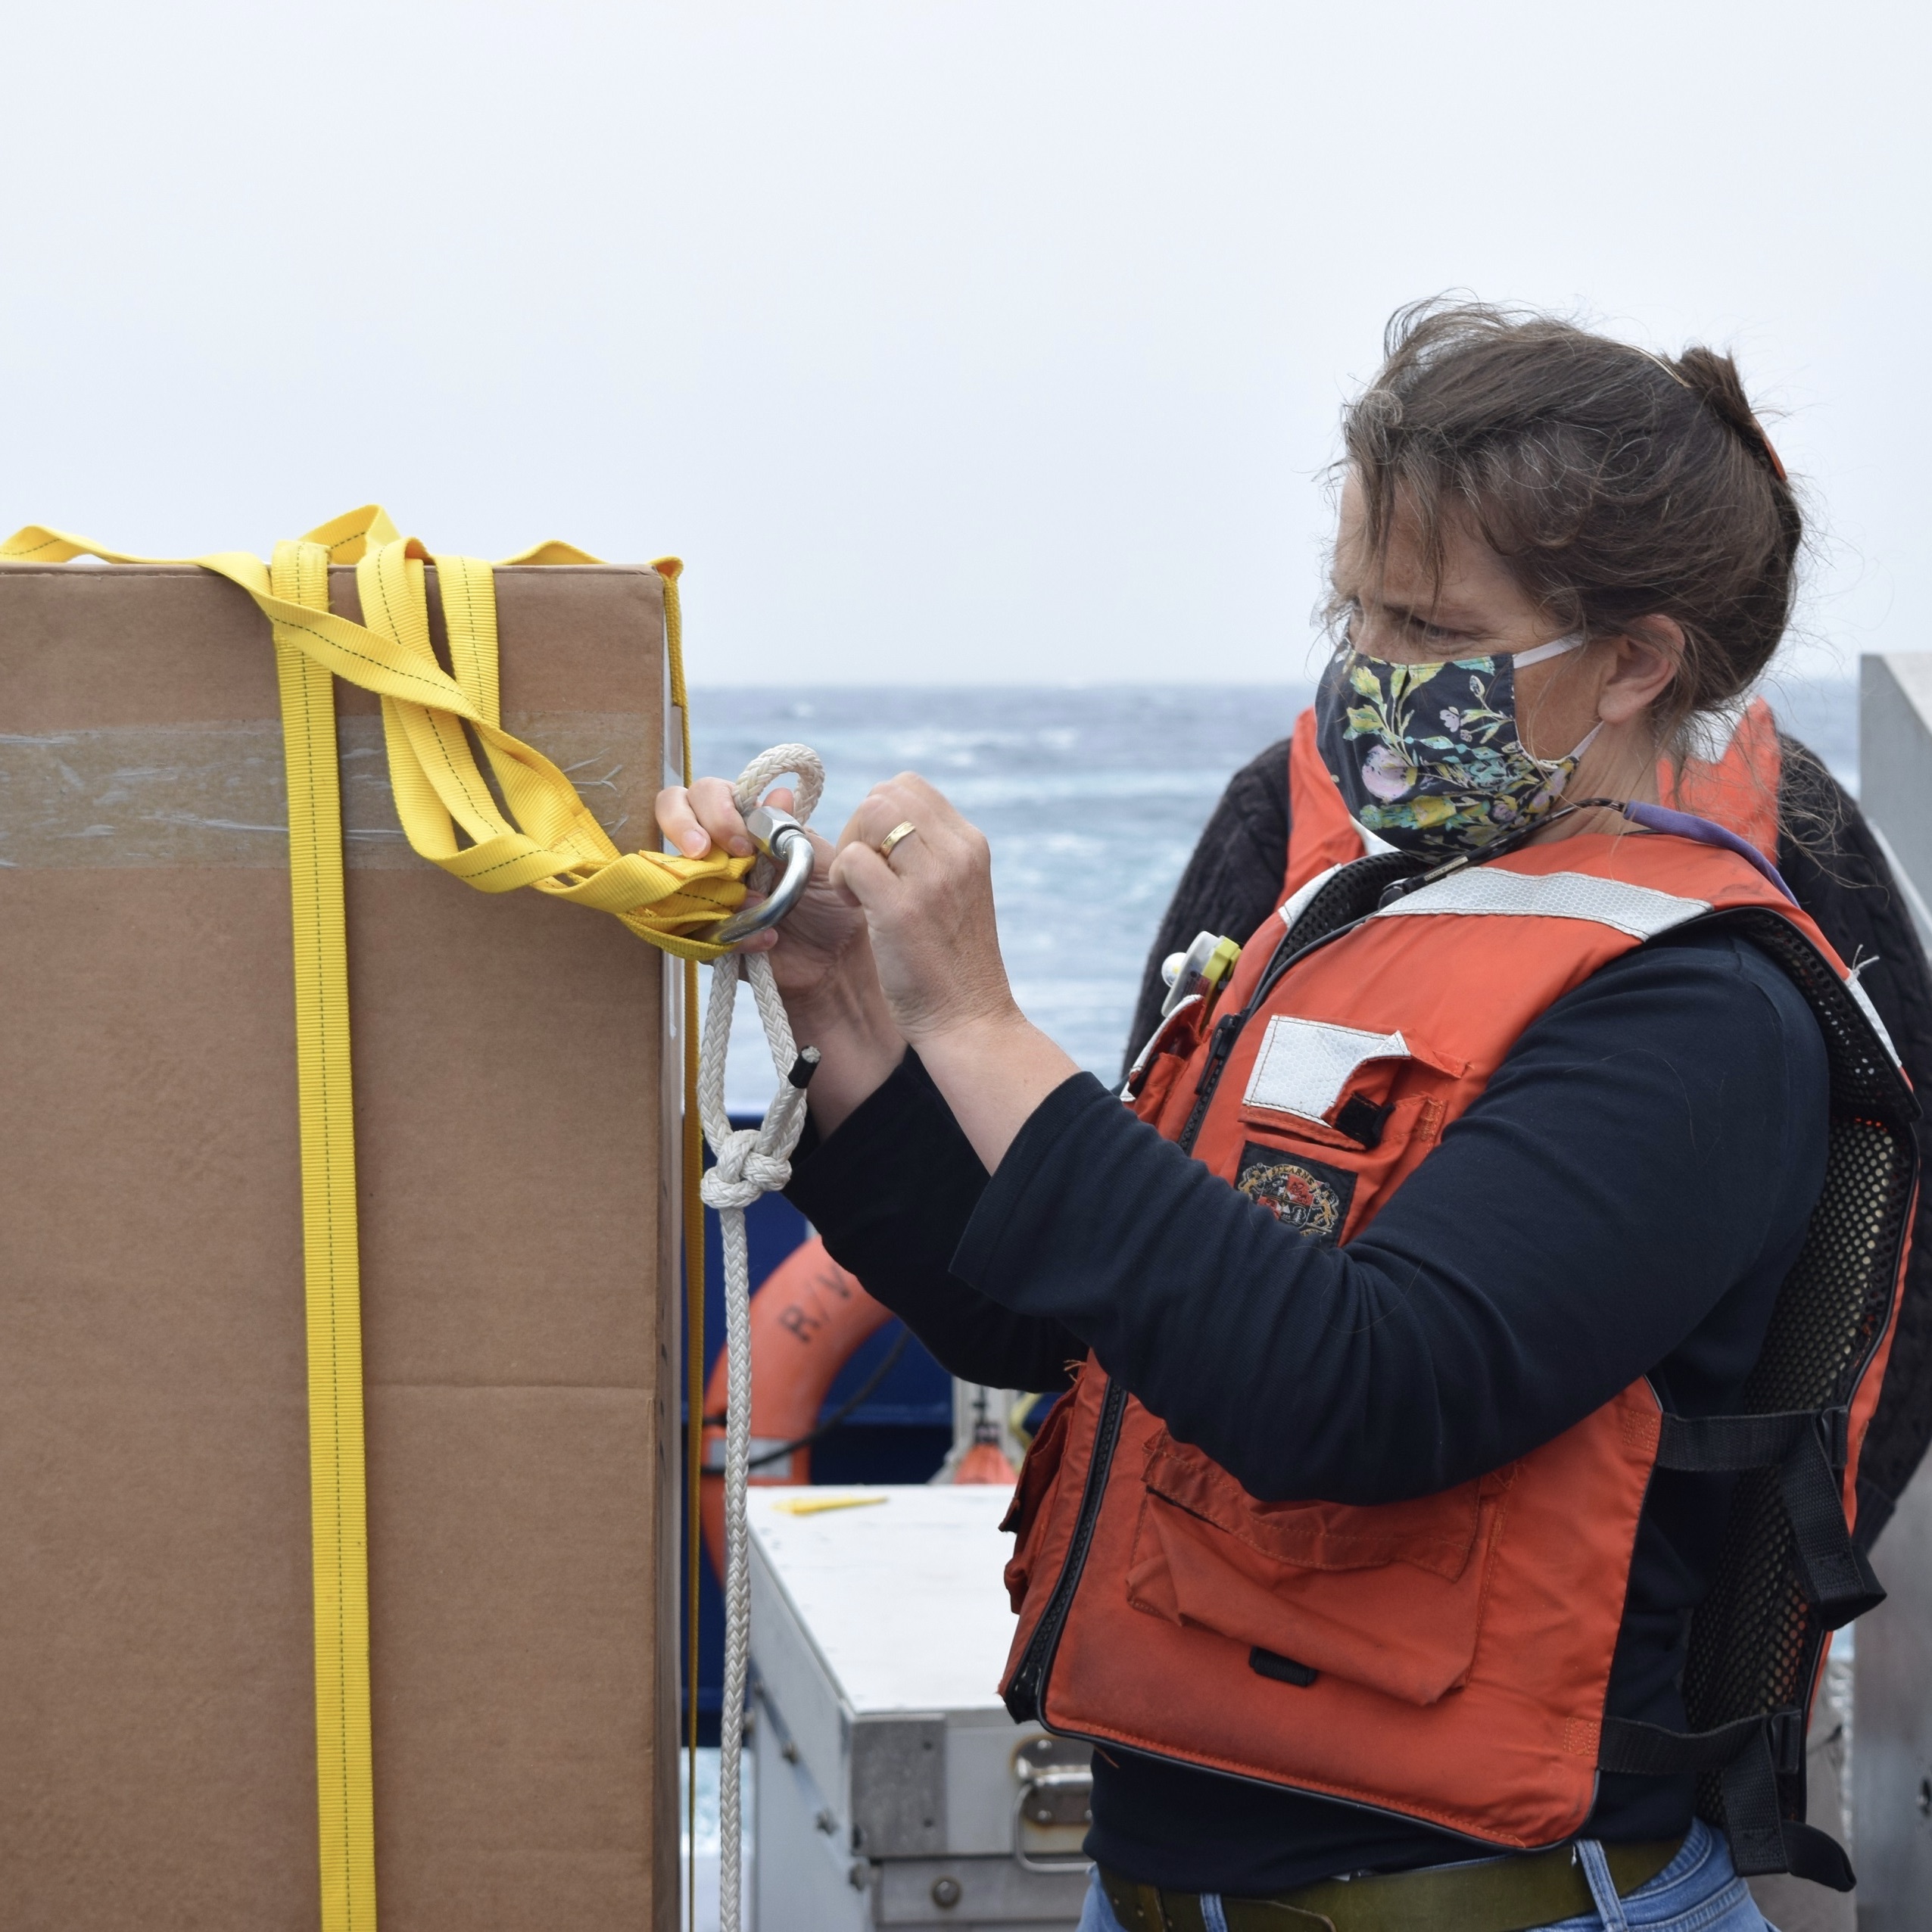
[media-caption type="image" class="external" path="https://oceanobservatories.org/wp-content/uploads/2020/09/IMG_4208-scaled.jpg" alt="Irminger 7 masks" link="#"]OOI Irminger Sea cruise participants James Kuo (foreground), Jennifer Batryn, and Collin Dobson demonstrate proper social distancing and PPE use on the deck of the R/V Neil Armstrong during departure from the Woods Hole Oceanographic Institution (WHOI) dock Sunday 9 August. Photo credit: Rebecca Travis©Woods Hole Oceanographic Institution.[/media-caption] [media-caption type="image" class="external" path="https://oceanobservatories.org/wp-content/uploads/2020/09/IMG_4215-scaled.jpg" alt="Armstrong awaiting departure" link="#"]The R/V Neil Armstrong is loaded with crew and equipment and ready to depart for the month-long expedition to the Irminger Sea Array. Photo credit: Rebecca Travis©Woods Hole Oceanographic Institution.[/media-caption] [media-caption type="image" class="external" path="https://oceanobservatories.org/wp-content/uploads/2020/09/Screen-Shot-2020-09-14-at-4.56.05-PM.png" alt="Drone overhead" link="#"]A place for everything, everything in its place. Aerial view of the R/V Neil Armstrong deck with equipment loaded for the OOI Irminger Sea Array service cruise. Photo credit: James Kuo©Woods Hole Oceanographic Institution.[/media-caption] [media-caption type="image" class="external" path="https://oceanobservatories.org/wp-content/uploads/2020/09/Glider-with-mask-scaled.jpg" alt="Glider with mask" link="#"]Even the gliders took precautions for the Irminger Sea Expedition! (The tape was removed before deployment). Photo credit: Diana Wickman©Woods Hole Oceanographic Institution .[/media-caption] [media-caption type="image" class="external" path="https://oceanobservatories.org/wp-content/uploads/2020/09/IMG_2081-scaled.jpg" alt="Off stern" link="#"]Global Surface Mooring loaded on the R/V Neil Armstrong deck. It replaced a mooring recovered at the site. Photo credit: James Kuo©Woods Hole Oceanographic Institution.[/media-caption] [media-caption type="image" class="external" path="https://oceanobservatories.org/wp-content/uploads/2020/09/IR7_Dobson_lab-scaled.jpg" alt="Collin in lab" link="#"]Engineer Collin Dobson performs function checks on OOI gliders in the lab of the R/V Neil Armstrong during the transit out to the OOI Irminger Sea array. Photo credit: Jennifer Batryn©Woods Hole Oceanographic Institution.[/media-caption] [media-caption type="image" class="external" path="https://oceanobservatories.org/wp-content/uploads/2020/09/IR7_glider_prep-scaled.jpg" alt="Glider prep" link="#"]Two OOI gliders sit in the lab of the R/V Neil Armstrong during the transit out to the Irminger Sea array. The location of the glider oxygen sensors (blue housings forward of the tail fin) was modified so the sensor is exposed to the air when the glider surfaces. Photo credit:Jennifer Batryn©Woods Hole Oceanographic Institution.[/media-caption] [media-caption type="image" class="external" path="https://oceanobservatories.org/wp-content/uploads/2020/09/20200817_101902.cam3_.jpg" alt="Buoy camera" link="#"]Eyes at sea. This image was captured during the Irminger Global Surface Mooring deployment 17 August 2020 by a camera on the buoy shortly after the buoy was lowered into the water. The camera normally helps operators monitor ice buildup and storm conditions, but on that day it turned its lens on the action aboard the R/V Neil Armstrong. Photo credit: Buoy camera©Woods Hole Oceanographic Institution.[/media-caption] [media-caption type="image" class="external" path="https://oceanobservatories.org/wp-content/uploads/2020/09/SUMOsplice_NicoLlanos_20200811.jpg" alt="Nico splicing" link="#"]Nico Llanos splices lines together, in preparation for the OOI Global Surface Mooring deployment. The surface mooring will be deployed in almost 3,000 m (1.8 mile) of water off of Greenland. Together, the nylon and Colmega add up to almost one mile of rope line, and provide the bottom part of the mooring above its anchor. Photo credit: Heather Furey©Woods Hole Oceanographic Institution .[/media-caption] [media-caption type="image" class="external" path="https://oceanobservatories.org/wp-content/uploads/2020/09/whiteboard_AR46_20200811-1-scaled.jpg" alt="Whiteboard" link="#"]Just like on land, a whiteboard serves as a notice of ongoing and completed activities aboard the R/V Neil Armstrong during the Summer 2020 Irminger Sea month-long expedition. Photo credit: Heather Furey©Woods Hole Oceanographic Institution .[/media-caption] [media-caption type="image" class="external" path="https://oceanobservatories.org/wp-content/uploads/2020/09/IR7_Argo_float.jpeg" alt="Argo float" link="#"]Research Specialist Heather Furey prepares an Argo float for deployment off the stern of the R/V Neil Armstrong. The yellow straps are used to deploy the float while it is still in the box. The cardboard biodegrades in the water and releases the float. Photo credit: Jennifer Batryn©Woods Hole Oceanographic Institution.[/media-caption] [media-caption type="image" class="external" path="https://oceanobservatories.org/wp-content/uploads/2020/09/DSC_0403-scaled.jpg" alt="James Kuo" link="#"]OOI Engineer James Kuo checks the inductive communications on the Irminger Sea Flanking Mooring B during deployment. Most of the instruments on this subsurface mooring transmit data to the mooring controller inductively. The data is then sent acoustically to OOI Gliders which transmit the data to shore via satellite. Photo Credit: Jennifer Batryn©Woods Hole Oceanographic Institution.[/media-caption] [media-caption type="image" class="external" path="https://oceanobservatories.org/wp-content/uploads/2020/09/DSC_0908-1-scaled.jpg" alt="McClane Profiler" link="#"]The OOI team at the Irminger Sea Array deploying the Profiler Mooring. The yellow McLane Moored Profiler with a suite of science instruments is carefully lowered into the water. It will measure water properties including temperature, salinity, fluorescence, dissolved oxygen and water velocity. Photo credit: Jennifer Batryn©Woods Hole Oceanographic Institution.[/media-caption] [media-caption type="image" class="external" path="https://oceanobservatories.org/wp-content/uploads/2020/09/DSC_0012-scaled.jpg" alt="Profiler off stern" link="#"]The OOI Irminger Sea Hybrid Profiler Mooring is deployed top-first and trails behind the ship. Once the ship is at the desired location, the anchor is slid off the back deck, making quite a splash as it falls to the seafloor, pulling the mooring into place. Photo credit: Jennifer Batryn©Woods Hole Oceanographic Institution.[/media-caption] [media-caption type="image" class="external" path="https://oceanobservatories.org/wp-content/uploads/2020/09/Irminger-Sea-Posting--scaled.jpg" alt="Group shot" link="#"]The OOI and OSNAP science team poses on the back deck of the R/V Neil Armstrong on 27 August. 2020, after completing operations at the Irminger Sea Array. Using the last hours of good weather, equipment was secured before the eight-day voyage back to Woods Hole. Photo: Michael Sessa©Woods Hole Oceanographic Institution.[/media-caption] [media-caption type="image" class="external" path="https://oceanobservatories.org/wp-content/uploads/2020/09/northernlights_dobson-scaled.jpeg" alt="Northern lights" link="#"]One of the advantages of going to the OOI Irminger Sea Array is the opportunity to see the northern lights (Aurora borealis).This photo was taken as the team transited home through the Labrador Sea. What a great reward for all of the hard work put in to have a successful cruise! Photo credit: Collin Dobson©Woods Hole Oceanographic Institution.[/media-caption] Read More