News
Connect with OOI at AGU 2026

The U.S. National Science Foundation Ocean Observatories Initiative (OOI) will be represented at the 2026 American Geophysical Union (AGU) Annual Meeting, taking place December 7–11 in San Francisco, California. The meeting will bring together researchers and ocean observing professionals to share scientific discoveries, explore emerging technologies, and discuss the future of sustained ocean observations.
Several sessions and community events will highlight advances in ocean observing and opportunities for collaboration.
OOI-Related Scientific Sessions
Long-Term Ocean Observatories as Drivers of Sensor and Data Science Innovation
This session will highlight advances in ocean observing technologies and data systems, including innovations in instrumentation, data processing, and long-term monitoring. Presentations will explore how sustained ocean observations support scientific discovery and drive improvements in observing capabilities.
AI and Machine Learning for Sustained Ocean Observing: Progress and the Road Ahead
This session will explore how artificial intelligence (AI) and machine learning (ML) are advancing the analysis, interpretation, and application of data from long-term ocean observing systems. Topics include automated data processing, quality control, and emerging approaches to extracting scientific insights from large observational datasets.
OOIFB Town Hall
The OOI Facilities Board (OOIFB) will host a Town Hall focused on emerging seafloor sensing technologies, future scientific opportunities, and lessons learned from OOI’s experience supporting sustained ocean observations. The discussion will provide an opportunity for community engagement around advances in ocean observing infrastructure and technology.
Community Forum on the Future of Ocean Observing
Ahead of AGU, the OOIFB is also organizing a Community Forum on the Future of Ocean Observing, planned for December 4–5 in San Francisco. Building on discussions held during the Ocean Observing Exchanges and community input submitted in response to NSF’s recent Dear Colleague Letter, the forum will continue conversations about future ocean observing priorities and capabilities.
Additional details, including session schedules and opportunities to participate, will be shared as they become available.
Read MoreNSF Funding Opportunities Relevant to the OOI Community
The U.S. National Science Foundation (NSF) recently announced two funding opportunities that may be of interest to researchers working with ocean observing technologies, infrastructure, and data.
NSF X-Labs: AI for Physical Systems
NSF X-Labs is inviting proposals from interdisciplinary teams developing early-stage technologies that enable new forms of artificial intelligence (AI) integration in physical systems. Areas of interest include advanced sensors, robotics, embodied systems, human-robot interfaces, and cyber-physical systems.
The opportunity may be relevant to researchers exploring applications of AI in ocean observing, autonomous systems, sensing technologies, and other tools that support ocean science and scientific discovery.
Learn more about NSF X-Labs: AI for Physical Systems →
NSF 26-512: Unlocking Dataset Value for AI-Enabled Scientific Discovery (AI Datasets)
The AI Datasets program supports efforts to increase the scientific value of existing datasets by making them more accessible, easier to integrate, and better prepared for AI-driven and automated analysis.
The program includes opportunities to develop data pipelines, improve metadata and feature extraction, integrate multiple datasets, and augment or harmonize existing datasets. These goals may be particularly relevant to researchers interested in using long-term ocean observing datasets for AI-enabled scientific discovery.
NSF anticipates Planning grants of up to $200,000, Impact awards of up to $2 million, and Flagship awards of up to $5 million. The next full proposal deadline is November 4, 2026.
Learn more about NSF 26-512: AI Datasets →
Researchers interested in these opportunities should review the full NSF announcements and solicitation for eligibility, requirements, deadlines, and application guidance.
Read MoreOOI Plankton Imagery and Co-Located Environmental Data Now Ready for Analysis
Since April 2024, the OOI has collected plankton imagery with an Imaging Flow CytoBot (IFCB) on a mooring in the Pioneer Mid-Atlantic Bight (MAB) array. The IFCB is deployed at 7 m depth on the Central Surface Mooring (CNSM), which is located approximately 45 km east of Nags Head, NC in about 30 m of water. The CNSM measures a variety of meteorological and oceanographic variables. A companion mooring at the Central Site contains an ADCP and a wave-powered profiler operating from 2 to 22 m depth. Other moorings and gliders within the Pioneer MAB Array make multidisciplinary measurements from the air-sea interface to the sea floor.
Initially deployed in the spring of 2024, OOI now has 18 months of moored IFCB data, spanning April 2024-April 2025 and November 2025-April 2026. The data are freely available and can be accessed and visualized in several ways. For help choosing a data access point that best fits your data needs, please reference the Quick Access Links post in the IFCB Community forum on the OOI’s Discourse site.
The IFCB dashboard is the primary access point for exploring recovered data, allowing display of images from recovered moored and shipboard data. The dashboard also provides geographical coordinates and allows users to filter samples by relevant tags. The tag for the Central Surface Mooring (“site_cp10cnsm”) can be used to browse a combined shipboard and moored dataset with over 7 million images (Fig. 1).
[caption id="attachment_37880" align="alignnone" width="624"]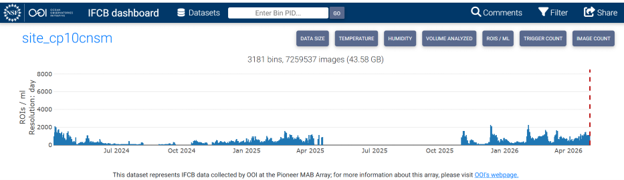 Figure 1: OOI IFCB Dashboard timeline tagged with “site_cp10cnsm” to show both shipboard and moored data from April 2024 to April 2026.[/caption]
During deployment, the OOI Data Explorer shows selected parameters from the IFCB header file transmitted via satellite telemetry. The moored time series can be viewed individually to change the time period and data binning, see deployment dates, and read annotations. They can also be compared with time series data from other Pioneer MAB instruments.
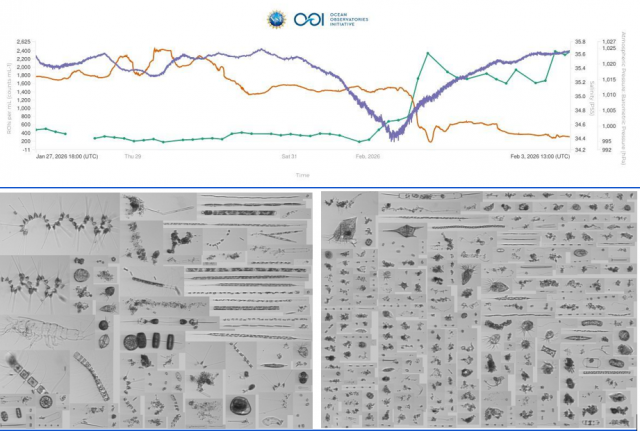
Even after recovery, Data Explorer can be useful for exploring events of interest. For example, Winter Storm Gianna affected the Pioneer MAB around Feb 1, 2026. Gianna’s passage was associated with a rapid pressure drop and watermass changes, with a drop of about 1 PSU in salinity (Fig 2, upper). At the same time, there was an increase in IFCB images (more specifically, regions of interest, or ROIs) per ml of water. Evaluating imagery from the OOI IFCB Dashboard (Fig. 2, lower) shows a change in the assemblages of plankton and particles before and after the peak of storm activity.
Data Explorer views and IFCB Dashboard mosaics can help researchers identify which full resolution datasets they might want to access. The raw IFCB data files can be downloaded from the OOI’s Raw Data Archive or used directly within OOI’s JupyterHub from either the mooring or the cruise data. Resources for navigating and using the Raw Data Archive can be found on this page.
Researchers can join OOI’s IFCB community of practice and use the OOI Discourse forum, which serves as an entry point to both OOI data and the global IFCB community. After creating an account, users can post to the IFCB Community on Discourse to share methods and results, troubleshoot data issues, and connect with colleagues. Answers to common questions about working with IFCB data may be found in the McLane IFCB Users Google Group; information about accessing those resources is available in this post. As a complement to the OOI and McLane forums, the OOI Facilities Board (OOIFB) is sponsoring a four-part series of IFCB webinars in 2026. More information about the series can be found at https://ooifb.org/meetings/2026-ifcb-webinar-series/ including recordings of past webinars underneath the “Archived Webinars” heading.
[caption id="attachment_37889" align="alignnone" width="921"]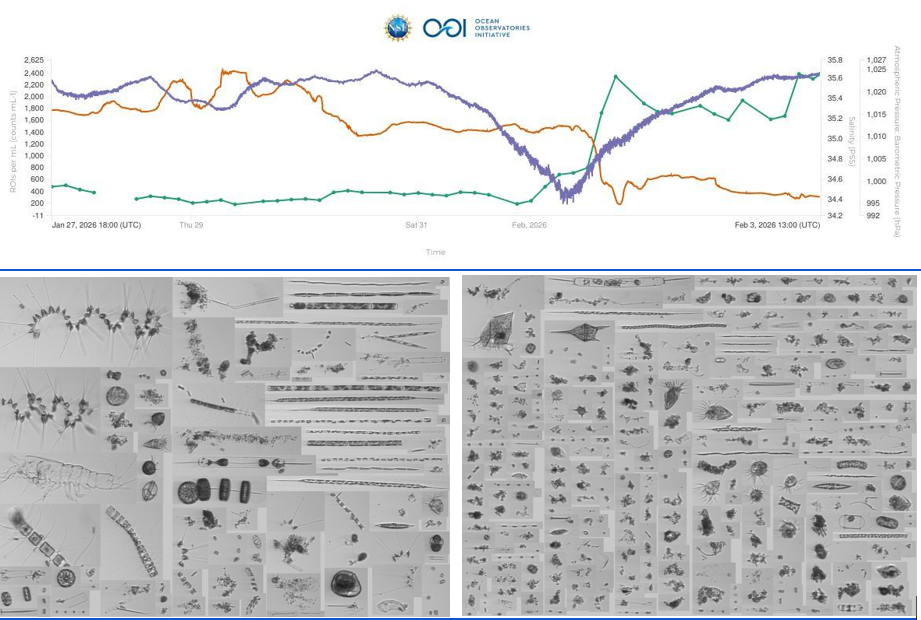 Figure 2: Upper panel: Data comparison chart from OOI Data Explorer showing ROIs per ml (green line with dots), practical salinity (orange line), and atmospheric pressure (purple line) before and after the eye of the nor’easter Winter Storm Gianna passed over CNSM on Feb. 1, 2026. Lower panels: Mosaics of images from the OOI IFCB Dashboard on Feb. 1, 2026 at 00:25 UTC (left) and 15:25 UTC (right).[/caption]
Read More
Guidance for Researchers Preparing Proposals Using OOI Data
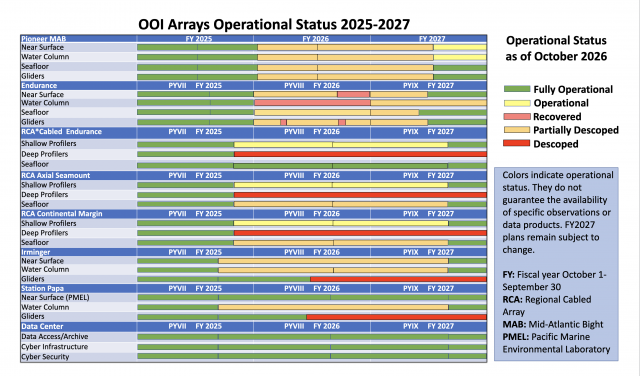
The U.S. National Science Foundation Ocean Observatories Initiative (OOI) is providing the following guidance for researchers preparing proposals that incorporate OOI observations and data during Program Year IX (PYIX; October 2026–September 2027).
At this time, OOI anticipates that moorings currently deployed will continue to be serviced and maintained throughout PYIX. The status of the remaining portions of the arrays, along with implementation timelines, remains under consideration as planning for PYIX continues.
Researchers are encouraged to continue developing proposals that leverage OOI observations and data. For questions about identifying or using OOI data in a proposal, please contact OOI. Researchers proposing to add an instrument, platform, or other infrastructure to the OOI facility should review the process for adding instruments or platforms and contact OOI to discuss technical feasibility. If your proposed work depends on portions of the arrays whose status or implementation timeline remains under consideration, please contact OOI Program Director George Voulgaris to discuss infrastructure availability.
The OOI Program Management Office will continue to share updates as additional information becomes available. To stay informed about OOI program news, infrastructure updates, new data resources, and community opportunities, we encourage you to subscribe to the OOI Oceanic Insights monthly newsletter.
OOI Participates in Woods Hole Science Stroll
The Woods Hole Science Stroll is an annual event that highlights the major research institutions located in Woods Hole village (WHOI, MBL, NOAA, USGS, USCG), and also includes over 20 organizations representing a breadth of STEM research, education, and environmental groups (Fig 1). The all-day event is open to the public and includes exhibits and hands-on demonstrations for visitors to learn about marine science directly from working scientists, engineers, and technicians. Exhibits range from explanations of ocean science and environmental stewardship to demonstrations of underwater robots and aerial drones.
The OOI team participated in the 2026 Science Stroll, which took place on August 8th and hosted over 2,500 visitors. The Stroll is an effective form of public outreach, allowing OOI engineers and technicians to explain the project’s science goals and observing technology directly to visitors. OOI team members participated in planning, preparation, and staffing of the event and prepared two exhibits.
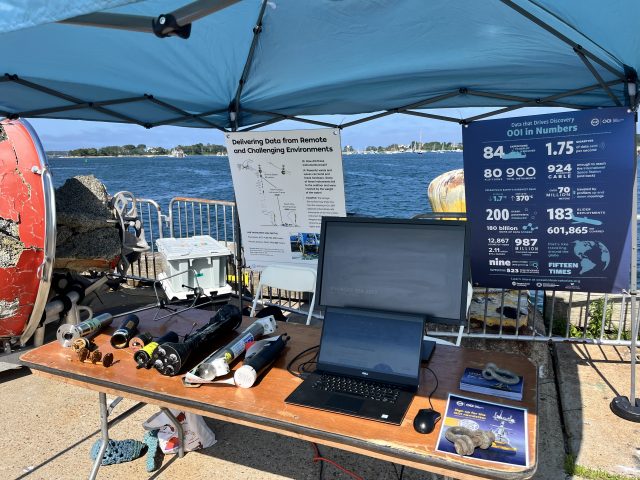
The first exhibit showed examples of OOI instrumentation, including a CTD, fluorometer, and nitrate sensor (Fig. 2). In addition to seeing the size, shape, and sensing mechanisms of real instruments, the exhibit also had several of the same instruments that had been damaged, either by impacts during deployment and recovery or by falling to the seafloor and being crushed by pressure.
The second exhibit presented OOIs Remotely Operated Vehicle. The ROV is used for visual inspection of mooring components after deployment and assessment or recovery of assets that cannot be retrieved by other means. Seeing an ROV up close gives visitors a sense of its size, weight, and layout and leads to many questions. Examples include why there are four thrusters, how weight and buoyancy are balanced, and why the camera has to be pointed towards the manipulator.
The OOI exhibits were adjacent to WHOI’s mooring and rigging shop display, allowing discussions of mooring materials to be demonstrated with samples of synthetic line, shackles, wire rope, and other components. The rigging shop display included a 64-inch syntactic foam flotation sphere used for subsurface moorings.
To one side of the OOI exhibit tables was an OOI Coastal Profiler Mooring buoy, demonstrating the size and scale of what can be seen from a ship in the vicinity of an OOI array. On the other side was a foam flotation sphere that exceeded its depth rating and was destroyed by high pressure (Fig. 3). The crushed sphere is a crowd favorite, which visitors are free to touch and inspect up close.
With thousands of potential interactions between scientists and members of the public, the Science Stroll offers a unique venue for telling the OOI story in the context of the world-class ocean science being conducted in Woods Hole village.
[caption id="attachment_37825" align="alignnone" width="2560"]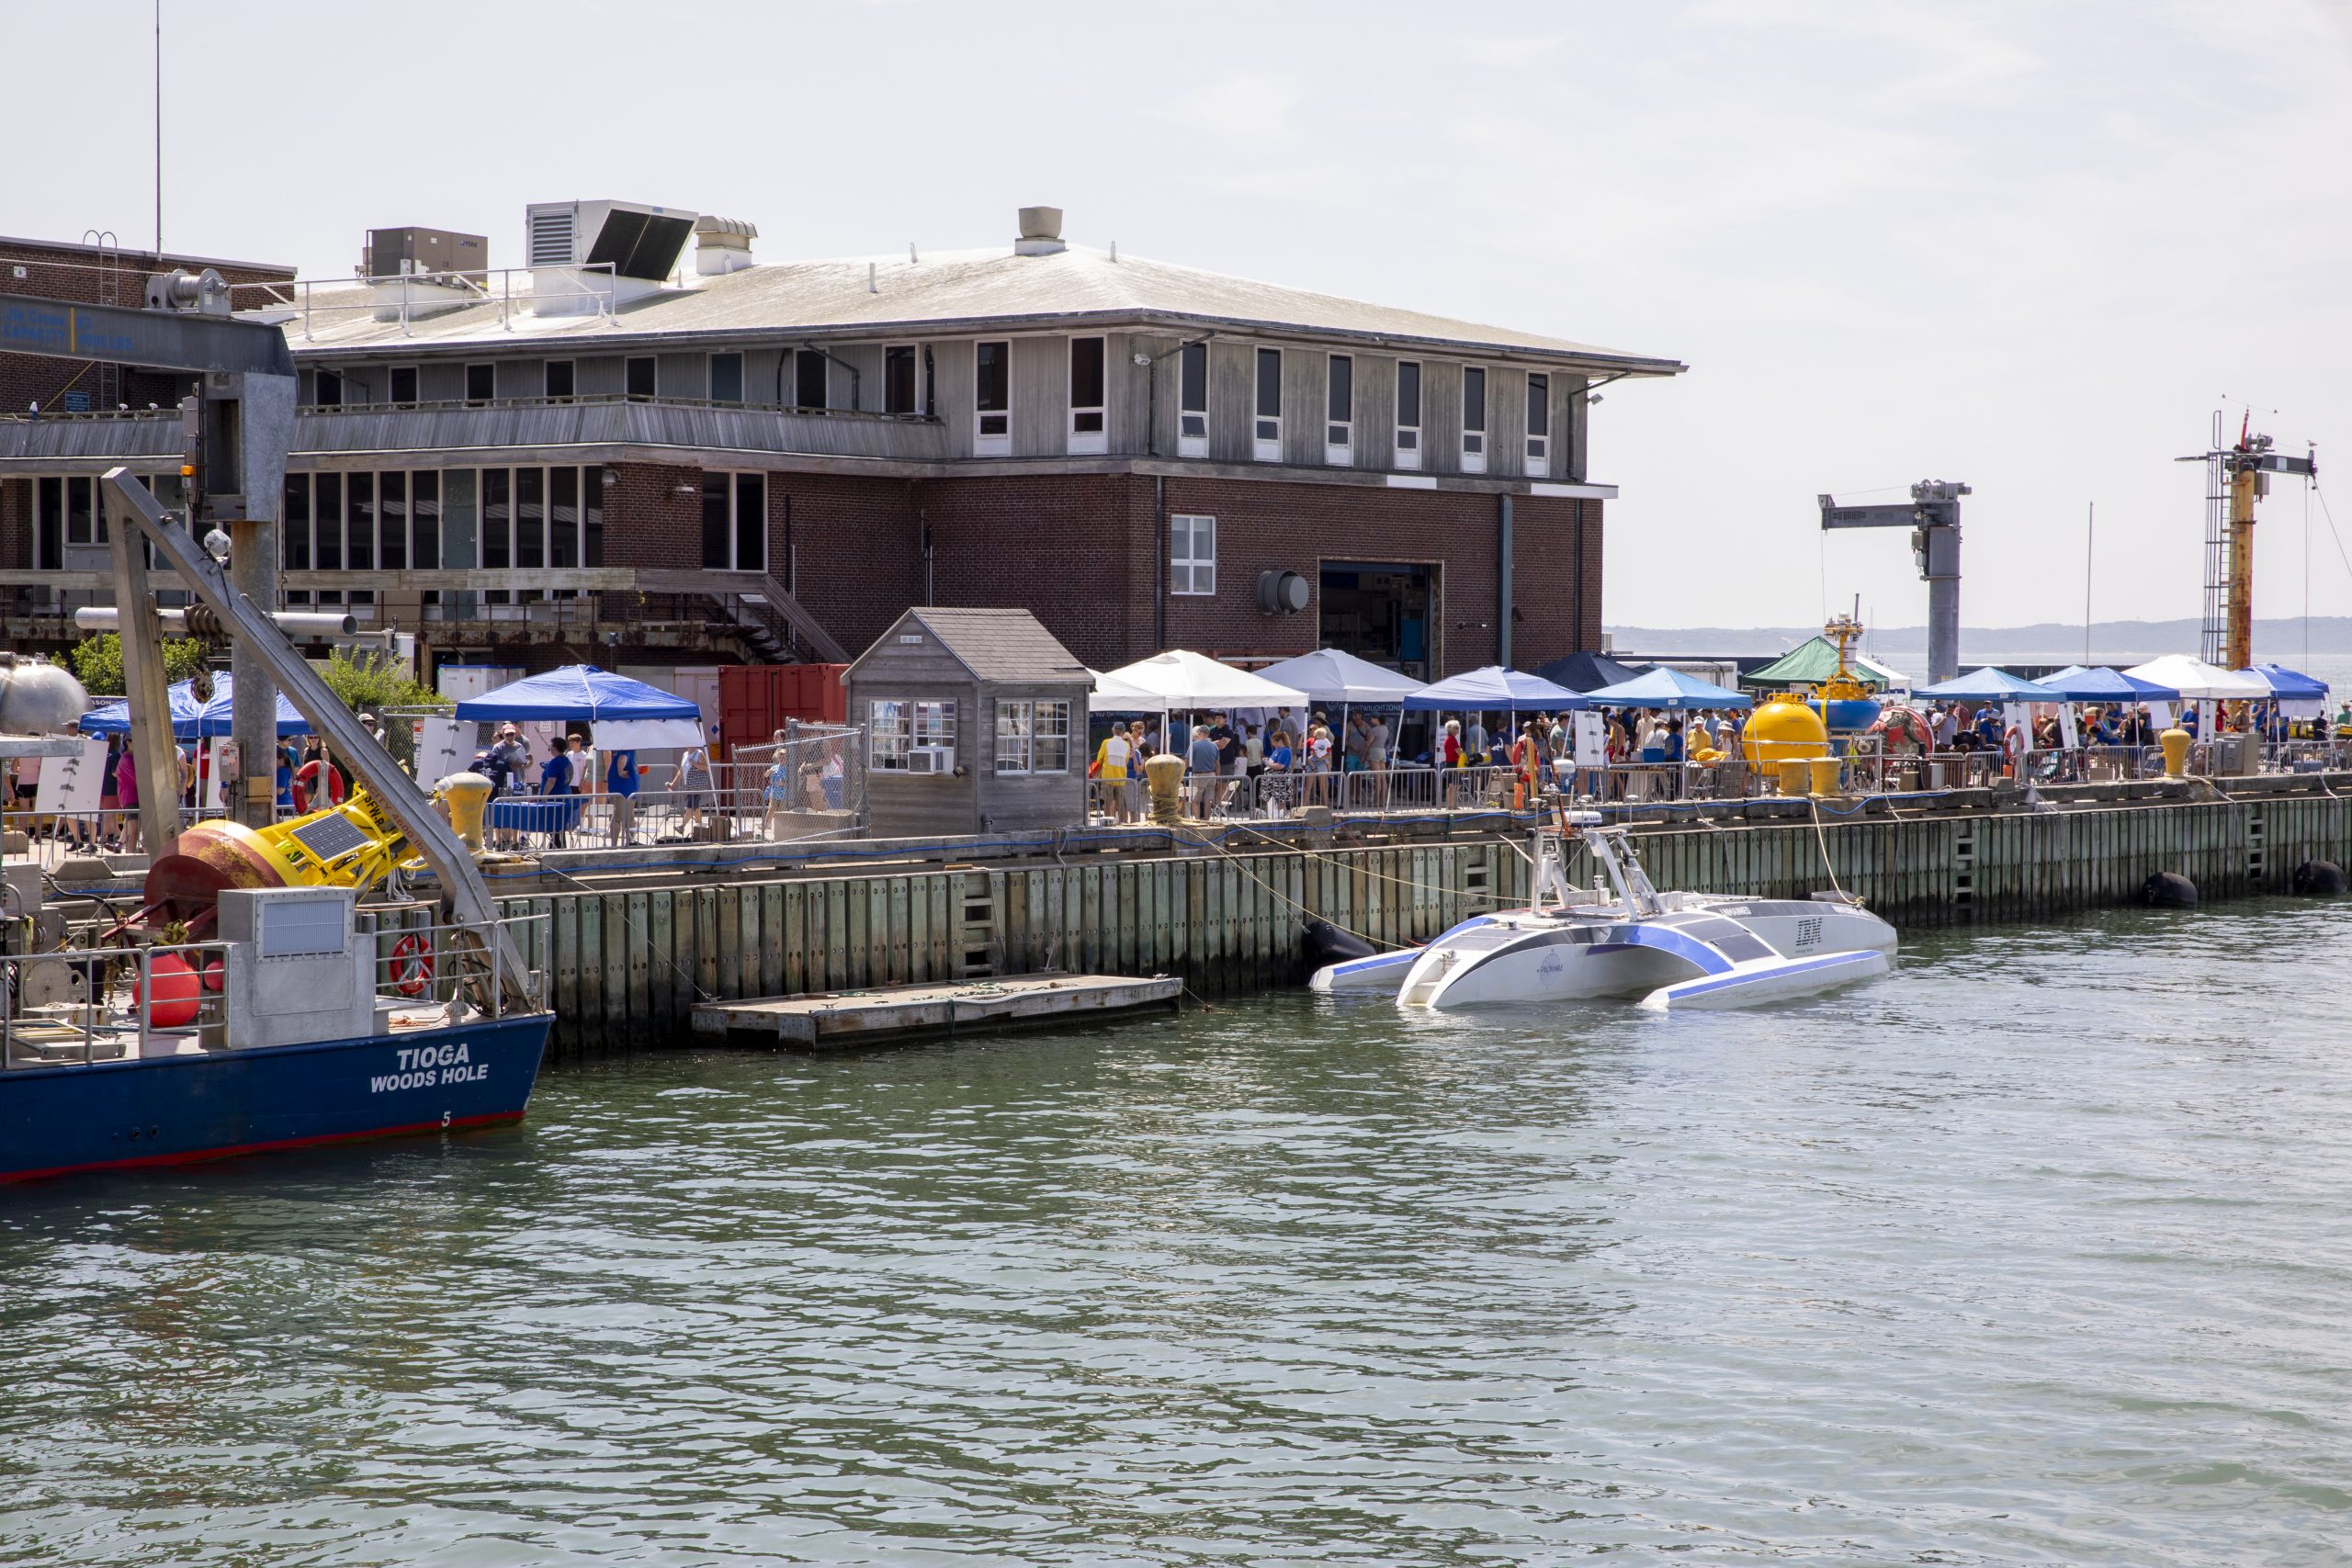 Figure 1. Crowds gather along the dock during the Woods Hole Science Stroll. Credit: Woods Hole Oceanographic Institution.[/caption]
[caption id="attachment_37826" align="alignnone" width="2560"]
Figure 1. Crowds gather along the dock during the Woods Hole Science Stroll. Credit: Woods Hole Oceanographic Institution.[/caption]
[caption id="attachment_37826" align="alignnone" width="2560"]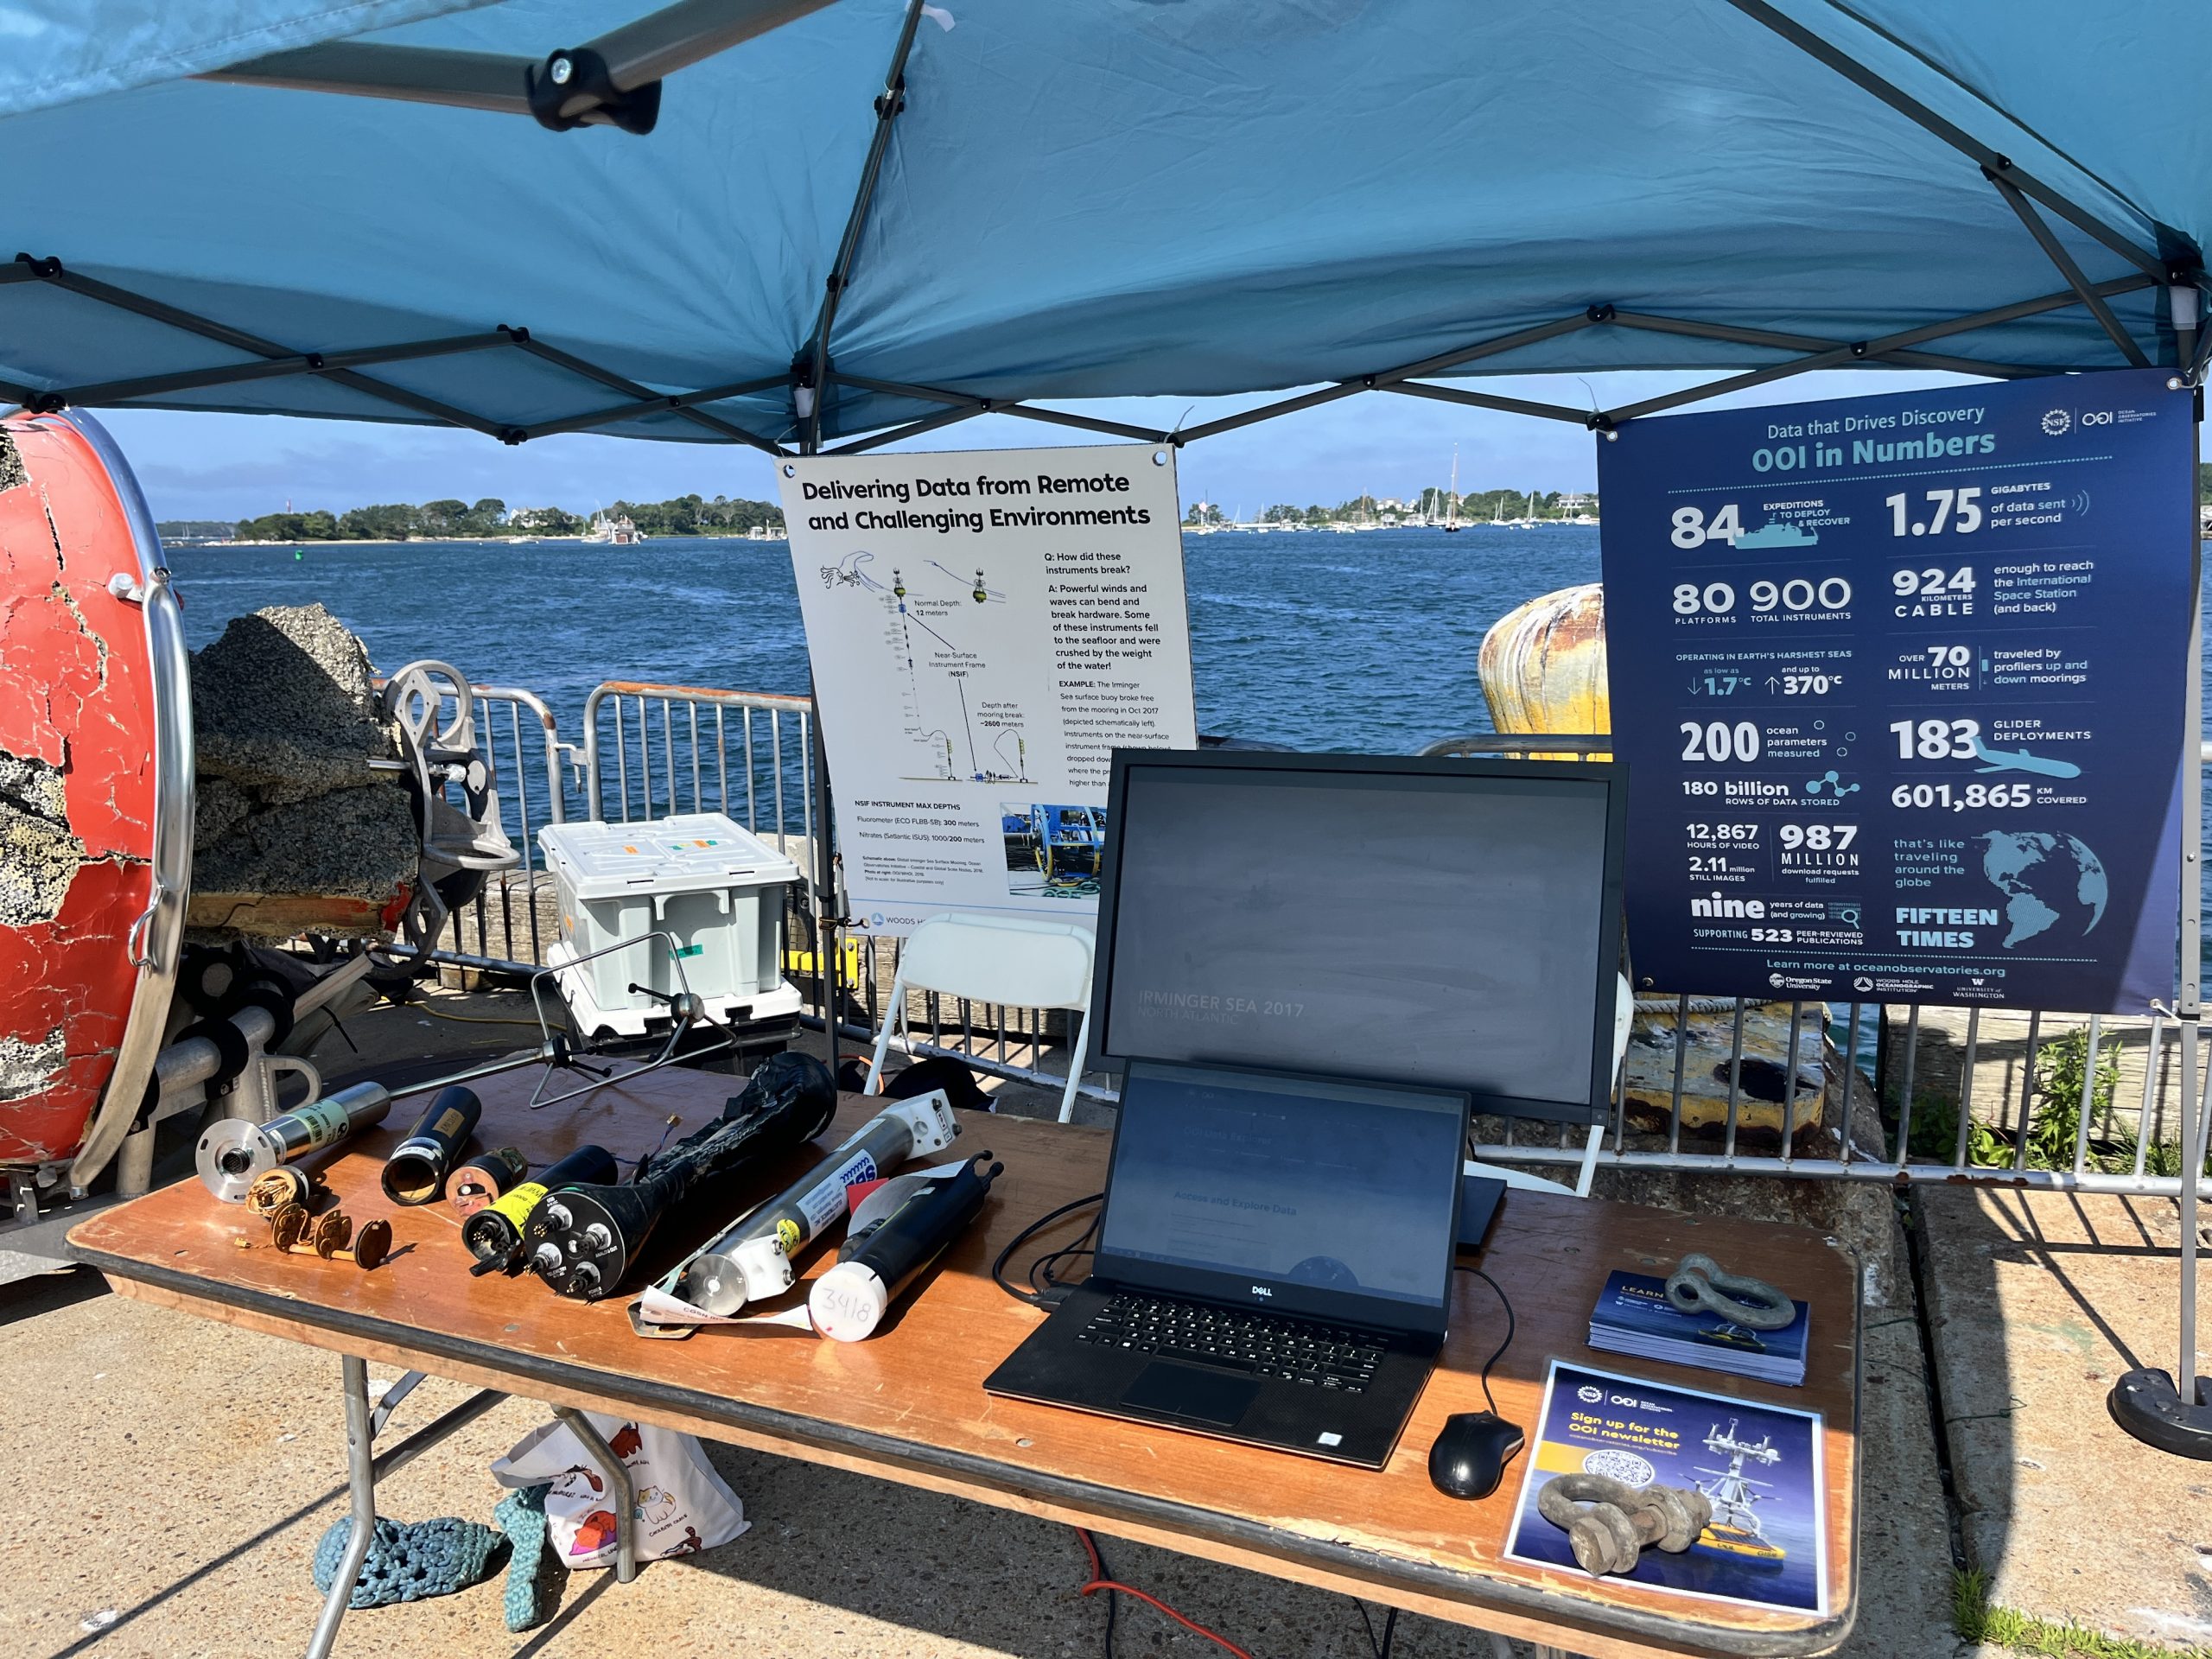 Figure 2. The OOI booth at the 2026 Woods Hole Science Stroll. Credit: Nikki Arm, Woods Hole Oceanographic Institution.[/caption]
[caption id="attachment_37827" align="alignnone" width="1319"]
Figure 2. The OOI booth at the 2026 Woods Hole Science Stroll. Credit: Nikki Arm, Woods Hole Oceanographic Institution.[/caption]
[caption id="attachment_37827" align="alignnone" width="1319"]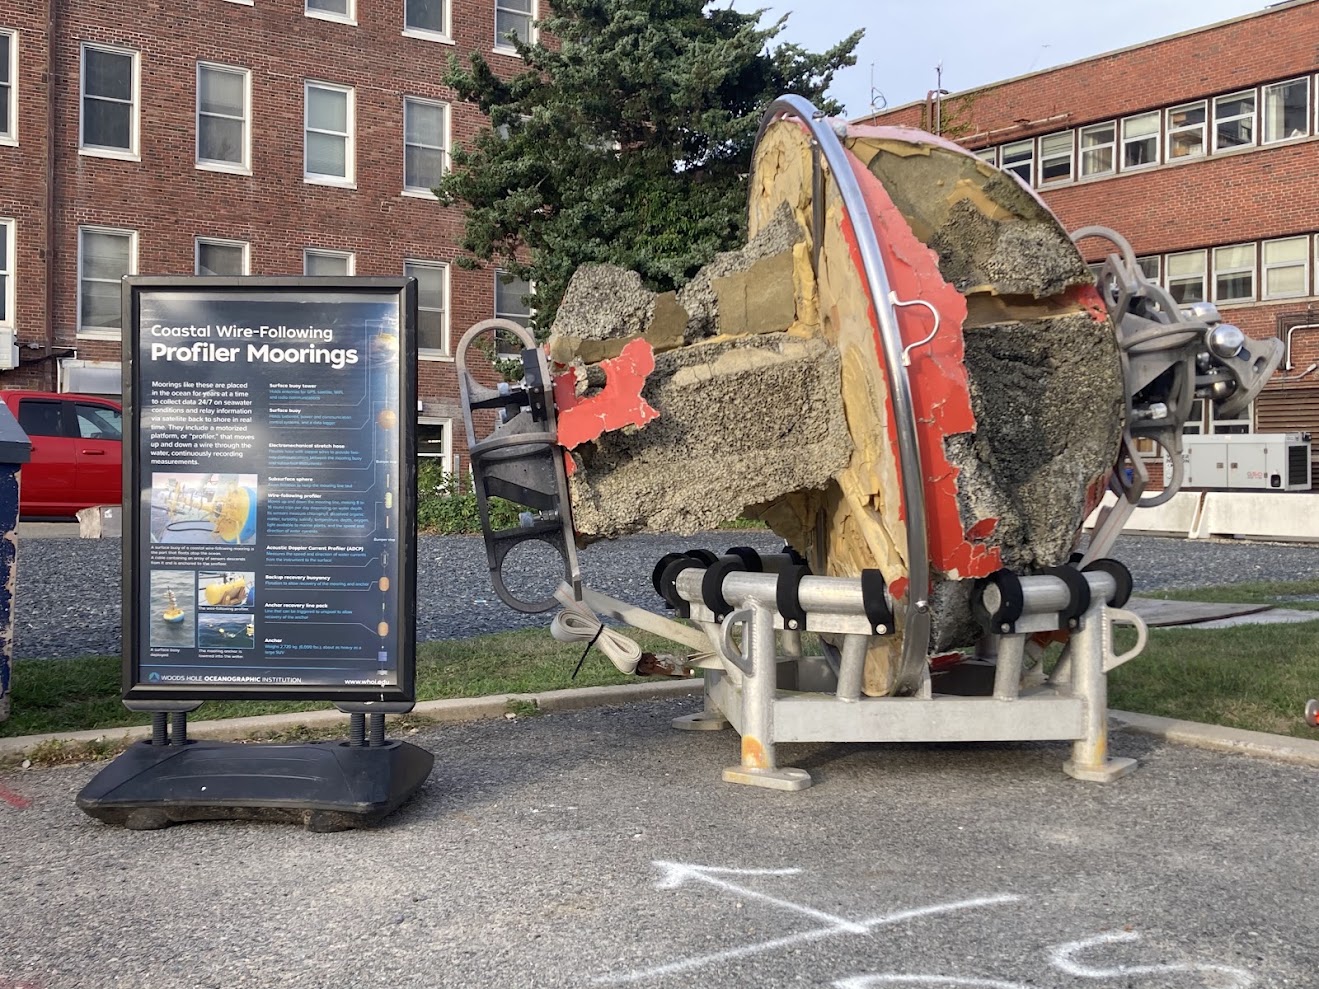 Figure 3. A foam flotation sphere on display at the 2026 Woods Hole Science Stroll. Credit: Kylene Cooley, Woods Hole Oceanographic Institution.[/caption]
Read More
Figure 3. A foam flotation sphere on display at the 2026 Woods Hole Science Stroll. Credit: Kylene Cooley, Woods Hole Oceanographic Institution.[/caption]
Read More NSF Seeks Community Input on Future Ocean Observing Priorities
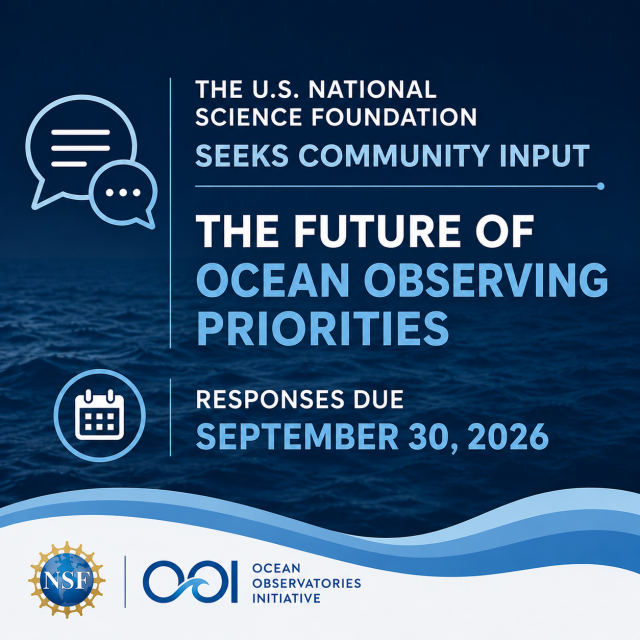
The U.S. National Science Foundation (NSF) has issued a Dear Colleague Letter (DCL) seeking input from the ocean science community on future ocean observing priorities. The DCL provides an opportunity for the community to share perspectives on the future of NSF-supported ocean observing. NSF is asking about observing gaps, fixed and mobile assets, new technologies, coordination with other programs, operational uses and stakeholders, measures of value, and which elements of its existing observing portfolio should be maintained or updated.
OOI has now been operating for more than a decade, providing openly available multidisciplinary data across a range of ocean environments. The program was designed around an anticipated 30-year operating life, with infrastructure that is reconfigurable, extensible, and relocatable so that arrays, instruments, and platforms can move and change as science priorities and technologies evolve. The relocation of the Pioneer Array from the New England Shelf to the Mid-Atlantic Bight, following NSF and community workshops, is one example.
OOI combines sustained observations from instrumented moorings with the spatial coverage provided by autonomous platforms and supports the incorporation of new sensors and observing technologies. In addition to the observing assets and long-term data records, OOI now has more than a decade of experience deploying, operating, maintaining, and modifying a sustained ocean observing system.
Those who use OOI data, assets, or capabilities can bring their experience to the broader discussion by telling NSF what has worked, what should continue or change, and how OOI can help address future ocean observing priorities.
OOI encourages researchers, educators, students, data users, technology developers, partner organizations, and other stakeholders to review the DCL and provide input directly to NSF.
Responses may be submitted by individuals or as aggregated responses from groups or organizations and are due September 30, 2026.
Read the NSF Dear Colleague Letter and submit your response.
NOTE: The U.S. Climate Variability and Prediction Program (CLIVAR) posted a list of Observing Efforts here.
OOI User Accounts Coming for Data Access

The U.S. National Science Foundation Ocean Observatories Initiative (OOI) plans to introduce user accounts for access to OOI data. OOI data will remain free and available to anyone who creates an account. No subscription, institutional affiliation or payment will be required. The change is intended to improve service to users, support reliable data access, and give OOI a better understanding of how the observatory is being used.
OOI will announce the implementation date and provide instructions before login is required. No action is needed now.
Why OOI is introducing user accounts
OOI serves a broad community of researchers, educators, students, government agencies, private organizations, and other users. Most data access today is anonymous, which means OOI has limited information about who is using the data, which services are most useful, and where improvements would have the greatest value.
User accounts will provide clearer information about how OOI data and services are used. This will help OOI make better decisions about data tools, documentation, training, and user support. It will also improve our ability to describe the use and impact of this research facility, funded by the U.S. National Science Foundation.
Authentication will also help OOI manage automated traffic and protect system performance. Many users rely on scripts, APIs, and other automated workflows, and those uses will continue to be supported.
What users can expect
- Better support and documentation. A better understanding of the user community will help OOI focus tutorials, examples, training, and support where they are most needed.
- More reliable data access. Authentication will help OOI distinguish normal research activity from unusually intensive automated traffic that can affect system performance.
- Continued support for automated workflows. OOI will provide guidance for users who access data through APIs, scripts, and other automated systems.
- Better information for future improvements. Usage information will help OOI identify which data products and services are most important to the community.
- A clearer picture of OOI impact. Better information about research, education, government, operational, and commercial use will help OOI and the U.S. National Science Foundation understand how the observatory is serving the community.
What will not change
OOI data will remain free and available to all users who create an account. The account requirement will not introduce a subscription or fee, nor will users need to be affiliated with a particular institution or organization to access OOI data.
OOI will provide advance notice before login is required, including instructions for creating an account and for updating automated data-access workflows. Additional information will also clarify which OOI data services require authentication and what information users will need to provide when creating an account.
Information collected through accounts and data access will be used to understand and improve use of the observatory and support reporting on OOI use and impact. Before login is required, OOI will provide information explaining what account and usage information will be collected, how it will be used, and how it will be protected.
What users need to do
Nothing yet. OOI will provide the implementation date, account-creation instructions, and technical guidance before the new requirement takes effect. Users who access OOI data through scripts, APIs, or other automated workflows will also receive guidance on any changes needed to maintain access.
User accounts will help OOI understand the community it serves and improve the reliability and usefulness of its data services.
Users with questions can contact the OOI HelpDesk.
Read MoreIFCB Webinar #2 Highlights: Lessons from Time/Moored-Based IFCB Observations
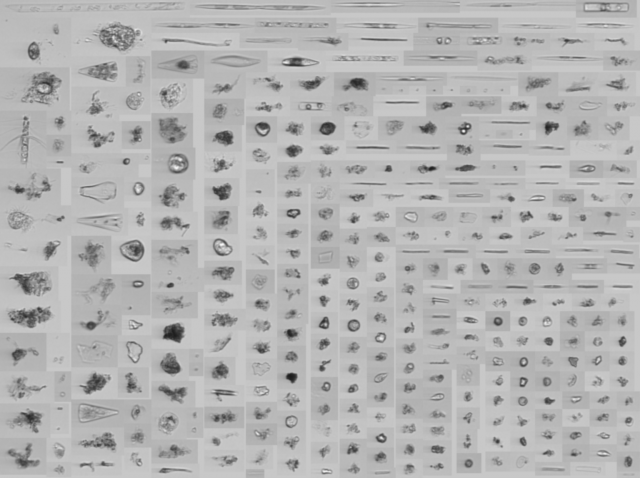
The second webinar in the Ocean Observatories Initiative Facility Board (OOIFB) four-part IFCB webinar series focused on time/moored-based Imaging FlowCytobot (IFCB) deployments and the challenges of operating IFCBs on sustained ocean observing platforms.
The webinar speakers were Kylene Cooley, Woods Hole Oceanographic Institution (WHOI), who leads IFCB operations for the OOI Pioneer Mid-Atlantic Bight (MAB) Array, and Kasia Kenitz, Southern California Coastal Ocean Observing System, who discussed IFCB operations on the Del Mar Mooring in the California IFCB Network. Both shared practical lessons from deploying and maintaining IFCBs in long-term, moored observing systems.
Cooley shared lessons from deploying IFCBs on the Pioneer MAB Array, where the instruments operate for extended periods with limited physical access and satellite communications. She discussed the importance of preparing and testing the IFCB before deployment, including pressure and power testing, instrument burn-in, automatic startup configuration, and coordination with the mooring team. She also described challenges encountered during deployments, including biofouling, power supply issues, instrument alignment, and weather conditions that can limit access to the moorings.
Kenitz described IFCB operations on the Del Mar Mooring, where the instrument is solar-powered and uses cellular communications for near-real-time data transfer and remote monitoring. Increased solar capacity has allowed the IFCB to sample more frequently, moving from every three to four hours to every one to two hours. She also discussed challenges with operating the IFCB alongside other sensors, including mechanical pump noise that can interfere with velocity measurements. Both presentations highlighted the importance of routine cleaning, antifouling measures, remote monitoring, and pre-deployment testing for long-term IFCB deployments.
The remaining webinars in the series will focus on space/ship-based IFCBs and experiments and lab-based studies. To learn more, view webinar recordings, and find upcoming dates, visit the OOIFB webpage.
Read MoreOOI Assets Available to Support Research
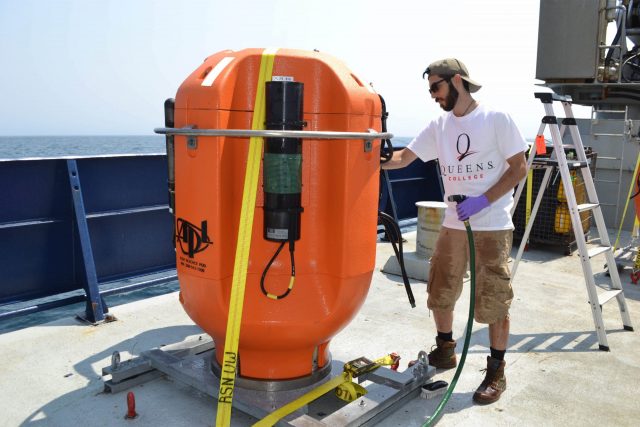
The U.S. National Science Foundation (NSF) Ocean Observatories Initiative (OOI) assets may be available for temporary loan to researchers when not required for OOI operations. The OOI Asset Loan Program helps maximize the use of NSF-funded ocean observing assets by making infrastructure, instruments, gliders, autonomous underwater vehicles (AUVs), remotely operated vehicles (ROVs), and other assets available to support additional scientific research.
Asset requests are considered based on availability, proposed scientific use, and potential impacts to OOI operations, with all loans requiring review by the OOI Program Management Office (PMO) and approval by NSF. Researchers from any institution may submit a request.
OOI recently updated its Loaning of OOI Assets webpage with additional information about available assets, borrower responsibilities, and the process for requesting a loan.
Interested in using an OOI asset for your research? Visit the updated Loaning of OOI Assets webpage to learn more about the program and how to submit a request through the OOI HelpDesk.
Read MoreAMOC Heat Transport from Reanalyses
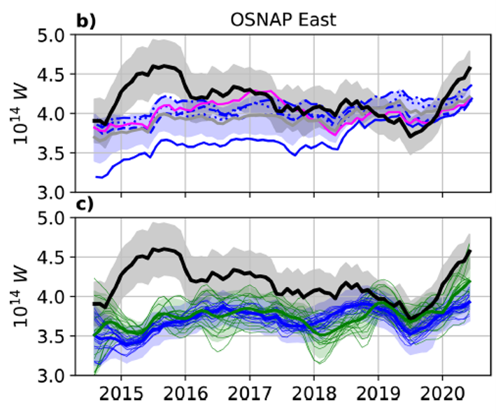
(Adapted from Winkelbauer et al., 2026)
Oceanic heat transport is important for understanding the Atlantic Meridional Overturning Circulation (AMOC), and ocean reanalysis models provide a means of evaluating transport variability and trends. A recent paper by Winkelbauer et al. (2026) evaluated the extent to which reanalyses reproduce transports estimated from observations. Their results show that the reanalyses capture the overall character of heat transport in the subpolar North Atlantic, but have limitations in particular times and regions.
The authors used observations from the Overturning in the Subpolar North Atlantic Program (OSNAP) data set compiled by Fu et. al. (2023), which includes both OSNAP-West (Labrador Shelf to West Greenland) and OSNAP-East (East Greenland to Scotland). The OSNAP-East array incorporates the OOI Irminger Sea Flanking moorings. The observation-based transport estimates were compared to those from several reanalysis models. A composite (mean) product was produced from four models with ¼ degree resolution that are based on the Copernicus Marine Service Global Reanalysis Ensemble Product (GREP). A higher resolution product, the Global Ocean Reanalysis System (GLORYS12V1) was also used in the comparison. All of the reanalyses are based on Nucleus for European Modeling for the Ocean (NEMO). It is notable that none of the reanalyses assimilate ocean velocity observations. This means that ocean transports differences will depend largely on velocity differences between observations and models.
Comparisons during the OSNAP observation period (2015-2020) include temperature, velocity and transport. Temperatures are relatively well reproduced by the reanalysis models, albeit with some systematic biases – cold biases in the basin interiors and warm biases on the shelves. The broad structure of ocean currents can be seen in the models, but there are discrepancies in both strength and location of the Labrador Current, West Greenland Current and East Greenland Current. However, it is also noted that limited observations in a few key regions compromise comparisons there. For transport, the reanalyses capture overall variability, and most are well correlated with observations over the ~6 year period (Fig. 3). However, none of the reanalyses capture the 2015 transport peak observed by OSNAP.
The authors dig deeper into the 2015 transport discrepancy and find that it is associated with a region of the OSNAP line near the Iceland and Rockall-Hatton Basins where glider transects supplemented the moored array in the upper ocean. They speculate that changes in the observational coverage due to gliders contribute to the 2015 transport peak that is not captured by the models.
Overall, this comparison study is a relatively strong endorsement of the reanalysis models, which “generally reproduce the broad structure of the AMOC and its associate heat transport”, although not without bias (5-10% in the mean and 60-80% for some times and locations). In addition, some key boundary currents are not well represented in the models. Interestingly, the case study for 2015 shows that the OSNAP moored array also has limitations, and can be improved by the use of gliders to resolve upper-ocean structure between mooring stations.
[caption id="attachment_37794" align="alignnone" width="496"] Figure 1. Time series of heat transport from OSNAP observations (black) compared to reanalysis models. Upper panel compares five different reanalysis products (colors) and the mean of the ¼ degree products (gray). Lower panel compares OSNAP to indirect heat flux estimates. From Winkelbauer et al., 2026.[/caption]
___________________
References:
Fu, Y. and 25 co-authors, 2023. Meridional Overturning Circulation Observed by the Overturning in the Subpolar North Atlantic Program (OSNAP) Array from August 2014 to June 2020, Georgia Institute of Technology [data set], https://doi.org/10.35090/gatech/70342.
Winkelbauer, S. I Winterer, M. Mayer, Y. Fu and L. Haimberger, 2024. Subpolar Atlantic meridional heat transports from OSNAP and ocean reanalyses – a comparison, Ocean Sci, 22, 629-651, https://doi.org/10.5194/os-22-629-2026.
Read More