
Data Issue
HelpDesk Moves to Discourse

Questions submitted to OOI’s HelpDesk will now be shared and answered on OOI’s community forum on Discourse. This move was initiated in January 2021 as a way to make such queries more transparent, with the hope that the answers would help inform the broader OOI community and possibly initiate a dialogue among OOI data users themselves.
“HelpDesk questions range in complexity, depending upon the experience of OOI data users. By posting basic questions about accessing data to detailed queries about particular data, we hope to provide a resource for users at all experience levels,” said Jeff Glatstein, Senior Manager of Cyberinfrastructure and OOI Data Delivery Lead. Members of the OOI Data Team, comprised of representatives from all of the OOI arrays, answer questions relevant to data collected by the arrays. The platform offers the team a way to quickly engage with questioners and vice versa.
The team expects that some of the questions submitted will spark discussion amongst the data users themselves. “Having the questions presented on an open forum like Discourse provides an opportunity for OOI data users to share their knowledge and lend insight into specific data-related questions,” added Glatstein.
In addition to the HelpDesk, Discourse contains an FAQ section, and discussion sections for sharing of data tools, innovations, and findings, known data issues, and other areas where users’ exchange of information can be helpful. The implementation of Discourse was recommended by the OOI Facility Board as a means to encourage exchange between members of the OOI community. OOI’s forum is modeled after the Pangeo Discourse, which is a successful community of scientists and software developers working together to improve scientific research.
All OOI data users and potential OOI data users are encouraged to try out, then bookmark, Discourse. By sharing knowledge, questions and answers, OOI can join the ranks of helping to advance scientific research through engaged dialogue and collaboration. See you online!
Read More
Temporary Data Pause During RCA Expedition
The Regional Cabled Array (RCA) operation and management cruise, funded by the National Science Foundation as part of the Ocean Observatories Initiative, will take place July 31- September 1, 2020 onboard the R/V Thomas G. Thompson, operated by the University of Washington. All of the Cabled Array instruments that are being replaced during the cruise will be deactivated on 01 August to avoid calibration mismatches as the in-water instruments are unplugged and new ones plugged in. The newly deployed instruments will be turned back on as soon as possible after each leg of the cruise, with 01 September being the absolute latest that they come back online. Once they have been reactivated, the data will backfill with the appropriate serial numbers and calibration info to repopulate the gap.
Read MoreAltered Carbon: Improvement to CO2 Measurements Enhance OOI Data Quality
Global carbon dioxide (CO2) concentrations are increasing in the atmosphere, largely due to the use of fossil fuels. The oceans are absorbing about 25-30 percent of the atmospheric CO2, resulting in a shift in seawater acid-base chemistry and a decrease in ocean pH, making seawater more acidic. To help scientists assess this changing ocean chemistry, the Ocean Observatories Initiative (OOI) uses the Sunburst SAMI-CO2 instrument to measure the partial pressure of carbon dioxide (pCO2) from 150-700 microatmospheres (μatm) in the upper 200 meters of the water column.
The distribution of pCO2 in seawater is dependent on gas exchange with the atmosphere at the ocean surface, the breakdown of plant material by microbial processes, and removal by photosynthesis, calcium carbonate formation, and rising temperatures. Increases in pCO2 can also be caused by dissolution of calcium carbonate, which is of particular importance because calcium carbonate minerals are the building blocks for the skeletons and shells of many marine organisms, such as oysters.
Using the SAMI-CO2 instrument, OOI researchers determine the partial pressure of CO2 by equilibrating a pH sensitive indicator solution (Bromothymol Blue) to sampled seawater. Aqueous carbon dioxide in seawater diffuses across a permeable silicone membrane equilibrator within the instrument, which changes the color of the indicator solution from blue to yellow. The equilibrated indicator solution is then pumped through a chamber where light passes through the liquid and into a receptor that uses the wavelength to determine the amount of color change, and thus the amount of CO2 dissolved in the water.
“The OOI system parses the raw data from the instrument, applies a ‘blank’ value to correct for instrument drift, and then delivers calibrated pCO2 data to users on demand,” explained Michael Vardaro, OOI Research Scientist at the University of Washington. “We recently created a fix to apply the correct ’blank’ values to the pCO2 data to improve data accessibility and data quality.”
Blank values (e.g., optical absorbance ratios in the pco2w_b_sami_data_record_cal data stream) are used to calculate the data product “pCO2 Seawater (µatm)” at a specific timestamp. Blank values, however, are recorded intermittently to correct for drift of the electro-optical system, about once a week, which is a longer interval than the instrument sampling rate of one sample per hour.
The recent correction will ensure that any pCO2 data request will use a linearly interpolated value from the closest blanks if no blank value is found within the requested time range. This means that for an hourly pCO2 measurement that falls between weekly blank values the system will calculate the appropriate drift correction to apply based on the surrounding blank values, instead of trying to find a specific blank value that might be outside the date range of the requested data. In addition to improving data quality, this fix prevents the system from returning fill values or empty datasets. Additional restrictions were put on data delivery to prevent interpolation across deployments, which could pull blanks from different instrument serial numbers, potentially creating bad data. These fixes apply to all OOI pCO2 data. Users who have pCO2 data products generated prior to 4 February 2020 are encouraged to re-request their data to ensure that the correct interpolation code is applied.
Any questions about this data fix, or any other OOI data issues, should be directed to help@oceanobservatories.org.
Images
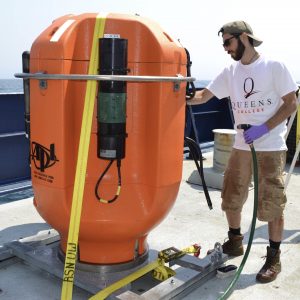
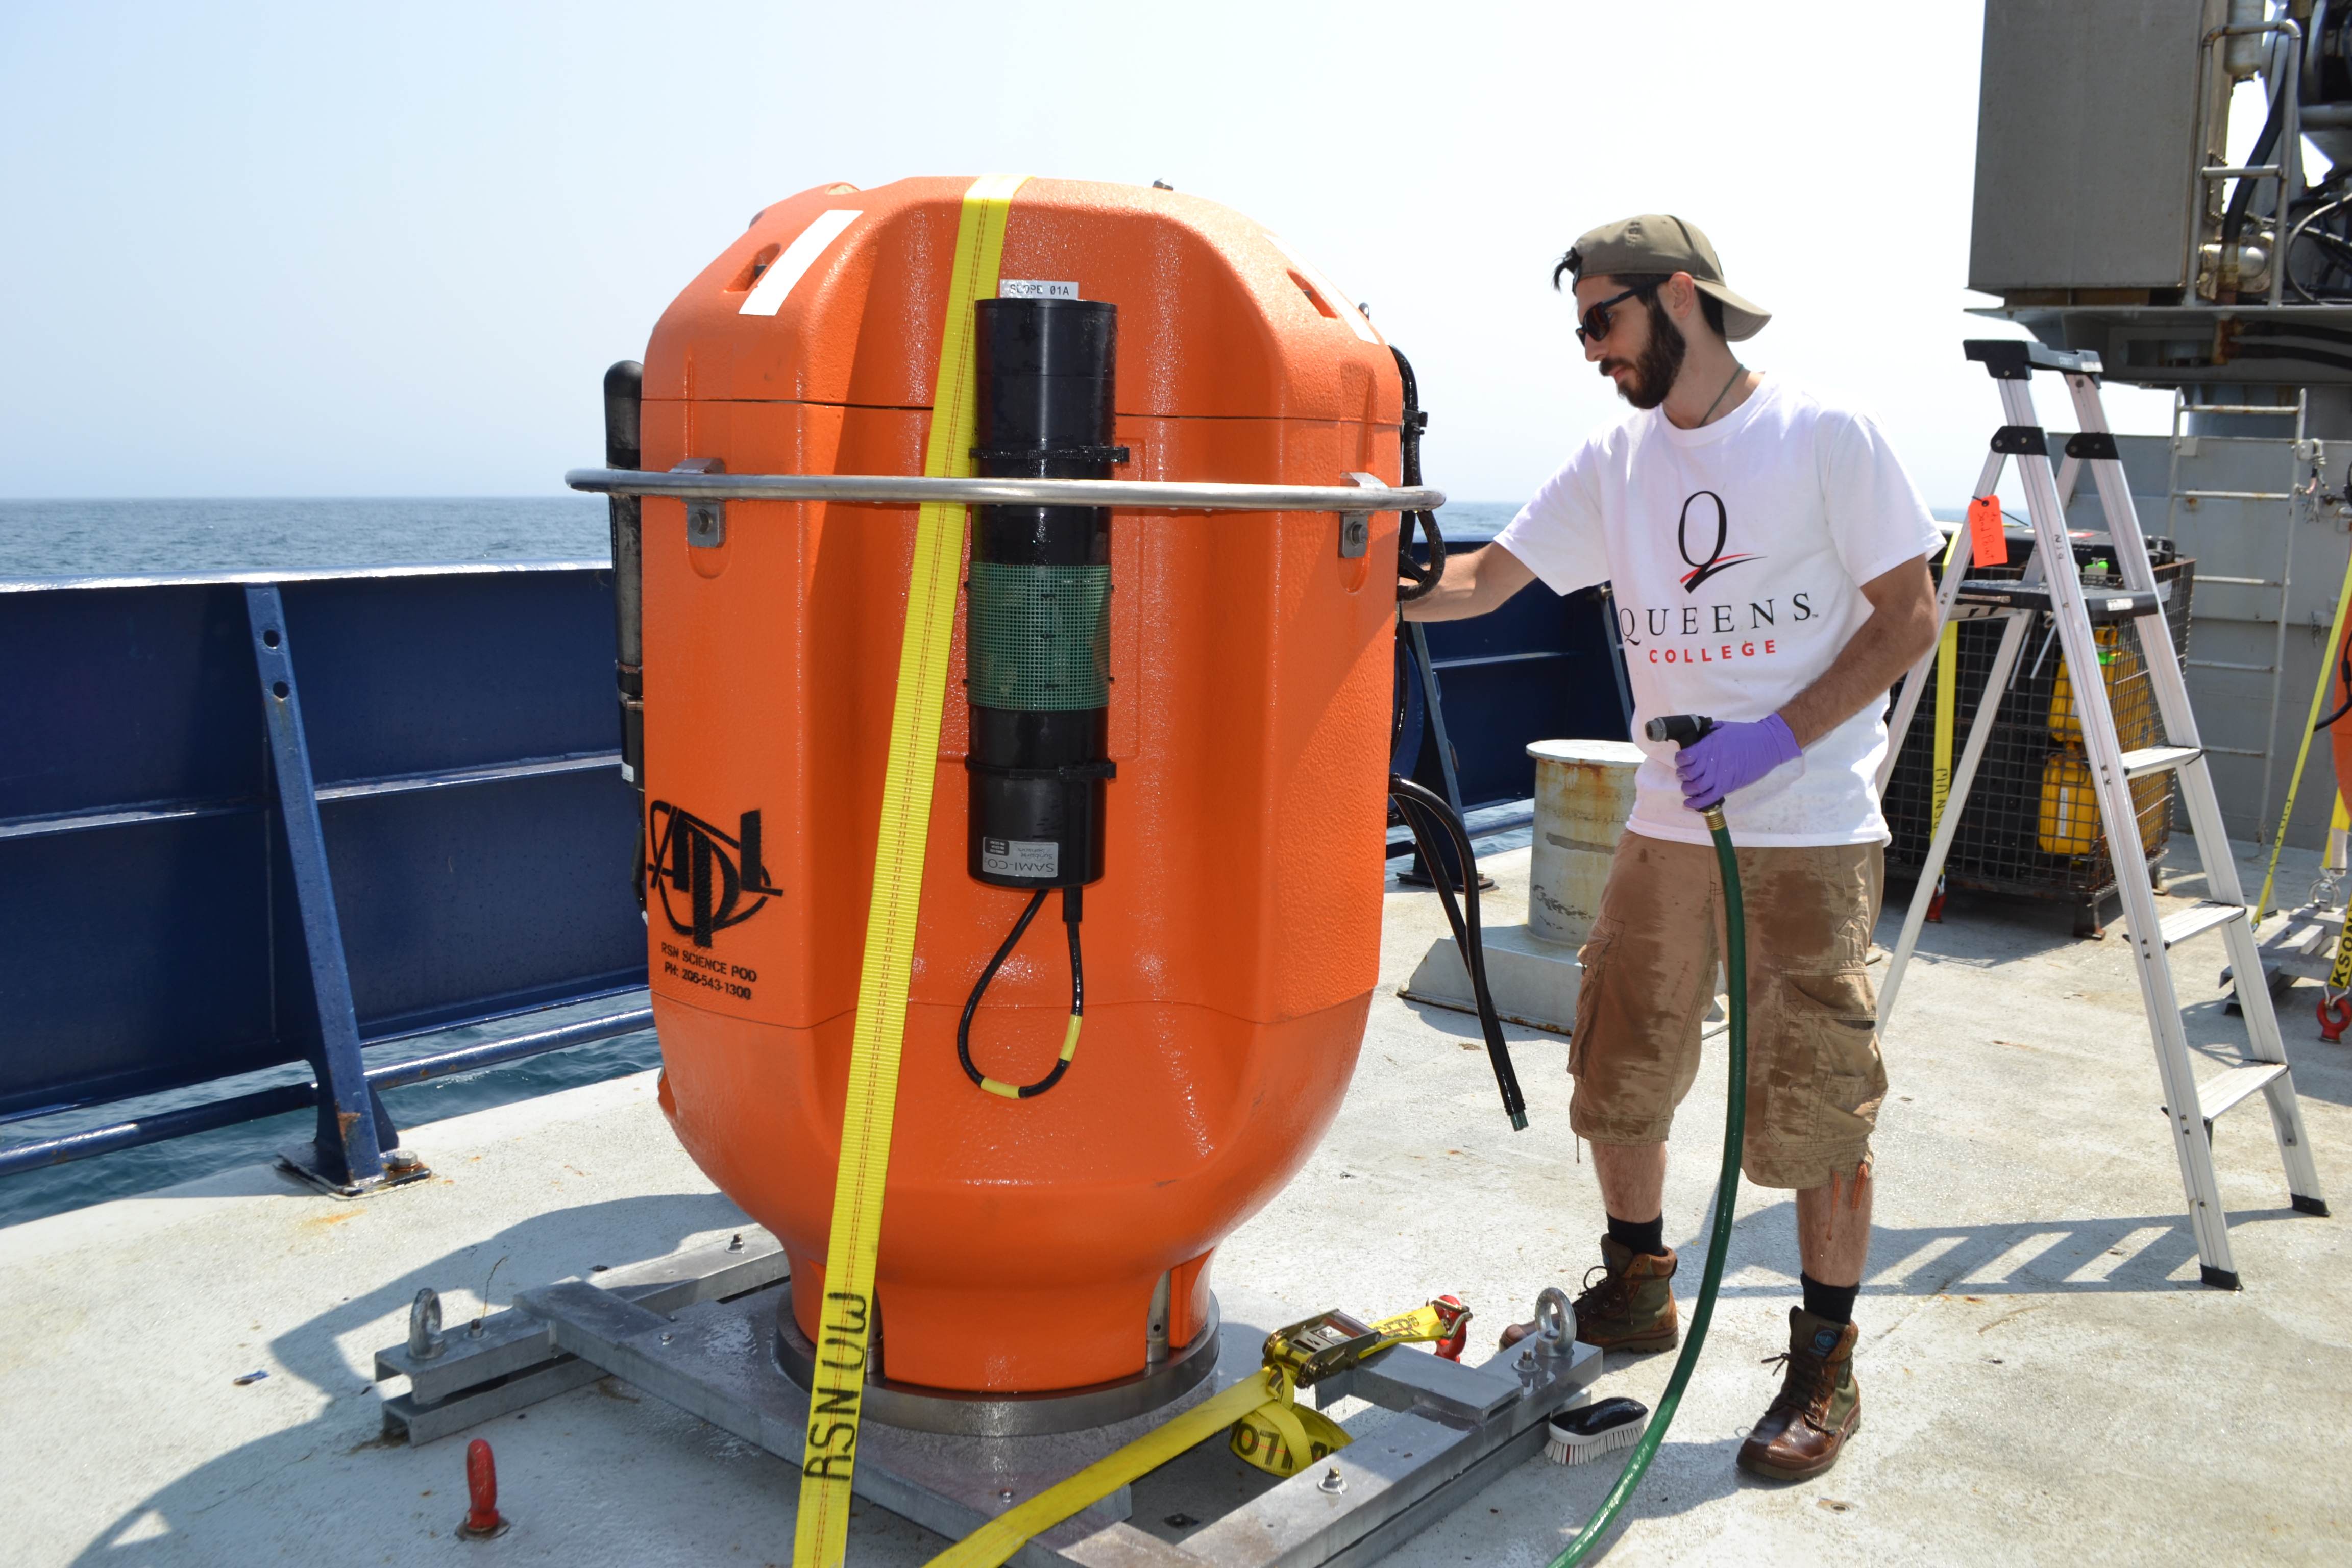
Top: Alex Andronikides, a VISIONS’17 student from Queens College, New York helps clean a Regional Cabled Observatory Shallow Profiler Mooring science pod that was installed off the Washington-Oregon coast. Credit: M. Elend, University of Washington, V17.
Bottom: Pre-deployment photo of a Sunburst SAMI-CO2 sensor attached to the Oregon Offshore Cabled Shallow Profiler pod, which moves up and down in the water column between 200 meters and near the surface off the coast of Newport, OR. Credit: M. Elend, University of Washington, V19.
Read MoreAssessment of OOI Endurance Array pCO2 Data Quality
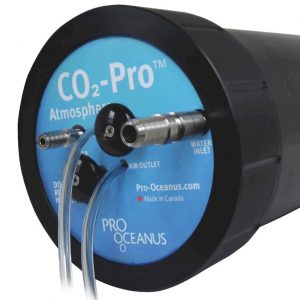
Given the significant importance of understanding and modeling levels of carbon dioxide in our atmosphere (and its potential sources and sinks), Ocean-Atmosphere Exchange and Global Biogeochemistry and Carbon Cycling are two of the OOI’s primary science themes. We address these themes in part through measurements of the air and surface water partial pressure of carbon dioxide (pCO2). Chris Wingard, the OOI Endurance Array Data Lead, recently completed an in-depth assessment of pCO2 data returned during the first four years of Endurance Array operations. These measurements were made using the Pro-Oceanus CO2-ProTM Atmosphere pCO2 sensor. By measuring the partial pressure of CO2 gas in both the air and surface water, researchers can estimate estimate surface flux of CO2 using data from this instrument. 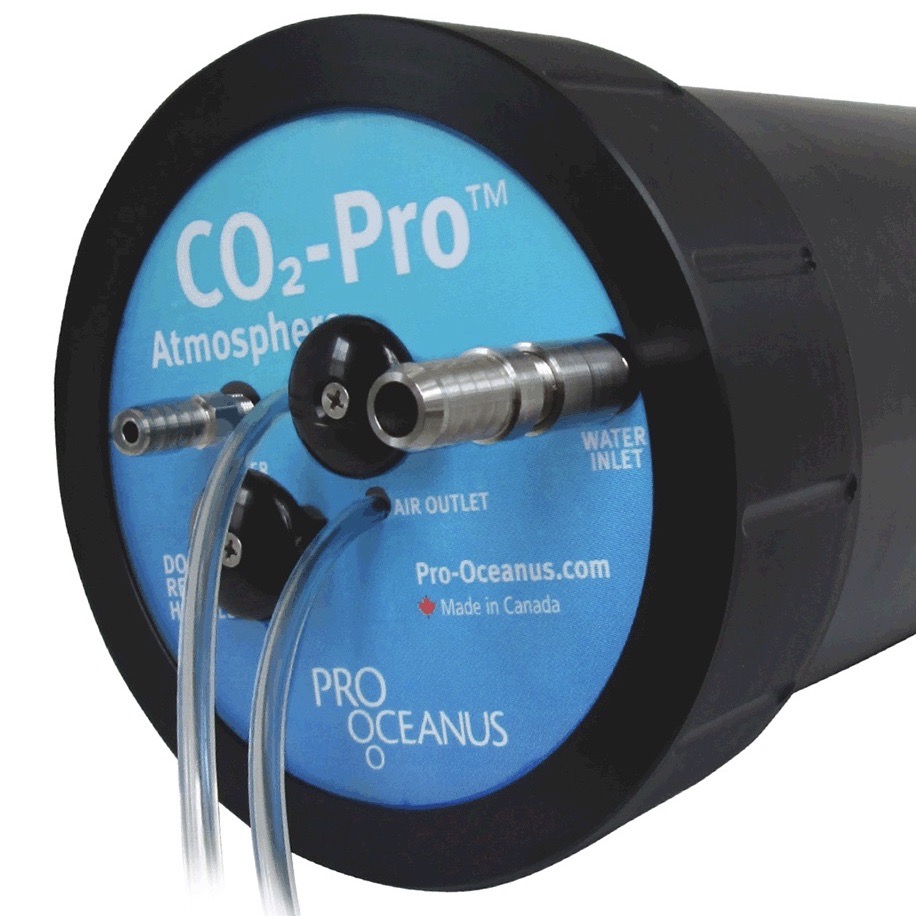
Wingard developed a protocol based on cross-comparisons of overlapping deployments of this sensor, comparing these with independent shipboard pCO2 measurements (including CTD samples and samples taken underway using flow-thru systems), and externally sourced air and surface water pCO2 measurements (e.g. from the LDEO Underway Database). This array of sampling techniques served to confirm the quality and scientific applicability of the Endurance Array pCO2 measurements.
He reported the results of this assessment at a poster session at the recent Ocean Sciences 2020 meeting held this past February in San Diego, CA. The protocol is largely applicable to the same suite of measurements made using the Pro-Oceanus sensor on moorings deployed in the OOI Pioneer, Irminger Sea, Southern Ocean, and Argentine Basin Global Arrays. The MATLAB code and data used to download, process, merge, and cross-compare the data used in this assessment are available online for use.
Both the air and surface water measurements and the flux estimates used in this assessment are available through the OOI Data Portal. Endurance Array air and surface water pCO2 measurements are made at four locations distributed across the Oregon and Washington shelf and slope within the northern California Current Marine Ecosystem.
Other sources of Endurance Array-specific data include the most recent 60 days of the Endurance Array’s air and surface water pCO2 data are available on the NANOOS Visualization System (NVS) and the Global Ocean Acidification Observing System Data Portal (GOA-ON).
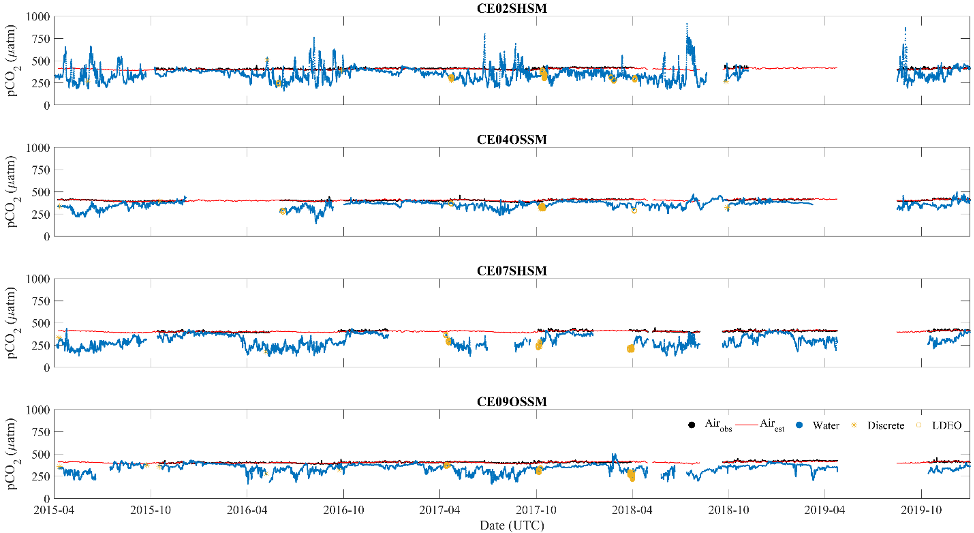
Figure 1: Surface water (•) and air pCO2 (•, observed and —, array average) measurements from 2015-04-01 through 2019-12-31 for the four moorings. The plots also show the distribution of discrete sample (*) and LDEO V2018 (O) data that coincide with each mooring. The data plotted have had human-in-the-loop (HITL) QC flags applied to remove points marked as suspect or failed. Beyond smoothing the data records and the estimation of an array averaged air pCO2 (—), no further corrections were applied to the data. Note the high degree of variability during the summer months in the surface water pCO2 measurements for CE02SHSM, which are similar to other observations made on the Oregon Shelf (Evans et al., 2011).
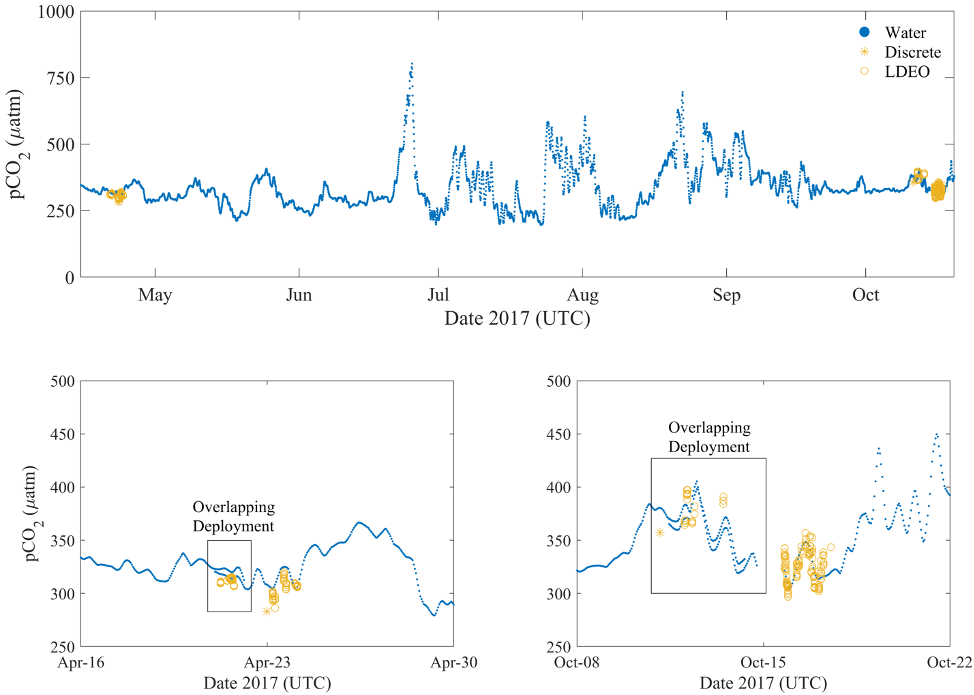
Figure 2: Focused view (upper panel) of the Spring 2017 deployment (#5) of CE02SHSM showing the observed offsets between the surface water pCO2 measurements (•) and the discrete samples (*) and LDEO V2018 (O). Detailed views in the lower two panels, provide a better picture of the observed offsets during the periods of over-lapping deployments; between deployments 4 and 5 (lower left) and deployments 5 and 6 (lower right). Prior to using the OOI pCO2A data, users are strongly encouraged to conduct such cross-comparisons. The independent measurements obtained by the separate systems, and the close agreement between them, provide measures of confidence in the accuracy and applicability of the data.
Read MoreEasy-to-use MATLAB Data Tools
OOI data team members have developed a new toolbox for downloading data from the Machine-to-Machine (M2M) interface using MATLAB, making data access as easy as 1, 2, 3. The work expands on the existing tools available on OOI. This new toolbox covers data from moorings, gliders, and profilers in the OOI Coastal Arrays and can easily be extended to other research platforms. A video tutorial on how to use this new tool is provided above. (A pdf of the tutorial is provided below).
In three short steps – define the mooring, node, and instrument – users can easily and quickly access relevant OOI data. “This new approach eliminates some steps and makes it easy for anyone to find and access data they are looking for, “said Jonathan Fram, OOI Endurance Array Project Manager at Oregon State University (OSU). “We found this new approach really streamlined data access using the M2M interface and we are certain other OOI data users will find it similarly helpful.”
Developed by OOI OSU team members, Craig Risien and Russ Desiderio, these new tools are part of our ongoing effort to simplify access to OOI data to encourage its broader integration into scientific research and classroom content. A tutorial showing how to use MATLAB to access OOI data can be viewed here.
Other members of the OOI OSU team, Chris Wingard and Ian Black, are testing Python and R tools to explore OOI data, as well. Once the tools have been tested and vetted, they will be available along with other community-generated tools here.
This new tutorial adds to others that have been developed to help users integrate OOI data into their science.
Read MoreMetadata Review Improves OOI Data
OOI’s data teams have just completed an extensive, year-long review of critical metadata to ensure the quality and usability of data for OOI data users. The review covered data collected through the end of 2019 and included instrument calibration coefficients, instrument deployment assignments, and deployment dates. Moving forward, all metadata verification will conform to the standards established during the review.
“Our reason for undertaking this review was no more complicated than to make the data better for our data users,” explains Jeffrey Glatstein, Senior Manager of Cyberinfrastructure and OOI Data Delivery Lead. “It is the first time since the inception of the program that we’ve really gone in and looked at the metadata from top to bottom. If there was a calibration that was off, a depth missing, or something misspelled, we found it.
“This intense and deliberative review process brought historic metadata up to current standards to ensure continuity, completeness of records, and consistency in how metadata are reported now and moving forward.”
The data teams used a combination of human review and an automated script development process to identify and correct data issues. The human-in-the-loop (HITL) process ensured that two sets of eyes verified each metadata product, whenever possible, while the scripts performed automated verification and generated reports to pass back into the HITL workflow.
“This initiative is part of ongoing OOI efforts to make its data more accessible, user friendly, and integrated into ongoing science,” adds Glatstein.
Check Previously Downloaded Data
The OOI Data Portal operates on a process-on-demand model, which means that data downloaded prior to the end of 2019 should be checked to see if relevant metadata has been modified.
Users can check to see if changes were made to relevant metadata by clicking here. This link provides a searchable database by array, platform, and instrument to help ensure that previously downloaded data are correct or if they need to be re-downloaded so users are working with the best available data. The OOI data teams are continuing to verify the historical deployment assignments/dates, and the results will be updated accordingly
[feature]A Gargantuan Effort
As part of the transition of OOI to 2.0 in October 2018, the RCA data team initiated a comprehensive audit of all critical metadata to ensure that data products served by the OOI Cyberinfrastructure system meet Quality Assurance/Quality Control standards set by the program and expected from the user community. This daunting task included the examination of over 700 calibration files from 2013 to the present. The results of this audit were used to aid in evaluation of current processes and guide in adapting workflows to improve QA/QC efforts and communication to the users, a vital component to building confidence in the OOI datasets as reliable and valuable resources that can be used in scientific research and education.
Wendi Ruef, Research Scientist, Regional Cabled Array
The CGSN Data Team worked carefully and methodically through thousands of files containing over 30,000 calibration coefficients and other critical metadata. We now have a high level of confidence in past metadata and a strong process for continued review going forward.
Al Plueddemann, Chief Scientist, Coastal Global Scale Nodes
[/feature] Read More