
Posts by Darlene Trew crist
Two OOI Expeditions in Two Oceans
11th Recovery and Deployment of Global Station Papa and Irminger Sea Arrays
Two OOI Global Scale and Nodes (CGSN) teams are working simultaneously, but in different waters on opposite sides of the United States during June. The first CGSN team left Seward, Alaska aboard the R/V Sikuliaq on May 29 for a 17-day expedition to recover and re-deploy the Global Station Papa Array in the Gulf of Alaska. On June 2, a second CGSN team will depart from Woods Hole, MA to travel to the Irminger Sea Array aboard the R/V Neil Armstrong for a month-long expedition to recover and re-deploy this array.
The expeditions share similarities and differences. Both arrays are in remote locations. The Station Papa team has a 2.5-day transit to the array site in the Gulf of Alaska, while the Irminger Sea team has a longer transit of eight days to the array site. Once onsite, the teams will get to work quickly to deploy the replacement moorings to allow for overlapping measurements before recovering the moorings currently in place. This is the 11th time that each array has been turned – that is, existing ocean observing equipment at the sites will be recovered and replacement equipment will be deployed in their place. Such “turns” are needed to address biofouling of sensors, depletion of batteries, and wear and tear on equipment that has been battered by wind, waves, and weather for a year.
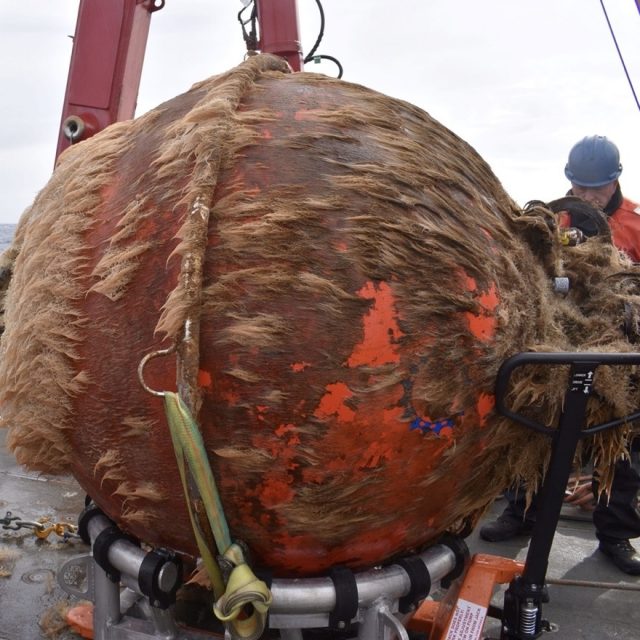
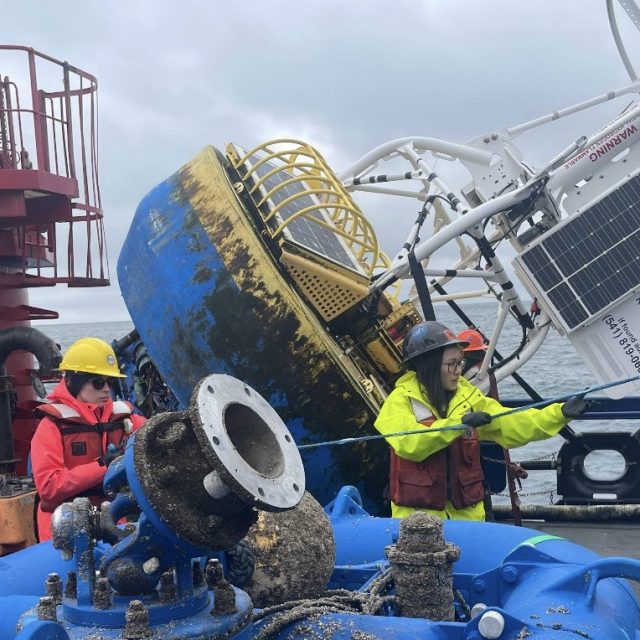
[media-caption path="https://oceanobservatories.org/wp-content/uploads/2024/05/Biofouling.jpg" link="#"]This is what one year in the ocean looks like: a Global Station Papa flanking mooring 64” sphere with 12 months of marine growth. Marine growth can inhibit the operation of the mooring and instruments and is one of the reasons we need to recover and refurbish the OOI infrastructure on a regular basis. Credit: Rebecca Travis © WHOI.[/media-caption]The Global Station Papa Array is located in the Gulf of Alaska, about 620 nautical miles offshore in a critical region of the northeast Pacific with a productive fishery subject to ocean acidification, low eddy variability, and impacted by the Pacific Decadal Oscillation. The Global Irminger Sea Array in the North Atlantic is located in a region with high wind and large surface waves, strong atmosphere-ocean exchanges of energy and gases, carbon dioxide sequestration, high biological productivity, and an important fishery. It is one of the few places on Earth with deep-water formation that feeds the large-scale thermohaline circulation.
“Because of their remote locations, both Station Papa and the Irminger arrays provide critical ocean data that scientists are using to better understand ocean circulation patterns and help identify changes in ocean conditions,” said Sheri N. White, Chief Scientist for the Irminger 11 expedition. “These arrays are hard to get to and to maintain but the data they provide are invaluable.”
Expedition Activities
A team of 11 scientists and engineers aboard the R/V Sikuliaq departed from Seward on May 29 for a 17-day expedition. During their time at sea, they will recover and deploy three OOI subsurface moorings and two open ocean gliders. They also will recover and deploy a Waverider mooring for the University of Washington. A POGO Fellowship awardee will be onboard to gain shipboard experience as part of OOI’s collaborative efforts to provide early career scientists opportunities to help increase their knowledge and advance careers. Other onboard activities will include water sampling at the deployment sites and collection of shipboard underway data.
[media-caption path="https://oceanobservatories.org/wp-content/uploads/2024/05/Irminger-gliders.jpeg" link="#"]The OOI CGSN science team will start operations at the Irminger Array by deploying two gliders. This allows the gliders to be monitored by the pilots onshore and ensure all systems are operational while the vessel is still onsite performing mooring operations. These gliders will operate autonomously at Irminger for ~12 months. Credit: John Lund © WHOI.[/media-caption]On the east coast, a second team of 15 scientists and engineers aboard the R/V Neil Armstrong will leave Woods Hole, Massachusetts on June 2 to begin their eight-day transit to the Irminger Sea. Once onsite, the team will recover and deploy four OOI moorings, deploy two gliders, recover a third, and conduct water sampling at the deployment sites. Underway shipboard data will also be collected throughout the voyage. Four additional subsurface moorings will be “turned” for the Overturning in the Subpolar North Atlantic Project (OSNAP). Water and biogeochemical sampling will be conducted in support of both OSNAP and researchers from Boston College. A marine mammal observer from NOAA will be onboard as a continuing collaboration between NOAA and OOI.
Added White, “When planning these expeditions, we do our best to maximize use of ship time by providing berths to researchers who could benefit from direct observation and data collection in these remote locations. During the expedition to Irminger, for example, we will be joined by a graduate student and two undergraduate students from Boston College who will collect biogeochemical data, and experience what it is like to do science at sea.”
A bird’s eye view of a previous Irminger Sea Array expedition:
[embed]https://www.youtube.com/watch?v=LF6Zhmlmd0A[/embed]Daily reports will be filed from both expeditions. Bookmark this site to follow along.
Read More
Close-up View of An Active Hydrothermal Vent Now Easily Accessible
Now accessible on OOI’s Data Explorer: 47,000 hours of video from a high-definition (HD) camera at an active hydrothermal vent and underwater volcano, 1500 meters below the ocean’s surface!
The HD camera has been streaming live video since 2015, offering a close-up look at what’s been happening within the caldera of Axial Seamount, a highly active underwater volcano about 300 miles off the coast of Oregon. The SubC 1Cam video camera was modified by the Applied Physics Lab (APL) at the University of Washington for deployment on OOI’s Regional Cabled Array (RCA) in the NE Pacific Ocean. The camera is connected via a roughly 4 km dedicated 10 Gb extension cable that runs across the caldera from the camera in the ASHES vent field to Primary Node PN3B located near the eastern edge of the caldera. From there imagery are streamed at the speed of light over 521 km of submarine fiber optic cable to the shore station in Pacific City, OR.
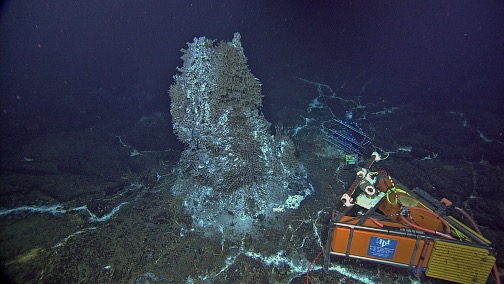
[media-caption path="https://oceanobservatories.org/wp-content/uploads/2024/05/HD-Camera.jpg" link="#"]The HD camera (orange triangular frame) images the 14 ft-tall actively venting hot spring deposit ‘Mushroom’ located within the caldera of Axial Seamount. Credit: NSF-OOI/UW/CSSF; Dive R1730; V14.[/media-caption]Up until recently, the footage has been available on the OOI raw data server in 14-minute increments as both high resolution MOV files and compressed MP4 formats, but the imagery was not easily reviewed or searchable. To make this unique nearly decade of footage more readily available to researchers, a new gallery feature on Data Explorer was created that allows researchers to easily view, search, and download the stunning video. All files created over each 24-hour period are used to create a sped-up, compressed, and time-stamped preview video allowing rapid overviews of daily events. Associated metadata and quick links provide access to the raw and log files, and a higher-resolution version of the preview is also available for download.
“The camera faces an active hydrothermal edifice called Mushroom that is completely encased in a dense biological community thriving in fluids emanating from the chimney walls,” explained Michael Vardaro, a research consultant for the RCA, who has been involved in OOI since construction began in 2011. “Mushroom hosts an active chemosynthetic community with 300 ºC hydrothermal fluids streaming out its top and from a small, highly dynamic chimney at its base. The camera allows the research community to see how the flow of hydrothermal fluid and the activity of all the different creatures living on it change over time, as well as the growth and evolution of the sulfide structure.”
Vardaro also said that the video allows viewers to watch what is happening in the short term. “You can catch predation events that include little scale worms nibbling on the gills of the tube worms. You can observe sea spiders [pycnogonids] crawling around the base of the chimney and watch as new vent openings develop. It’s a very changeable environment, because as the hydrothermal fluid hits the cold seawater, the metals and other chemicals dissolved in the superheated water precipitate out as solid minerals, creating fragile projections that then repeatedly crumble over time as the flow changes. The camera imagery provides important insights into linkages among geological, chemical and biological process at seismically active underwater volcano that has erupted in 1998, 2011, and 2015 and is poised to erupt again.”
[embed]https://youtu.be/oiDxkHWB3rI[/embed]The chimney stands about 14 feet high. The camera sits on a tripod at the base of the chimney with a pan and tilt unit. It follows an automated, 14-minute routine with the camera moving up, down and across the chimney and water column, stopping at pre-selected key areas of interest. What’s more, the APL team onshore can stop and alter the viewpoint if something interesting is happening or a question needs answering. “The Data Explorer now offers a hugely rich dataset of video footage extremely rare in mid-ocean ridge settings that offers a unique window into what is happening on the seafloor at an active hydrothermal vent site,” Vardaro added. “As development on the gallery continues, we also plan to add annotations and eventually incorporate machine learning and event detection to tag interesting biological features or significant changes to the site”.
In addition to the Data Explorer access, the live video stream is available every three hours for 14-minutes online (at 2:00, 5:00, 8:00, and 11:00 EDT & PDT). The camera also runs for 24 hours straight on the 10th and 20th of the month, with a 72-hour run on the 1st-3rd of the month as a means of gaining a fuller picture of activity at the site.
[embed]https://youtu.be/VjqduffxNyU[/embed]
Read More
Funds Available for Using OOI and Other Long-Term Research Associated Data
On April 23, 2024, the U.S. National Science Foundation (NSF) issued a Dear Colleague Letter: Using Long-Term Research Associated Data (ULTRA-Data). This program encourages proposals that take advantage of the multidisciplinary, long-time series measurements through programs such as the Ocean Observatories Initiative (OOI), the National Ecological Observatory Network (NEON), and Long-term Ecological Research (LTER) and others that collect environmental data, make observations, test hypotheses, and, in some cases, conduct experiments.
Funding for the ULTRA-Data proposals will come from participating NSF divisions and offices including the Geosciences and Biological Sciences. OOI PIs are able to participant in proposal preparation and, if funded, research activities, as long as the work is separate from OOI-supported activities. NSF will look closely at submissions that include OOI personnel, so discussion before submission is strongly recommended.
Read MoreWidespread and Increasing Near-bottom Hypoxia in Pacific NW Coastal Ocean
Barth et al. (2024) examined the 2021 summer upwelling season off the United States Pacific Northwest coast. Upwelling was unusually strong leading to widespread near-bottom, low-oxygen waters. During summer 2021, an unprecedented number of ship- and underwater glider-based measurements of dissolved oxygen were made in this region. Near-bottom hypoxia, that is dissolved oxygen less than 61 µmol kg−1 and harmful to marine animals, was observed over nearly half of the continental shelf inshore of the 200-m isobath, covering 15,500 square kilometers. A mid-shelf ribbon with near-bottom, dissolved oxygen less than 50 µmol kg−1 extended for 450 km off north-central Oregon and Washington. Spatial patterns in near-bottom oxygen are related to the continental shelf width and other features of the region. Maps of near-bottom oxygen since 1950 show a consistent trend toward lower oxygen levels over time. The fraction of near-bottom water inshore of the 200-m isobath that is hypoxic on average during the summer upwelling season increases over time from nearly absent (2%) in 1950–1980, to 24% in 2009–2018, compared with 56% during the anomalously strong upwelling conditions in 2021. Widespread and increasing near-bottom hypoxia is consistent with increased upwelling-favorable wind forcing under climate change.
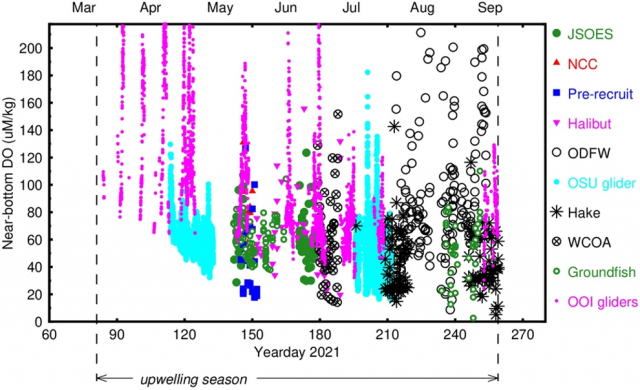
As part of their analysis, Barth et al. (2024) used NSF OOI glider data from 2021 along the Newport Hydrographic Line along with other data indicated in Fig x.. Near-bottom dissolved oxygen data from each survey as a function of time show the typical decrease of minimum values as the summer hypoxia season proceeds (Fig. x). High DO values are measured by the OOI gliders early in the upwelling season when winds were relaxed or downwelling-favorable early in the upwelling season, and by the Oregon Department of Fisheries and Wildlife (ODFW) survey that focused on very shallow (water depths of 50 m or less), inshore waters.
[media-caption path="https://oceanobservatories.org/wp-content/uploads/2024/05/Endurance-Figure.png" link="#"]Figure x Near-bottom dissolved oxygen as a function of time during the 2021 summer upwelling season.[/media-caption]__________________
Reference:
Barth, J.A., Pierce, S.D., Carter, B.R. et al. Widespread and increasing near-bottom hypoxia in the coastal ocean off the United States Pacific Northwest. Sci Rep 14, 3798 (2024). https://doi.org/10.1038/s41598-024-54476-0
Read MoreOOI Data Sonification
The assumption that quantitative data can be well represented not only in charts and graphs, but by increasingly sophisticated visual displays, is often taken for granted. However, researchers, instructors, and curators of museums and science centers also recognize that even the most sophisticated visual displays are inaccessible to those with low-vision or blindness. There is also the potential for alternative data presentation methods to improve understanding of complex data for sighted individuals. With these considerations in mind, a team led by Dr. Bower (WHOI) has pursued the creation of auditory displays or “data sonifications” using multi-disciplinary U.S. National Science Foundation Ocean Observatories Initiative (OOI) data sets as the basis. The results to date from the NSF-funded data sonification project are reported in a recent publication by Smith et al. (2024).
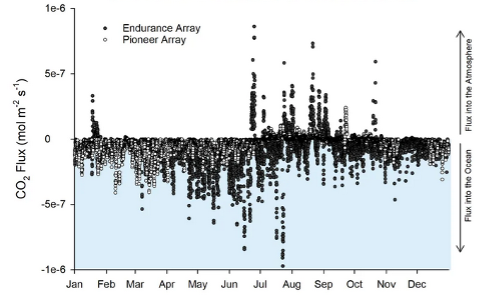
[media-caption path="https://oceanobservatories.org/wp-content/uploads/2024/05/Data-Sonification-figure.png" link="#"]Figure 1. Time series data from two data nuggets created by Ocean Data Labs that were used for sonification. Surface meteorology during the passage of hurricane Hermine over the Pioneer Array in 2016 (upper). The CO2 flux between ocean and atmosphere for both Pioneer (open circles) and Endurance Arrays during 2017 (lower).[/media-caption]Data sonification involves the mapping of quantitative data from its original form to audio signals in order to communicate complex information content. The project team was interested in using actual ocean data spanning a variety of oceanographic disciplines. Time series data produced by OOI sensors provide an excellent starting point. In particular, the Ocean Data Labs group at Rutgers has reviewed OOI data and created a set of “data nuggets” that are appropriate for sonification (Greengrove et al., 2020). The data nuggets comprise a broad range of oceanographic phenomena observed by OOI sensors, including response to a storm, the diurnal migration of zooplankton, a volcanic eruption, and the flux of CO2 between ocean and atmosphere.
The project team used a rigorous approach to developing and refining the auditory presentations. Starting with a set of learning objectives for each data nugget, a multi-step process was used to create the sonification. First, oceanographers were interviewed to establish the important points to be conveyed for a given data nugget. Next, classroom instructors were interviewed to get feedback on the most effective approaches to using sound to explain data properties. A sound designer then created an initial mapping of the data to sound, which was reviewed by a representative group of researchers, instructors, and blind and visually impaired listeners. After additional rounds of refinement and feedback, the prototype sonifications are now available. Two auditory displays utilizing Pioneer Array data (Fig. 1) are available at https://doi.org/10.5281/zenodo.8162769 and https://doi.org/10.5281/zenodo.8173880 for CO2 flux and storm response, respectively. Other examples can be found in Smith et al. (2024). The sonifications will be evaluated broadly using an on-line survey and by a “live audience” at museums and science centers.
This project is unique in exploiting the rich OOI data set and making ocean science highlights available to a broad community of students and the general public. A significant aspect of the work, as pointed out by the authors, is the systematic and inclusive approach used to develop the data sonifications. Results of the museum testing phase in 2024 will be awaited with great anticipation.
___________________
References:
Greengrove, C., S. Lichtenwalner, H.I. Palevsky, A. Pfeiffer-Herbert, S. Severmann, D. Soule, S. Murphy, L.M. Smith and K. Yarincik, 2020. Using authenticated data from NSF’s Ocean Observatories Initiative in undergraduate teaching, Oceanography, 33(1), 62-73.
Smith, L.M., A. Bower, J. Roberts, J. Bellona and J. Li, 2024. Expanding access to ocean science through inclusively designed data sonifications, Oceanography, 36(4), 96-101.
Read More
QARTOD Flag Statistics Using Cloud-Based Resources and Zarr Data Formats
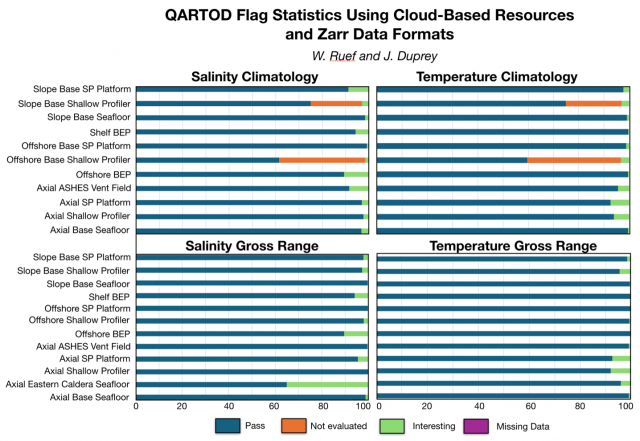
Central to the Regional Cabled Array (RCA) Quality Assurance/Quality Control (QA/QC) workflow is a cloud-based data harvest and visualization platform that allows for efficient and timely review of the high-frequency and high-density time series data streaming from RCA instruments. A key component of this workflow is a Zarr-based version of the OOI RCA data, a cloud optimized file format that stores metadata separately, allowing data chunks to be retrieved without loading the entire dataset. Using Zarr files and Amazon Web Services (AWS) cloud computing resources for QA/QC has made it possible to create a dashboard that is refreshed daily for multiple high-density datasets and parameters. This also results in minimization of both costs and OOI-Cyberinfrastructure load by appending only new data daily, with a full dataset refresh occurring only when necessary. Because the Zarr files contain time-series data records that include all variables served through M2M (Machine to Machine Learning), this workflow also allows for the efficient deep data review that is currently required for compiling and reviewing QARTOD (Quality Assurance/Quality Control for Real-Time Oceanographic Data) data flag tables.
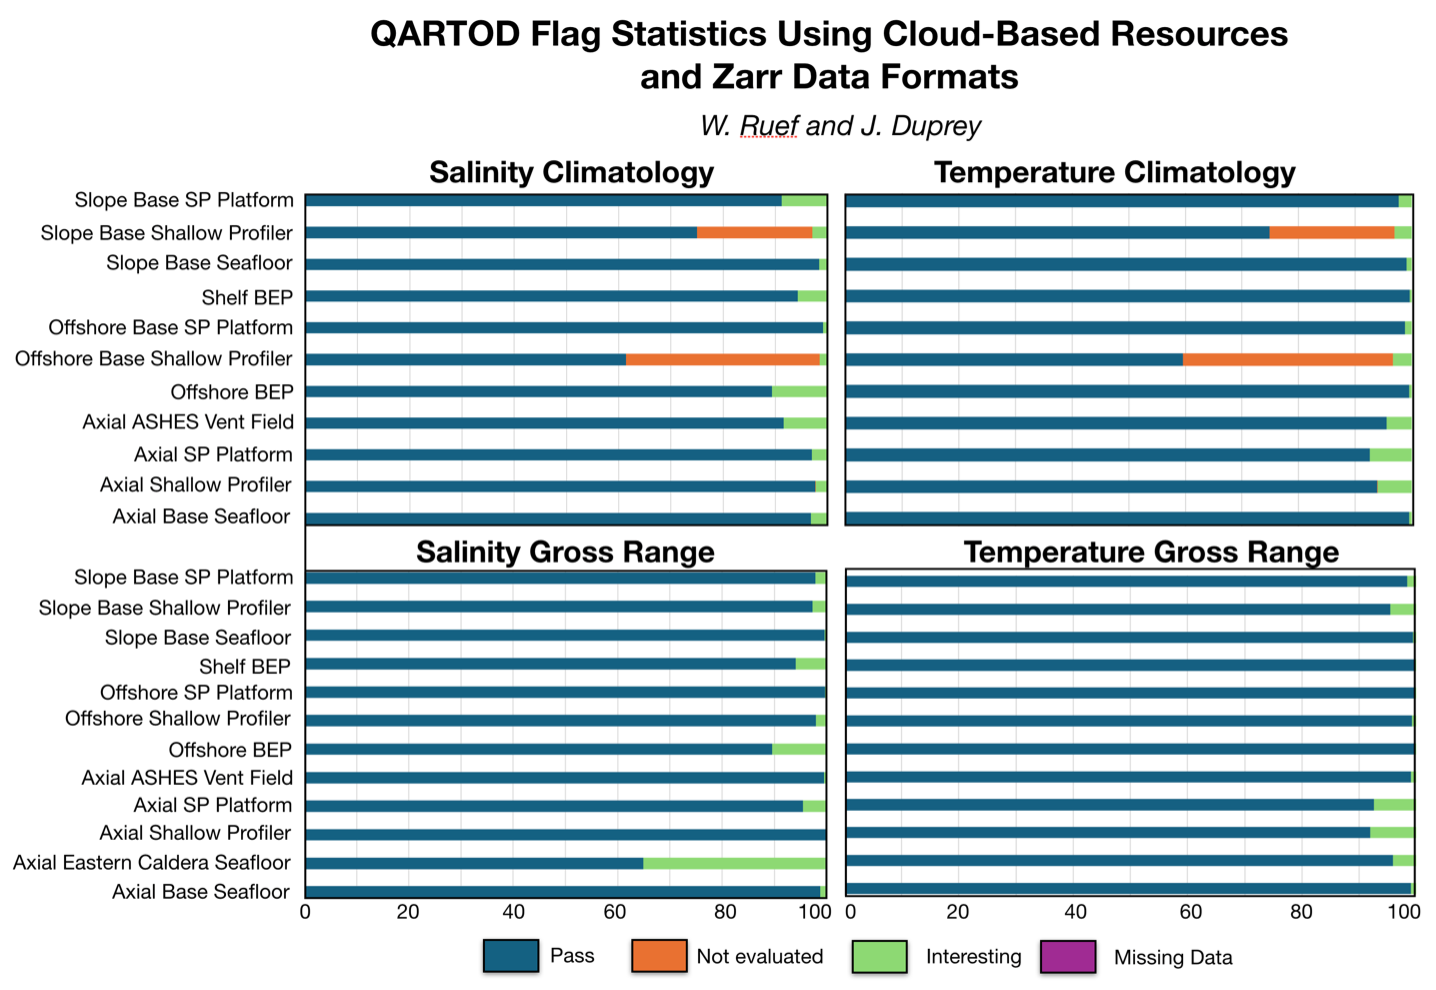
With the existing Zarr files, we were able to quickly access all active QARTOD flags in the RCA data streams for gross range and climatology and produce basic summary statistics for each parameter using minimal AWS cloud and data team resources. The figures above include the results from CTD (Conductivity, Depth, and Temperature) streams across the RCA for temperature and salinity, for both gross range and climatology QARTOD tests. In this initial compilation over 90% of all data points pass the gross range tests for temperature, and all except 2 pass gross range tests for salinity. Similar results were seen with the climatology tests, with nearly all streams having less than 10% of data points flagged as “suspect or interesting”. Most of the flags for non-passing data points in the climatology results were values of “not evaluated” in the Offshore and Slope Base Shallow Profiler streams. Our first set of investigations will focus on these streams to identify the cause for these flags. A suspected cause may be that the isoclines in the water column are not being accurately represented in the climatology depth bins.
Read More
Edson Encourages Federal Agencies to Use OOI Data
The U.S. National Science Foundation Ocean Observatories Initiative (OOI) Program Management Office Principal Investigator Jim Edson was invited to Pasadena, CA in April to present to a group of 160+ of experts who use satellite data to study the planetary boundary layer (PBL) over land, sea, and ice. These experts use observations and modeling to determine the PBL and represented an alphabet soup of federal agencies – NASA, NOAA, CLIVAR, DOE, ONR and NCAR. Edson took the opportunity to introduce them to OOI.
The attendees came together for NASA’s Decadal Survey Planetary Boundary Layer Incubation Community Meeting. Edson gave a presentation about observing the marine PBL using OOI and its partnership with the National Data Buoy Center and OceanSITES as examples of how to build an ocean network of observations.
“This presentation was one of my ongoing efforts to share knowledge about OOI and the data it can deliver,” said Edson. “By focusing on how valuable and rich the available data are, I hoped to re-enforce to our colleagues at these various agencies and institutions that OOI data are an important source for satellite calibration and validation activities over the open ocean. This represents only one of multiple ways that OOI can be used to clarify our understanding of what is going on in the rapidly changing marine environment.”
Read MoreRCA to be Offline on May 6 for Maintenance
Maintenance is scheduled on the Regional Cabled Array (RCA), which will require the system to be powered down at 0800 PT on Monday, 6 May. The system will be powered after completion of maintenance activities, but no later than 0800 PT on Tuesday, 7 May. Over the course of the week there may be temporary network interruptions as maintenance continues.
Read MorePioneer Array Operational at MAB
A move is declared
Months of toil undertaken
This day it is done
Coastal and Global Scale Nodes (CGSN) Principal Investigator Al Plueddemann penned the haiku above in recognition of the successful installation of the Pioneer array at its new location in the Mid-Atlantic Bight (MAB) on April 17, 2024. This momentous occasion occurred on Haiku Wednesday, which prompted the poetic marking of a three-year effort to have the array deployed and telemetering data from the MAB.
The relocation of the Pioneer Array from its former location off the New England Shelf (NES) to its new location was a multi-tiered process. The National Science Foundation (NSF) joined forces with the Ocean Observatories Initiative Facility Board (OOFIB) to host a series of workshops in 2021 to elicit community input on where a relocated Pioneer Array might best meet science and educational needs. Based on input from these community workshops, the NSF gave its approval to the MAB site and the process was launched.
“Completing installation of the Pioneer Array in the MAB was the culmination of three years of preparation, which began with planning workshops in 2021, the recovery of the NES array in 2022, and engineering, procurement, and testing in 2023,” said Plueddemann, who also served as the Chief Scientist aboard the R/V Neil Armstrong for the first deployment of the array in the MAB. “It took an incredible effort from the whole CGSN Team to address all the considerations in moving the array to its new location. It is gratifying to see the successful deployment, with new, multidisciplinary data now available from this important oceanic region.”
[media-caption path="https://oceanobservatories.org/wp-content/uploads/2024/04/New-shallw.jpg" link="#"]Two newly designed shallow water moorings were deployed at the Pioneer MAB site. These specially designed moorings allow a wave-powered profiler to span the upper 80% of the water column in water depths as shallow as 25-30 m. Credit: Sawyer Newman © WHOI.[/media-caption]The primary objectives for the April cruise included installation of three surface moorings, five profiler moorings, and two newly designed shallow water moorings. The moorings create the backbone of MAB Array, a frontal-scale, T-shaped array located off the coast of Nags Head, North Carolina, starting ~25 km offshore and extending ~50 km east/west and ~50 km north/south across the continental shelf. The ten moorings occupy seven sites; three sites contain both a surface mooring and a profiler mooring. In order to provide synoptic, multi-scale observations of the outer shelf, shelf break, and continental slope, the moored array is supplemented by four gliders and two AUVs. The gliders operate for 45-90 days at a time, provide transects along and across the shelf, and monitor the mesoscale field of the slope sea. The AUVs are deployed and recovered from the ship over a ~24 hr period and provide synoptic across- and along-front “snap shots” of the frontal region.
[media-caption path="https://oceanobservatories.org/wp-content/uploads/2024/04/NESLETER.png" link="#"]Collaboration between OOI and the Northeast U.S. Shelf (NES) Long-Term Ecological Research (LTER) project began in 2017 and continued during this deployment expedition.Taylor Crockford was onboard to deploy an Imaging FlowCytobot (IFCB) that continuously sampled seawater while the Armstrong was underway. Shown here are some of the creatures living in the seawater along the route. Credit: Taylor Crockford © WHOI.[/media-caption]Once the deployment was in place, the team turned its attention to additional expedition objectives, including a bathymetry/sub-bottom survey of a potential alternate Western mooring site, and cross-shelf and along-shelf CTD (conductivity, temperature, and depth) transects. Once those were completed, the team headed home aboard the R/V Neil Armstrong to its home port in Woods Hole, MA where they were heartily greeted for a job well done.
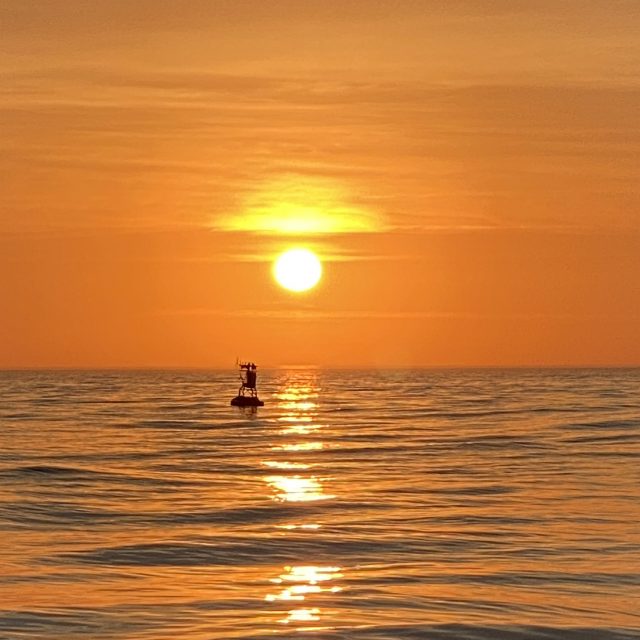
[media-caption path="https://oceanobservatories.org/wp-content/uploads/2024/04/Sunrise-17-April-Ryder-2-scaled.jpg" link="#"]The sunrise was captured on 17 April over the Northern Offshore Surface buoy, highlighting the completion of the installation of the Pioneer Array in its new location in the Mid-Atlantic Bight. Credit: Jim Ryder © WHOI.[/media-caption]A review of the day-to-day operations to install the Pioneer Array in the Mid-Atlantic Bight m can be found here.
Read MoreEndurance Team Overcomes All Challenges to Complete its 20th Expedition
“Early spring cruises always present some weather challenges and this year was no exception,” said Coastal Endurance Project Manager and Chief Scientist on the Endurance 20 Expedition Jonathan Fram.
For this, the twentieth NSF OOI Coastal Endurance Array cruise, conditions were typical for the time of the year in the northeast Pacific. Temperatures on deck ranged from 44-52 degrees F. Winds blew in from the north at a low of 5 and up to 25 knots. Wave heights were up to 12–15-foot swells. In short, there was a lot to contend with, which forced the R/V Sikuliaq and the Endurance 20 team to sit it out in port for two weather days, waiting for conditions to abate.
“We re-arranged the schedule to take advantage of intermittent weather windows and are pleased that we succeeded in accomplishing almost all of our mission objectives. We appreciate being one of the first cruises of the year because it allows us to get fresh moorings in the water around the time of spring transition. In spring, the predominant wind direction shifts to from the North, which upwells water along the West Coast.”
Despite the less-than-ideal working conditions, the Endurance 20 team and crew of the Sikuliaq got the job done. They successfully completed all cruise activities except for the deployment of the Washington Inshore Coastal Surface Piercing Profiler and one glider. Both had failed pre-deployment checks. Since both gliders and CSPPs can be deployed from smaller boats, the decision was made to hold their deployments. Ship reservation requests have already been made to get them into the water later this spring.
In total, the team recovered and deployed six surface moorings (two battery powered buoys and four large buoys powered by wind and solar energy), one offshore and two surface piercing profiler moorings (CSPP), and three gliders. One glider experiencing navigation issues was recovered. CTD casts (to measure conductivity, temperature, and depth) and water sampling were conducted along with each mooring operation.
[media-caption path="https://oceanobservatories.org/wp-content/uploads/2024/04/Sea-lions.jpeg" link="#"]California sea-lions haul out on Endurance Array shelf buoys during the day. These buoys ride higher at night, which corresponds to when the sea-lions leave to feed. Aluminum guards keep the sea-lions off the solar panels and prevent sea-lions from chewing wires and connectors. The team sprayed off biofouling after getting the buoy on board. Credit: Jonathan Fram, OSU.[/media-caption]The expedition marked several firsts: This was the first cruise in which all buoy deck solar panels on all moorings operated for the entire previous deployment. This was also the first deployment in which all buoys incorporated new sea lion guards, thanks to the idea and implementation by Deck Lead Alex Wick. This was also the first time that Raelynn Heinitz took the reins of deck lead from Alex Wick. There were other less notable firsts. A field of crab pots surrounded the Inshore Washington Mooring. One derelict pot was even found far offshore wrapped around the Washington shelf mooring. The crab pots posed extra hazards that the Sikuliaq and recovery team had to maneuver around.
[media-caption path="https://oceanobservatories.org/wp-content/uploads/2024/04/Crab-pots-.jpg" link="#"]Image of crab pots surrounding the ship as the R/V Sikuliaq and the Endurance 20 team were adjacent to the Washington Inshore Surface Mooring. The primary purpose of this radar is to detect sea ice, but it works well on crab pot floats too. The circle’s radius is ¾ nautical miles. Credit: Jonathan Fram, OSU.[/media-caption]In addition to the mission objectives, the Endurance Team successfully completed ancillary scientific operations. They helped scientific partners University of South Carolina researcher Eric Tappa and Oregon State University student Faith Schell recover and deploy a sediment trap adjacent to OOI’s Oregon Slope Base site. This is part of an ongoing research effort of OSU Associate Professor Jennifer Fehrenbacher and USC Professor Claudia Benitez-Nelson, who study the geochemistry, biomineralization, and marine biology of the sediments. The Team also deployed fish tag readers for OSU Assistant Professor Taylor Chapple to support his work studying sharks and other large marine predators.
“These ongoing collaborations with scientists are beneficial to everyone,” added Fram. “They not only maximize the use of ship time but increase the understanding of the areas in which we are gathering data. Plus, it’s great for us who do the data gathering to interact directly with the scientists who are using the data.”
A review of the day-to-day operations of the Endurance 20 Team can be found here.
Read More