
Multi-span distributed fiber sensing on the Ocean Observatories Initiative Regional Cabled Array
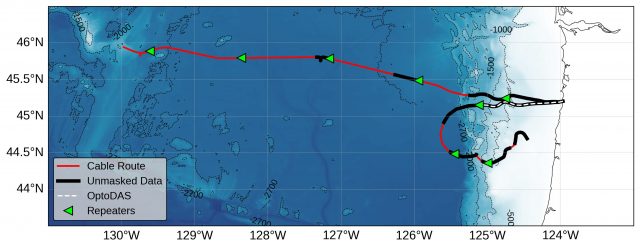
For 3 months beginning in November 2025, a team of scientists at the University of Washington comprising William Wilcock, Brad Lipovsky, Marine Denolle and Shima Abadi collaborated with Mikael Mazur and Nicolas Fontaine at Nokia Bell Labs to conduct a test of a novel multi-span distributed acoustic sensing (DAS) technique on the two submarine cables of the OOI Regional Cabled Array (RCA) extending off Pacific City, Oregon. DAS uses backscattered light to measure strain along a fiber with a spatial resolution of meters, creating a dataset that allows for diverse observations of submarine phenomena including earthquakes, ocean waves, and marine mammals. Previous DAS experiments on the OOI tested conventional DAS instruments to collect data over only the first portion of the cables before the first optical repeater, out to ~65 km on the northern cable and ~95 km on the southern cable. The DAS system tested in this experiment, provided by Nokia Bell Labs, uses the high-loss loopback couplers within optical repeaters to extend DAS measurements beyond repeaters to the entirety of a given seafloor cable (see Mazur et al., 2025). The northern OOI cable has a length of ~480 km and runs roughly perpendicular to shore, across the Juan de Fuca plate out to Axial Seamount. The southern RCA cable has a length of ~350 km and runs southward across the continental shelf, crossing onto the Juan de Fuca plate before looping eastward back towards shore.
On November 5 2025, the Nokia multispan DAS system was deployed on both the north and south cables of the RCA. Each of the RCA cables has two optical fibers, the transmit and receive fibers for the observatory data. The Nokia multispan DAS system sends light down the transmit fiber and receives backscattered light from each optical repeater via the receive fiber. The system was multiplexed such that data could be collected while the RCA continued operating. Data were collected continuously using this system until January 28 2026, with outages from November 12-18, December 8-9, and December 17-23. The spatial and temporal sampling rates were periodically varied, with channel spacing varying between 10-200 m.
Upon initial testing, it became clear that significant nonlinearities within the RCA fibers and an observatory-related synchronization signal on the fibers of both cables was distorting the data collection via strong crossphase modulation. These combined effects mean that significant portions of the cable did not record physically accurate data. Following investigation of these effects, starting on December 2, a spatial mask was applied to the data from both cables to limit the available data to only the portions that were minimally affected by the observatory noise. This spatial masking results in 165 km and 275 km of the northern and southern cable spans being saved, out to 300 km and 350 km maximum distance along the cable, respectively. These unmasked data includes portions beyond three repeaters on each cable. The spatially masked data still contains some non-physical noise, and should be treated with caution. Further investigation into the characteristics of this noise are ongoing and updates will be made to the documentation moving forward. Data post-processing also revealed that, due to latency in the processing chain, the absolute timestamps associated with the data are delayed (behind real-time) by several seconds. Details on this absolute timing delay can be found in the Github documentation.
To facilitate comparison between the Nokia multispan DAS system and conventional DAS interrogators, the first span of the southern cable (out to ~95 km) was also instrumented using an OptoDAS interrogator from Alcatel Subsea Networks. The system was multiplexed such that data could be collected while the observatory continued operating. OptoDAS data were collected continuously from November 12 2025 to January 28 2026, with an outage from November 27 to December 5. The spatial and temporal sampling rates were varied periodically. Please note that the OptoDAS interrogator experienced significant calibration problems during this experiment, and therefore did not always record data consistent with the 2024 OOI experiment. Data with 40 m gauge length appears to have the highest quality. More details can be found in the Github documentation.
Low sample rate (~8 Hz) data from the experiment is now available at http://piweb.ooirsn.uw.edu/das25/data.The Nokia multispan DAS data for both cables is available as binary files that contain both data arrays and metadata, with a total dataset size of 3.9 TB. The OptoDAS data for the south cable is available as hdf5 files, with a total dataset size of 1.2 TB. Information on how to read the data, specific data availability times, changes in acquisition parameters, the spatial mask for the Nokia system, and timing offsets on the Nokia system can be found at https://github.com/uwfiberlab/OOI_DAS_2025.
Read MoreIrminger Sea Convection and the roles of Atmospheric Forcing and Stratification

The high-latitude North Atlantic, is a region where seasonal convection results in deep water formation, a process critical to the Atlantic Meridional Overturning Circulation (AMOC). Surface cooling by cold air and strong winds in the Irminger Sea transforms the surface water and drives deep convection in winter. Prior studies have shown that AMOC strength is linked to the extent of water mass transformation in the Irminger Sea and Iceland Basin. A study by de Jong et al. (2025) used a 19-year time series with weekly resolution compiled from moorings and Argo floats to evaluate the year-to-year variability of deep convection and its relationship to atmospheric forcing versus water column stratification.
A time series of surface forcing for the 19-year analysis period (2002-2020) was obtained from the European Center for Medium-range Weather Forecasting (ECMWF) ERA-5 global atmospheric reanalysis. Hydrographic data from the near-surface to 2500 m was collected from three sources: the NIOZ Long-term Ocean Circulation Observations (LOCO) mooring, the GEOMAR Central Irminger Sea (CIS) mooring, and the OOI Hybrid Profiler Mooring (HYPM). Surface temperature and salinity from Argo, ERA-5, and the OOI surface mooring, along with nearby Argo profiles, were used to provide data at the surface and in the upper water column. The records were merged with 25 m vertical resolution and one week time resolution. Mixed layer depth was determined from the hydrographic profiles using a published algorithm with further quality control using multiple criteria.
The time series of potential vorticity (PV) and mixed layer depth (MLD; Fig. 1d), highlights the significant interannual variability. Some years (e.g. 2002-2003) show relatively shallow winter MLD and little evidence of sustained low PV (which would indicate deep mixing) between years. Other years (e.g. 2015-2016) show strong convection, deep MLD, and sustained low PV. While the change in stratification due to warming and freshening related to climate change is expected to weaken convection future convection, analysis showed that in this record there was a strong correlation between the annual maximum MLD and the total accumulated winter heat loss. The correlation between maximum summer stratification and maximum MLD the following winter was not significant. Thus, among other findings, the authors concluded that during the period analyzed atmospheric forcing is three times more important than pre-existing stratification in determining the maximum winter mixed layer depth in the Irminger Sea.
The processed and edited temperature and salinity profiles from the OOI Irminger Sea HYPM from September 2014 to May 2020 are described by Le Bas (2023). The processed data are publicly available from the NOAA National Centers for Environmental Information (NCEI) and referenced with a DOI. The NCEI record includes information about data quality control, validation and drift correction, gridding method, and algorithms for computation of data products.
This project shows the potential for long-duration OOI moored profiler records to be combined with other data sources to provide unique insights into interannual variability of mixing and deep convection in the Irminger Sea. It is notable that the authors undertook a significant data quality control effort and took advantage of the OOI shipboard validation CTD casts (along with non-OOI CTD data sources) in their processing.
[caption id="attachment_35691" align="alignnone" width="624"] Figure 29: Time series of the combined LOCO, CIS, OOI and Argo record from 2002-2020. a) temperature, b) salinity, c) potential density and d) potential vorticity with mixed layer depth overlaid (black dots). From de Jong et al., 2025.[/caption]
___________________
References:
De Jong, M.F, K.E Fogaren, L. LeBras, L. McRaven and H. Palevsky, (2025). Atmospheric forcing dominates the interannual variability of convection strength in the Irminger Sea. J. Geophys. Res., 130, e2023JC020799. https://doi.org/10.1029/2023JC020799.
Le Bras, I. (2023). Water temperature and salinity profiles from the Ocean Observatories Initiative Global Irminger Sea Array Apex profiler mooring from September 2014 to May 2020 (NCEI Accession 0285241). NOAA National Centers for Environmental Information. Dataset. https://doi.org/10.25921/wzvr-fk49.
Read MoreLong-Term Monitoring of Gas Emissions at Southern Hydrate Ridge
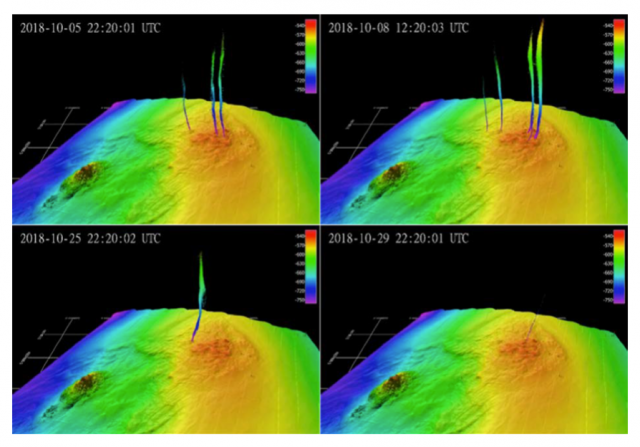
Identifying the parameters that control or influence seabed methane release is important to refining understanding of the carbon cycle. Data from the Regional Cabled Array are providing time-series required to quantify the flux of methane from the seafloor.
Read MoreFacilitating Observatory-Based Subseafloor Science
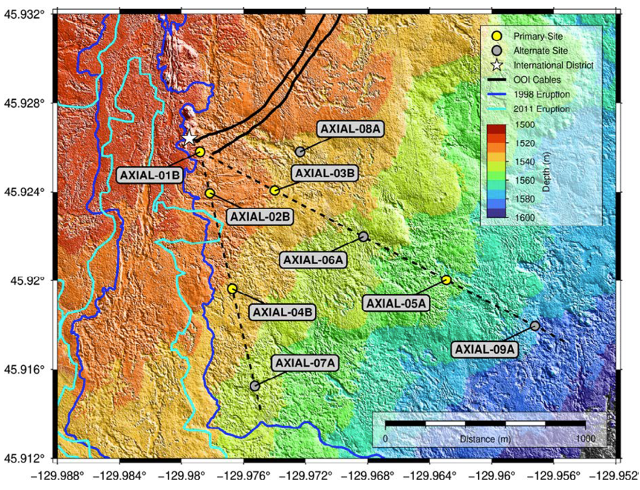
Data flowing from the Regional Cabled Array forms an unparalleled foundation to understand the relationships between microbial, hydrological, geochemical, and geophysical processes in active oceanic crust. Proposed Axial drilling will provide a unique opportunity to determine the nature of subseafloor hydrological properties and develop a 3-D understanding of subseafloor processes in unsedimented crust.
Read MoreDiscovery of Axial Seamount Deep Melt-Mush Feeder Conduit
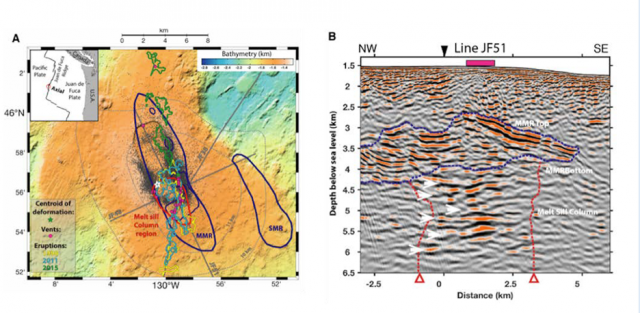
Recent observations at Axial Seamount provide new seismic images of the deep magma plumbing system, revealing a stacked sill complex beneath the main magma reservoir of this submarine volcano. The discovery of this deep melt-mush conduit at Axial, where long-term monitoring observations are supported by the Regional Cabled Array, is providing new understanding of magmatic systems on Earth.
Read MoreA Data Assimilative Reanalysis at the New England Shelf Pioneer Array
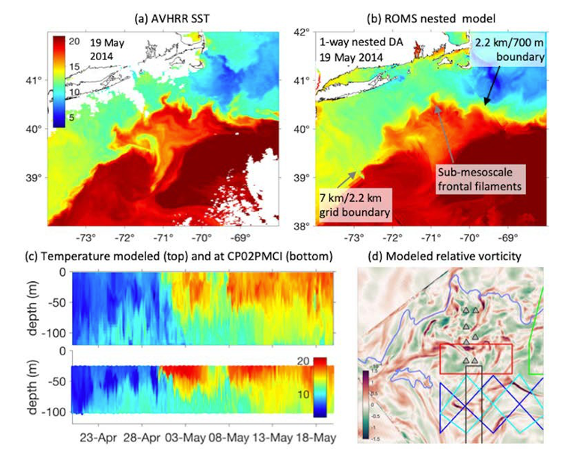
Scientists undertook a four-year retrospective reanalysis of ocean circulation at the Pioneer Coastal Array site. The system captures circulation features that characterize the inhomogeneous, rapidly evolving, and ephemeral submesoscale circulation.
Read MoreShelfbreak Productivity Interdisciplinary Research
The continental shelfbreak of the Mid-Atlantic Bight supports a productive and diverse ecosystem, driven by primary production by phytoplankton. The Coastal Pioneer Array provided unprecedented spatial and temporal resolution of the frontal system, including a four-dimensional context to conduct a detailed study of frontal dynamics and plankton communities.
Read MoreShelf Water Subduction and Cross-Shelf Exchange
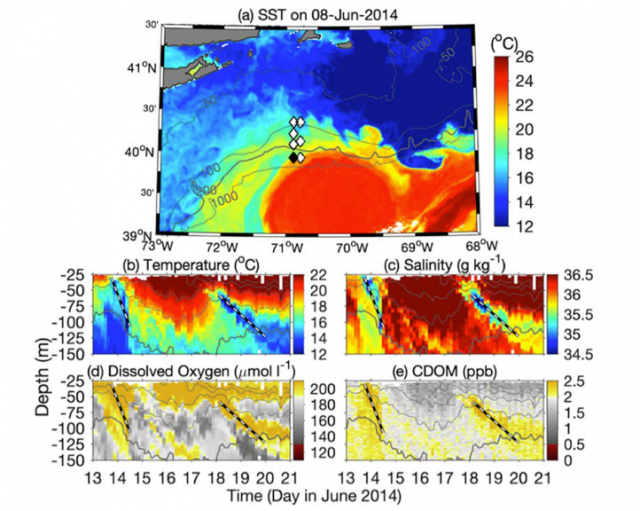
In recent years, the Gulf Stream in the Northwest Atlantic has become increasingly unstable and is shedding more warm core rings in the Slope Sea.The Coastal Pioneer Array at the Mid-Atlantic Bight shelf edge identified a form of offshore transport of water for the first time, supporting an ocean model to study the dynamics of the shelf-water offshore transport.
Read MoreForecasting Hypoxia to Support the Dungeness Crab Fishery
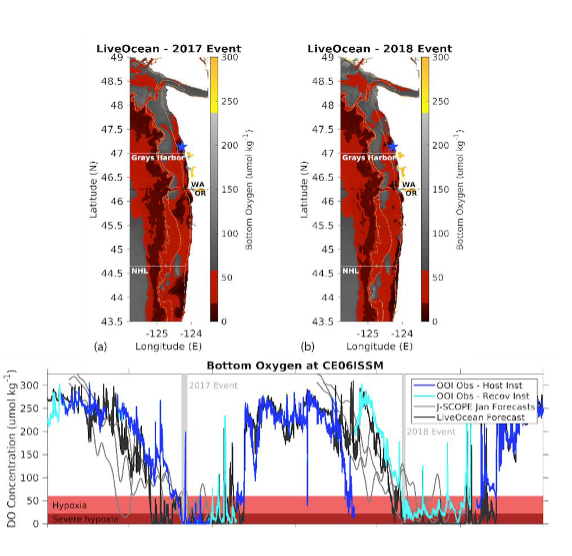
Hypoxia is regularly experienced in Washington and Oregon waters and has been linked to mass mortality events of hypoxia-intolerant species, including the valuable Dungeness crab. The Coastal Endurance Array is aiding the development of a hypoxia forecasting system in this region.
Read MoreIdentifying Impacts of Ocean Acidification and Hypoxia
Ocean acidification has emerged as a leading threat to marine ecosystems, and the fisheries and shellfish growers that depend on a productive and vibrant ocean. The Coastal Endurance Array in the Pacific Northwest array is situated in an epicenter for early impacts from the co-occurrence of ocean acidification and hypoxia.
Read More