
Posts Tagged ‘Endurance Array’
Sixteenth Turn of the Coastal Endurance Array
A team of ten scientists and engineers will depart aboard the R/V Sikuliaq in late March for a two-week expedition to recover and redeploy ocean observing equipment at the Coastal Endurance Array. Located in the northeast Pacific off the coasts of Oregon and Washington, the Coastal Endurance Array consists of two cross-shelf moored array lines, designed to observe cross-shelf and along-shelf variability in the region.
The team will recover and deploy seven moorings. Four of the moorings are located on the Washington Shelf, with the remaining three on the Oregon Shelf. The team also will be recovering a surface piercing profiler at the Washington Shelf site and deploying four surface piercing profilers on the Washington and Oregon lines. Another goal of the team is to deploy and recover gliders so that five are in the water and continue to sample and report back data over the next three months. The gliders collect data across the shelf in shallow water down to 200 meters and also collect data offshore down to depths of 1000 meters.
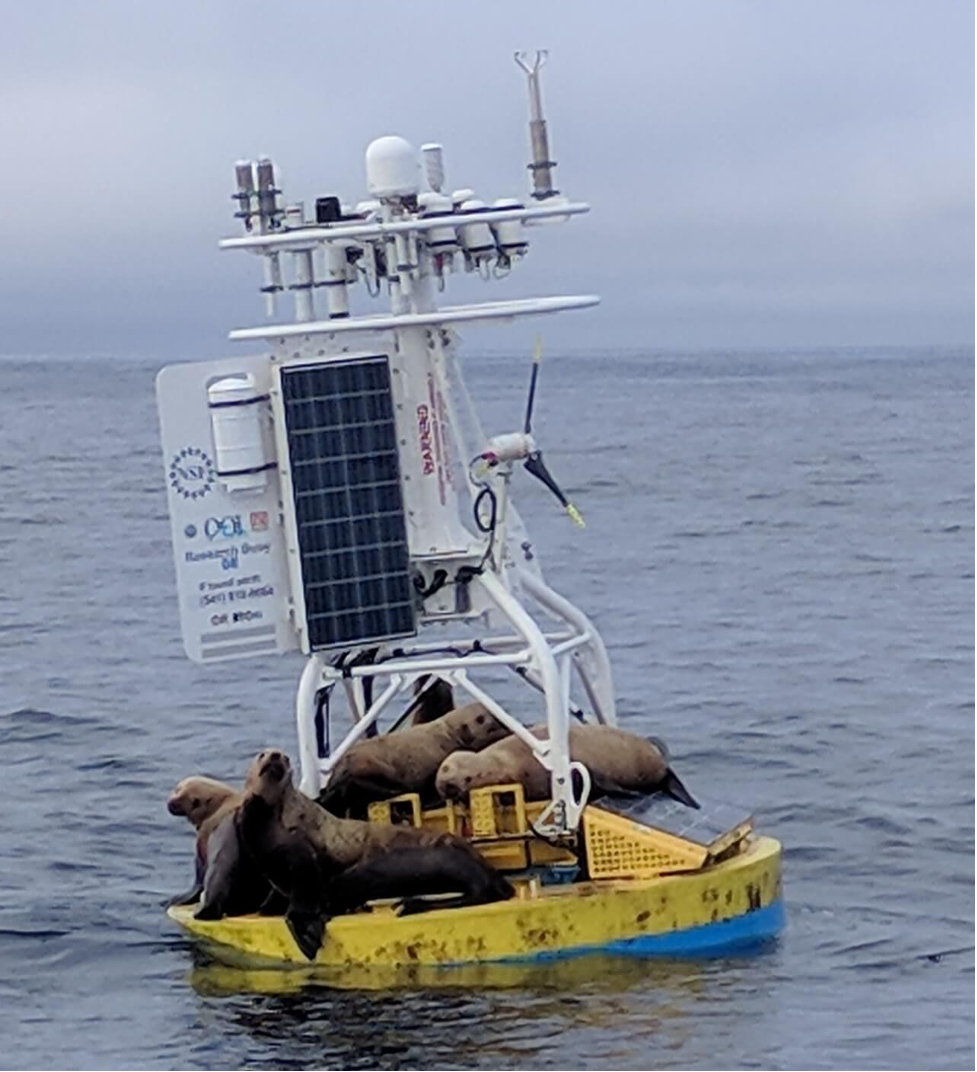
[media-caption path="/wp-content/uploads/2022/03/sea-lions.png" link="#"]The Endurance Array team has to contend with occasional visits of sea lions, which can weigh up to 1000 pounds, and who like to explore the components of the array. This expedition will be testing a re-enforce solar platform to see if can better bear the weight of these hefty and curious visitors. Credit: Endurance Array team.[/media-caption]
When not recovering and deployment equipment, members of the onboard team will be taking CTD (connectivity, temperature, and depth) casts to verify and calibrate instrumentation. Because of the quantity of the equipment to be recovered and deployed, the cruise will take place in two separate legs.
Measurements collected by this array capture the variability of ocean properties across a broad range of temporal and spatial scales. Scientists are using these data to examine ocean health issues such as hypoxia, ocean acidification, and harmful algal blooms, and changing ocean conditions such as intermittent marine heat waves.
“Every time we head out to turn the Endurance Array, the OSU team works together with folks at WHOI to improve the resilience of the gear we put out there and to improve the quality of the data collected,” said Ed Dever, Principal Investigator for the Coastal Endurance Array, serving as Chief Scientist for the Endurance 16 expedition. “It’s a tough environment. The equipment spends six months at sea, getting jostled by high waves and strong winds and serving as habitat for marine life big and small. Yet over the last eight years, we’ve continuously made improvements to the instruments and infrastructure to improve data return. It’s a real testament to the creativity and skills of the whole team. They never stop thinking about ways to make things even better.”
During the second leg of the cruise, a scientific party of five will join the expedition to collect sediment samples for an ongoing experiment led by Dr. Jennifer Fehrenbacher from Oregon State University. This specific scientific inquiry is an example of how the OOI was designed to add instrumentation and adapt sampling approaches to meet the needs of the scientific community it serves.
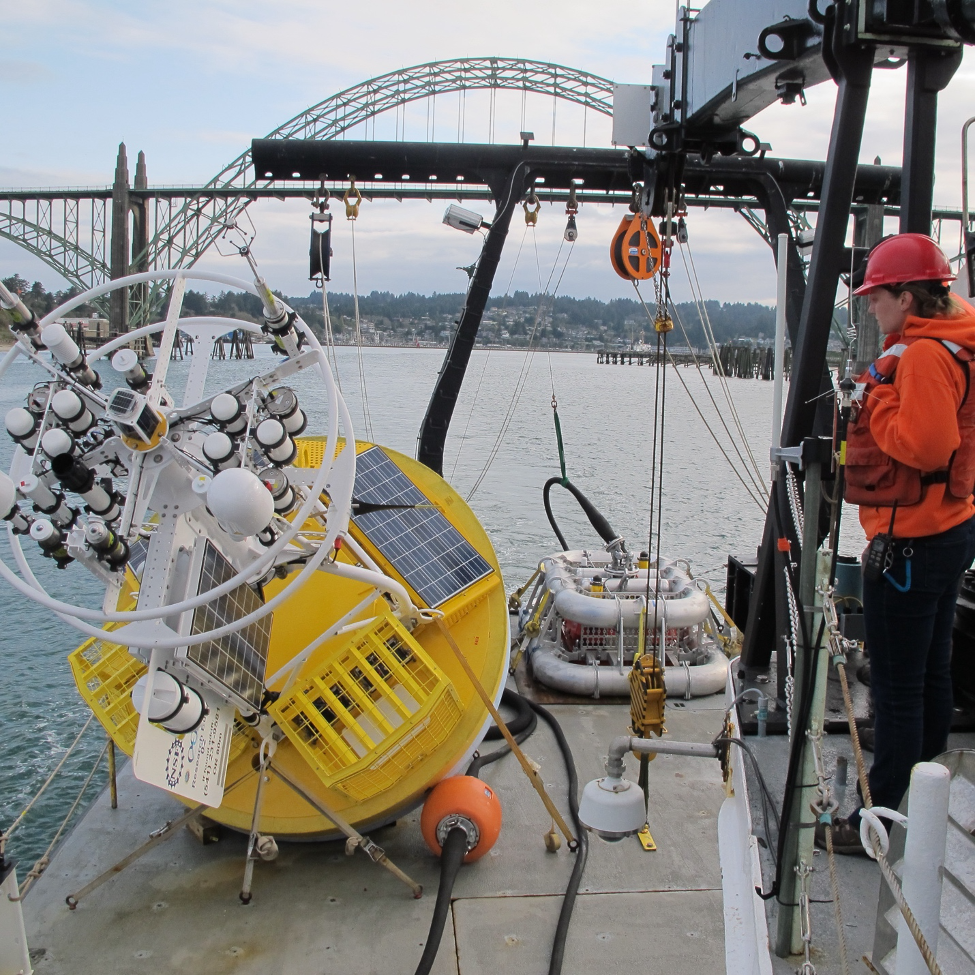
[media-caption path="/wp-content/uploads/2022/03/Sediment-trap.jpeg" link="#"]Dr. Jennifer Fehrenbacher’s team will be deployin this McLane Mark VII 13 cup Sediment Trap, which is used to collect a time-series of material falling through the water column. The stack of three railroad wheels (on right) are the anchor. Credit: University of South Carolina.[/media-caption]
To help answer other specific science questions, the Endurance 16 team also will be conducting sampling for researchers with instruments on the Endurance Array moorings. The team will test deployment of fish acoustic monitors on the near shore instrument frames (see picture below) of both inshore moorings and the Washington Shelf surface mooring for Taylor Chappel a researcher at Oregon State University. The team will also collect settling organisms on devices attached to multi-function nodes on the Oregon Offshore and Surface moorings for Oklahoma State researcher Ashley Burkett.
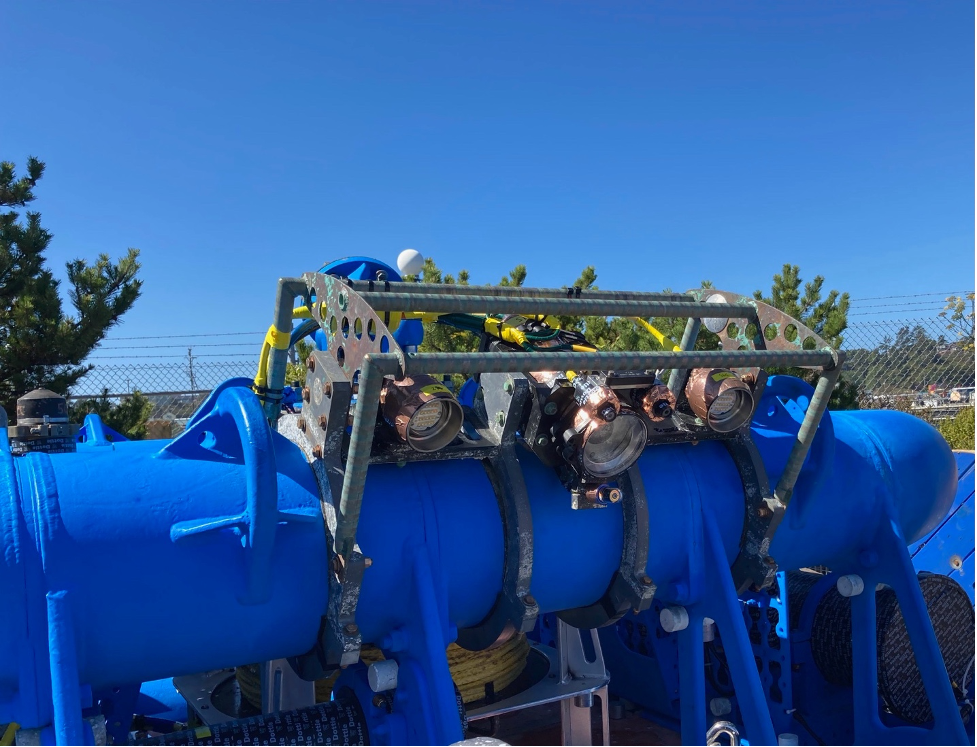
[media-caption path="/wp-content/uploads/2022/03/Endurance-mfn.png" link="#"]This Near-Surface Instrument Frame (NSIF) is an instrumented cage that is suspended below surface moorings. (7m for Coastal moorings, 12m for Global moorings). The NSIF contains subsurface oceanographic instruments attached to multiple data concentrator logger computers. During Endurance 16, fish acoustic monitors will be added to the standard equipment. Credit: Ed Dever, OSU.[/media-caption]
During this expedition, the team also will be deploying new equipment and other improvements. For example, a new anemometer, which sits at the top of the mooring to measure the wind speed will be deployed for the first time. A new camera made with off-the-shelf components will be put into field during for its first six-month deployment. And, the team will be testing the rigor of its newly reinforced solar panels, which often have to withstand the weight of the occasional visit by sea lions.
The team has followed all COVID protocols and are ready to go. They will be blogging and sharing photographs of their two-week expedition. Bookmark this page and follow along as they share their stories.
Read MoreObservations of Cross-Shelf Nitrate Fluxes over the Oregon Continental Shelf
Extracted from OOI Quarterly Report, 2022.
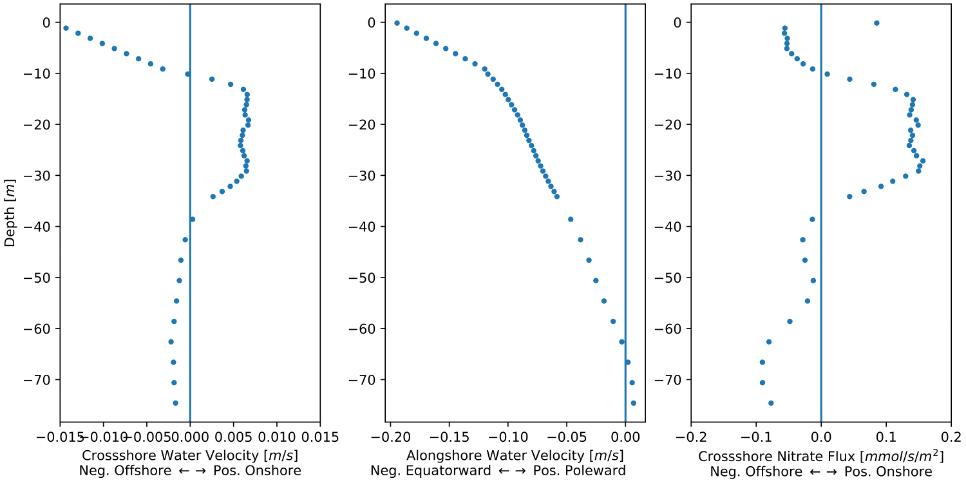
The US Pacific Northwest coastal ecosystems are primarily limited in growth from nitrate supply. The nitrate supply that drives the highly productive marine growth in this region is primarily a result of wind driven coastal upwelling. This work seeks to investigate cross-shelf nitrate fluxes over the continental shelf off the coast of Oregon following the installation of new nitrate and Acoustic Doppler current profilers (ADCPs) in the Ocean Observatories Initiative Coastal Endurance Array.
[media-caption path="/wp-content/uploads/2022/02/Endurance.png" link="#"]Figure 24. A velocity and nitrate profile from the shelf site at the Newport line. Data used was from the 2019 summer, approximately mid-June to early October (deployments 13, 14, and 15). The net nitrate flux found at that site over this time period, found by vertically integrating the values above, is roughly 1.16 mmol Nitrate/second/meter coastline. [/media-caption]
The primary onshore flow of nitrate-rich water over the continental shelf is found to originate at the middle depths, consistent with previous research in the region. However, the upwelling and cross-shelf nitrate fluxes on the continental shelf are found to be in poor agreement with common upwelling indices, e.g., coastal upwelling transport index (CUTI) and biologically effective upwelling transport index (BEUTI). Several factors for this disagreement are proposed, including the focus of the indices on dynamics farther offshore of the continental shelf. Observed coastal wind stress, calculated on a weekly rolling average, is found to be a potential alternative for predicting nearshore nitrate concentrations. Farther offshore at the mid-shelf, only a weak correlation between observed wind stress and observed surface transport is found, suggesting the need for additional dynamics to fully explain the observed surface transport and nitrate fluxes. Correctly modelling the nitrate supply for coastal ecosystems is essential for predicting phytoplankton blooms that are vital to the production of fisheries on the coast. Thus, understanding these limitations is of great importance for ocean-driven coastal economies.
Written by Andrew Scherer, California State University, Monterey Bay and Cleveland State University and Thomas Connolly, Moss Landing Marine Laboratories, San José State University
Andrew Scherer is an undergraduate physics student at Cleveland State University. In summer 2021, he performed this research with Prof. Tom Connolly (MLML, SJSU) as part of a National Science Foundation Research Experience for Undergraduates program and presented it at the Eastern Pacific Ocean Conference Stanford Sierra Center, Fallen Leaf Lake, California 26-29 Sep 2021.
Read MoreR/V Oceanus Remembered as a Workhorse of the U.S. Academic Research Fleet
The long service of the R/V Oceanus (1976-2021) came to end on November 21, 2021 as the ship pulled into port after having successfully completed its last interdisciplinary cruise for Oregon State University (OSU). The Oceanus began its 45-year-run of scientific investigations at Woods Hole Oceanographic Institution (WHOI) in 1976. After a major mid-life refit, the ship was transferred to OSU in 2012, and contributed to the Ocean Observatories Initiative (OOI) off both coasts.
“The Oceanus proved to be a real workhorse for the Academic Research Fleet and also played a pivotal role for the OOI during its initial launch,” said Ed Dever, PI of OOI’s Coastal Endurance Array, who sailed on the ship many times. “While at WHOI, The Oceanus performed some of OOI’s at-sea-mooring test deployments and later the ship was used for the initial deployment of the Coastal Endurance Array off the Oregon coast.”
In spring and fall 2014, after moving to OSU, Oceanus performed the initial deployments of the Oregon and Washington inshore moorings and Washington profiler mooring. The real test for the Oceanus, however, came during 2015, when it was tasked with deploying the full scope of the Endurance Array, including the four large coastal surface moorings at the Oregon and Washington shelf and offshore sites.
Explained Dever, “Thanks to some excellent ship handling, care on the part of the deck crew and a huge assist from some very kind weather, we got the moorings safely in the water using the ship’s crane to deploy the 10,000-pound buoy off the starboard fantail and the heavy lift winch to deploy the 11,000-pound multifunction node (MFN, bottom lander) through the A-frame. The size of the buoys and MFNs meant that Oceanus could only carry one buoy out at a time and the cruise was completed in five legs with some very efficient port stops. By the end of the cruise, it was evident that we would need to move future operations to global and oceans class ships and after one more deployment in fall 2015 (with recoveries carried out on the R/V Thomas G. Thompson), we made that transition.”
[embed]https://youtu.be/pDRagMTDUTk[/embed]After the initial Endurance Array deployments, OOI transitioned to using larger global and oceans class ships needed to recover the bulky coastal surface moorings, with one exception. In spring 2019, with tight schedules on global class ships, UNOLS (University-National Oceanographic Laboratory System charged with ship scheduling) requested that OOI Endurance split the spring mooring recovery and deployment cruise between the R/V Sikuliaq and the R/V Oceanus. The Oceanus ably performed the profiler mooring deployment, anchor recoveries, coastal surface piercing profiler deployments, and glider deployments over five days in April and May 2019.
While not directly working with the OOI, the Oceanus continued to work off Oregon at and around the OOI arrays. Research and student cruises often sampled over the years near OOI’s Endurance and RCA Arrays at the Oregon inshore, shelf, offshore and Hydrate Ridge sites to compare shipboard measurements and OOI time series. This work included CTD profiles, net tows, coring, and sediment trap deployments.
The last Oceanus cruise, in fact, was one such interdisciplinary research cruise led by OSU researcher Clare Reimers, who also served as chief scientist. During its final official outing, the team aboard the Oceanus sampled the outer shelf at the northern end of Heceta Bank, Oregon to help scientists determine any changes that may have occurred to a swath of the margin that was reopened to commercial bottom trawling in 2020 after an 18-year closure. Reimers said, “The R/V Oceanus and crew performed flawlessly, and our science mission was fully completed.”
Added Dever, “What better way to end its long and illustrious career? We at OOI join many others in appreciation of the R/V Oceanus, and the dedication and skills of all who sailed on her and supported ocean science throughout her many years at sea.”
______________________________________________________________________________________
Special thanks to OOI Data Center Project Manager Craig Risien for sharing the GoPro time lapse of the loading of the Oregon Offshore mooring onto the R/V Oceanus in spring 2015.
Read MoreEndurance Array to Provide Hourly Meteorological Data
On 11 October 2021, the National Oceanic and Atmospheric Administration (NOAA)requested that OOI’s Coastal Endurance Array buoys provide hourly meteorological data to the National Data Buoy Center (NDBC) because a nearby NDBC buoy (46029, Columbia River bar) had gone offline. OOI buoy data are typically telemetered every two hours due to sampling schedule and bandwidth constraints (the actual sampling rate is higher).
Endurance Array team members examined sampling and telemetry schedules for the Endurance offshore coastal surface moorings to see if they could accommodate NOAA’s request. The team concluded that meteorological data from the moorings could be updated hourly while still meeting OOI sampling requirements.
“To help ensure continuity of data to the NDBC, we plan to distribute hourly meteorological data from the Endurance Array Oregon and Washington offshore sites for the duration of the outage at NBDC 46029,” said Edward Dever, lead of the Coastal Endurance Team. “We’re pleased to respond to NOAA’s request and hope these data prove useful to operational weather forecasts and marine safety.” The Oregon and Washington offshore sites have NDBC buoys designations of 46098 and 46100, respectively.
The Endurance Array team will continue to review the performance of the buoys and ensure the updated telemetry schedule does not impact OOI sampling. If data users do experience any impacts from this change in sampling frequency, please contact Jon Fram at Jonathan.Fram@oregonstate.edu.
Read MoreNew Underwater Camera with Off-the-Shelf Components
In September 2021, the Coastal Endurance Array began rolling out a much-needed upgrade to their underwater cameras. Endurance Array Innovator Chris Holm engineered a camera using off-the-shelf components to meet the specific needs of capturing environmental conditions and marine life in proximity to the Endurance Array moorings. The prototype was put in place on the inshore mooring (CE01) during the 15th turn of the Coastal Endurance Array.
[media-caption path="https://oceanobservatories.org/wp-content/uploads/2021/10/camera.png" link="#"]The newly configured Endurance Array underwater camera is attached to the inshore mooring, ready for deployment. Photo: Chris Holm, OSU.[/media-caption]The innovation came in multiple steps. Holm first tried to salvage the camera’s hardware and reprogram the camera with new software. He hit a snag, however, in that the motherboard that controlled the camera was no longer supported.
Since it didn’t make sense to rebuild the camera using an out-of-date motherboard, Holm looked into finding a new camera on the market. It had to be suitable for use underwater, with the capability to go into a low-power mode. “What is really needed for low-light conditions underwater is a camera with a large physical sensor, but with fewer megapixels,” explained Holm.
“Since the moorings run on battery power, the cameras need to be able to go into a very low-power sleep state in between taking photos,” said Holm. “If the sleep current is high, the deployment life is low. So, we were trying to find an off-the-shelf solution for a way to go into low power.”
After some searching, Holm obtained a Raspberry Pi High Quality Camera. Although the Raspberry Pi doesn’t come with native power management capabilities, Holm found he could use Sleepy Pi, an add-on-board from Spell Foundry that can power the Raspberry Pi on and off.
For its launch, the camera is programmed to autonomously take a burst of three images every four hours. The system can also take photos when triggered by a Data Concentration Logger (DCL) and can be partially configured remotely. Future iterations will be fully configurable remotely via the DCL.
The final touch to this first iteration was figuring out how to turn the lights and lasers on and off. Holm used a relay board from Waveshare Electronics to power the original systems lights and lasers. The lights adjust their brightness depending on the voltage being sent through a signal line which is controlled by the GPIO pins of the Raspberry Pi.
Altogether, the system is very suitable for the Endurance Array’s needs and is an extremely cost-effective, off-the-shelf solution. The cameras also can be easily swapped out if the Endurance team decides to upgrade the cameras.
Since this newly configured camera was put in place in early September, Holm said, it has been performing flawlessly, with the auto-exposure working well. Since this mooring uses a cell modem to transmit data, the team has been able to see the photos the camera is taking in near real-time. Once the formal approval process for the camera’s integration and use across the OOI is completed, Holm will be building more camera systems for the Endurance Array to deploy on the offshore and shelf moorings during the spring.
Since the cameras and its settings can be upgraded and/or optimized for different use cases, depending on what an investigator is interested in (such as marine snow or benthic organisms), Holm would like to hear from scientists about what they’d like the camera to focus on. He created a survey for data users interested in the underwater cameras.
“It would be very helpful to know what kind of data would be most useful to scientists using the system,” he said.
For those interested in seeing underwater, please complete the survey here.
[media-caption path="https://oceanobservatories.org/wp-content/uploads/2021/10/camera-output.png" link="#"]The Endurance Array team has the capability to adjust the settings of the underwater cameras based on researchers’ interests. In addition, some post-processing tools could be developed to sort images or extract useful information from them. Photo: Chris Holm, OSU.[/media-caption]
Read More
Tackling Sea Surface Sampling Issues
The sea surface is the hardest place to work, according to Jonathan Fram, Project Manager of the Coastal Endurance Array. That’s because at the surface, waves are constantly sloshing around. At any time, a large wave can tug on mooring winch lines, creating sudden tension, which can wear down cables and even cause them to break.
Scuba divers know that surface waters are rough, but below a certain depth—about one wave orbital below the surface—the waters calm significantly. Unfortunately, a lot of great science takes place at the surface, so it’s important for sampling instruments like the Coastal Surface Piercing Profiler (CSPP) to be able to withstand the waves at and near the surface. Fortunately, OOI engineers have found ways to meet the many challenges of working in this rough environment.
“The Coastal Endurance Array Team has made changes to the CSPP to make it more robust, so that we can get the kind of continuous time series that are so valuable to scientists,” said Fram.
A CSPP spends most of its time near the sea floor, but either two or four times a day, the profiler winches itself up to the surface, taking samples as it ascends. Once it reaches the surface, the profiler sends its data back to shore and then quickly returns to the safety of the seafloor. Profilers are important ocean observatory tools because they can help capture what is happening at certain depths where stationary instruments aren’t present. “We’ve had times where you get a persistent chlorophyll bloom at a certain depth where there is zero mooring data,” explained Fram. “So the CSPP sampling is needed to make sense of what’s happening. It’s impossible to have all the instruments at all depths. The CSPP fills in this gap.”
Last year, the Coastal Endurance Array team reviewed their activities looking for ways to reduce lost time at sea. One thing they discovered was that the anchor systems of the CSPPs were unreliable. To deal with this problem, the team created a new kind of anchor. The old profiler anchors had a chain between the profiler and anchor that helped dampen the waves so that the device was not tugged on when resting in between profiles. The chain, however, made it difficult to deploy the anchor in an upright position. Anchors need to be deployed upright so their recovery floats can be acoustically released. The team redesigned the anchors so they now behave like a weeble wobble toy that is weighted so it always rights itself. This new design makes it hard to deploy an anchor upside down, making the anchors more reliable.
The team also made updates to the modems that send data to shore. When the CSPP is at the surface, the winch must stay on because it keeps the antenna vertical. This time-on takes up about a quarter of the battery power. To reduce the power demand, the team switched out some of the iridium modems for cellular modems, which has allowed the CSPPs to send data more quickly. A faster modem means that the profiler spends less time at the surface, not only saving power, but reducing the risk of being damaged by a large wave. The team is currently working on upgrading to faster cellular modems that can connect further from shore.
“At the same time we are making these updates on the Oregon Shelf Mooring, we’re also implementing them on the Washington Shelf Mooring,” said Fram. “So an improvement on one platform is also leading to an improvement on another platform.”
A third innovation involves improvements to the batteries.
“When waves tug on the winch, it goes from being a power sink to a power source. That sometimes creates power spikes that can fry the connectors. So we’ve rewired the batteries to make them more robust,” explained Fram. The rewiring is expected to reduce the number of power failures and keep the CSPPs running continuously. “Since April when we first started using the rewiring scheme, we’ve had four profilers in the water with no problems for six weeks,” said Fram.
The team also is in the process of replacing batteries that power the profiler with their own design of rechargeable batteries. While OOI engineers prefer to use commercially available parts for easier repair and replacement, when parts on the market don’t fit their needs, they design their own. The new batteries will be more reliable than those they are replacing. The newly designed batteries will also be deployed on the wire-following profilers on the Coastal Pioneer Array.
“My focus is on making all of the Coastal Endurance instrumentation work,” said Fram. “When we’re able to get a full three months’ deployment through the winter, through super rough seas, that makes my day. Making improvements is what I look forward to the most.”
Read MoreBottom Boundary Layer O2 Fluxes During Winter on the Oregon Shelf
Adapted and condensed by OOI from Reimers et al., 2022, doi:/10.1029/2020JC016828.
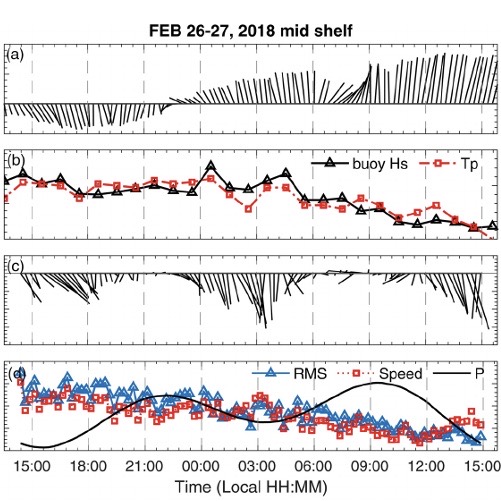
[caption id="attachment_21037" align="aligncenter" width="640"]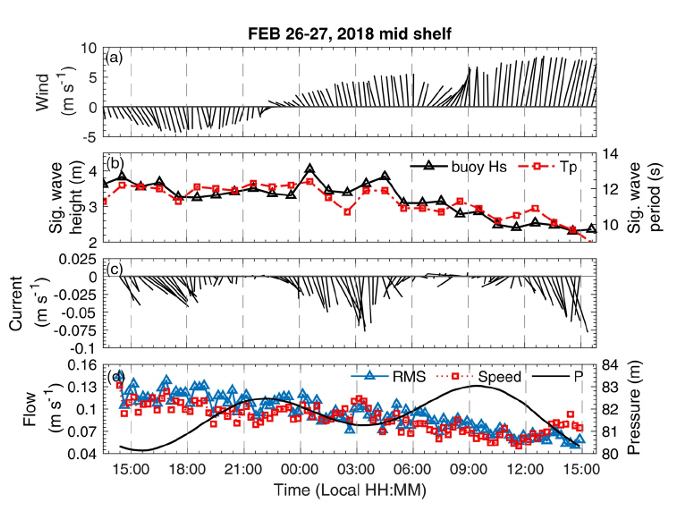 Fig. 1 Time series of physical conditions during the February 26–27, 2018 deployment (EC D1) at the mid-shelf site. (a) Wind vectors (15-min averages) measured at the OOI Shelf Surface Mooring (CE02SHSM), (b) wave properties (hourly averages) measured at the OOI Shelf Surface Mooring, (c and d) other near-bottom ADV parameters (15-min averages). Both the winds and ADV velocities are portrayed in earth coordinates (eastward is to the right along the horizontal axis and northward is positive along the vertical axis). ADV, Acoustic Doppler Velocimeter; EC D, eddy covariance deployment[/caption]
The oceanic bottom boundary layer (BBL) is the portion of the water column close to the seafloor where water motions and properties are influenced significantly by the seabed. This study (Reimers & Fogaren, 2021) reported in the Journal of Geophysical Research examines conditions in the BBL in winter on the Oregon shelf. Dynamic rates of sediment oxygen consumption (explicitly oxygen fluxes) are derived from high-frequency, near-seafloor measurements made at water depths of 30 and 80 meters. The strong back-and-forth motions of waves, which in winter form sand ripples, pump oxygen into surface sediments, and contribute to the generation of turbulence in the BBL, were found to have primed the seabed for higher oxygen uptake rates than observed previously in summer.
Since oxygen is used primarily in biological reactions that also consume organic matter, the winter rates of oxygen utilization indicate that sources of organic matter are retained in, or introduced to, the BBL throughout the year. These findings counter former descriptions of this ecosystem as one where organic matter is largely transported off the shelf during winter. This new understanding highlights the importance of adding variable rates of local seafloor oxygen consumption and organic carbon retention, with circulation and stratification conditions, into model predictions of the seasonal cycle of oxygen.
Supporting observations, which give environmental context for the benthic eddy covariance (EC) oxygen flux measurements, include data from instruments contained in OOI’s Endurance Array Benthic Experiment Package and Shelf Surface Moorings. Specifically, velocity profile time-series are drawn from records of a 300-kHz Velocity Profiler (Teledyne RDI-Workhorse Monitor), near-seabed water properties from CTD (SBE 16plusV2) and oxygen (Aanderaa-Optode 4831) sensors, winds from the surface buoy’s bulk meteorological package, and surface-wave data products from a directional wave sensor (AXYS Technologies) (see e.g., Fig 1 above).
Reimers, C. E., & Fogaren, K. E. (2021). Bottom boundary layer oxygen fluxes during winter on the Oregon shelf. Journal of Geophysical Research: Oceans, 126, e2020JC016828. https://doi.org/10.1029/2020JC016828
Read More
Mission Accomplished: Endurance 14 Cruise Meets All Objectives
After a 15-day expedition, the Endurance Array Team returned to port aboard the R/V Sikuliaq on 7 April having successfully completed the 14th turn of the Endurance Array. The team recovered and deployed seven surface moorings and completed sampling at all recovery/deployment sites. They also deployed and recovered gliders and surface profilers.
Because of the size and weight of the moorings and other equipment, the trip was conducted in two legs. The first leg was primarily off Washington and the second off Oregon. Between legs, the R/V Sikuliaq returned to Newport, Oregon to offload recovered equipment from the Washington Line and load new equipment for the Oregon Line.
The weather was rough when the R/V Sikuliaq first set off from Newport on 24 March. On the first night out, they saw 19-foot waves and 35-knot winds. The team worked around the weather on the first leg to deploy three moorings and recover four. They also recovered and deployed gliders.
The second leg of the journey brought with it much better weather, which eased the recoveries, deployments, sampling, and other activities. During this leg, the team worked mostly off Oregon. The team deployed four moorings and three profilers and recovered three moorings, three gliders, and a profiler.
Each OOI deployment brings some technical improvement. On this deployment, the Endurance moorings are outfitted with redesigned solar panels on the buoy decks. These panels will deliver more power and be more resilient to wear and tear caused by sea lions who often find the buoys an inviting place to lounge. The redesign was implemented by OOI’s Coastal and Global Scale Nodes team at Woods Hole Oceanographic Institution.
This trip also marked the Endurance Array’s team first use of a OOI’s ROV (remotely operated vehicle). The ROV was used at the Oregon shelf site to recover a coastal surface piercing profiler and its anchor. Throughout the process, the R/V Sikuliaq maneuvered skillfully to place the ship over the target. Mooring lead Alex Wick piloted the ROV through strong currents and limited visibility. It took four dives, but the profiler and its anchor were recovered. On the third dive, the ROV was used to cut the winch line so the team could recover the profiler, and the anchor was recovered on the fourth and final dive.
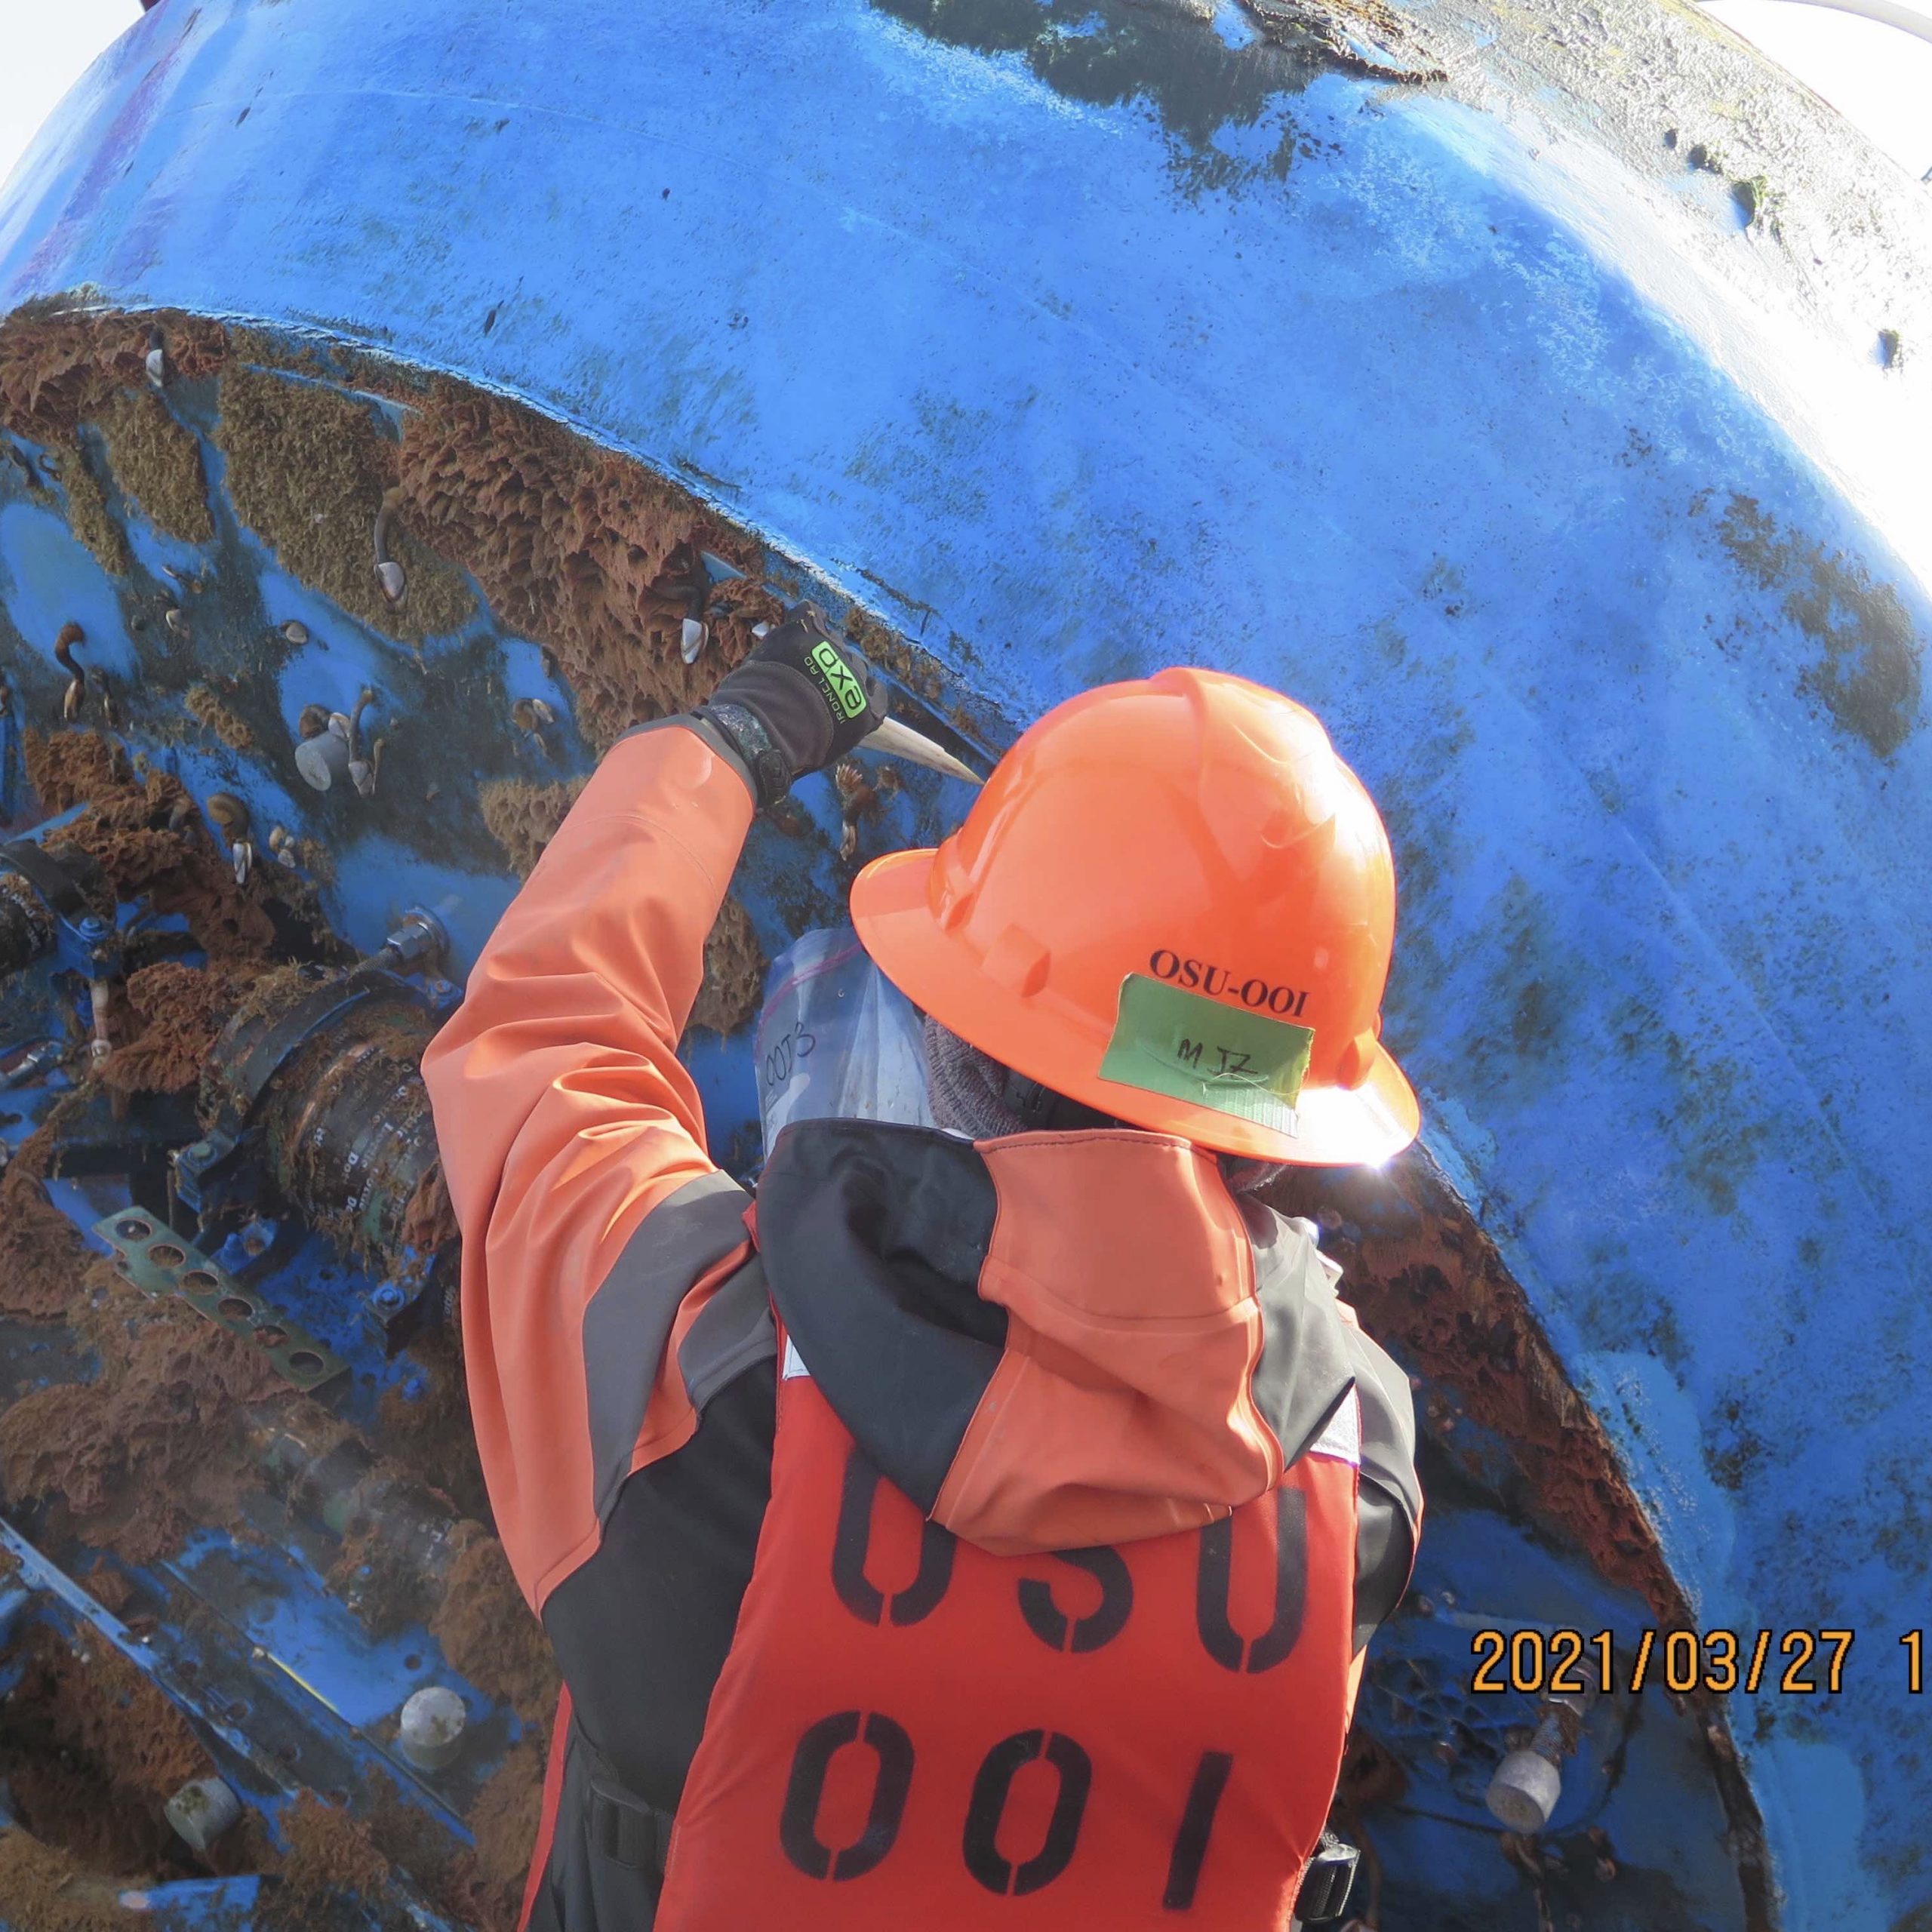
The Endurance team also collected CTD samples and biofouling samples to share with researchers at the Smithsonian Institute and Oklahoma State University. The R/V Sikuliaq returned to Newport on 7 April with the recovered equipment, which will undergo refurbishment for the next turn of the Endurance Array in September.
“Since 2017, we’ve sailed on the R/V Sikuliaq for six out of nine cruises,” said Ed Dever, the Chief Scientist of Endurance 14. “It’s a match that works well. From ship handling and on-deck assistance to mobilization of underway science sensors, lifting gear, engineering, accommodations, and food, we are deeply appreciative of the Sikuliaq’s captain, crew, and the ship herself.”
Read MoreA Bountiful Sea of Data: Making Echosounder Data More Useful
[media-caption path="https://oceanobservatories.org/wp-content/uploads/2021/03/Screen-Shot-2021-03-30-at-5.51.41-PM.png" link="#"]Researchers used echosounder data from the Oregon Offshore site of the Coastal Endurance Array to develop a new methodology that makes it easier to extract dominant patterns and trends.[/media-caption]The ocean is like a underwater cocktail party. Imagine, as a researcher, trying to follow a story someone is telling while other loud conversations are in the background of a recording. This phenomenon, known as the “Cocktail Party Problem,” has been studied since the 1950s (Cherry, 1953; McDermott, 2009). Oceanographers face this challenge in sorting through ocean acoustics data, with its mixture of echoes from acoustic signals sent out to probe the ocean.
Oceanographer Wu-Jung Lee and data scientist Valentina Staneva, at the University of Washington, teamed up to tackle the challenge in a multidisciplinary approach to analyze the vast amounts of data generated by echosounders on Ocean Observatories Initiative (OOI) arrays. Their findings were published in The Journal of the Acoustical Society of America, where they proposed a new methodology that uses machine learning to parse out noisy outliers from rich echosounder datasets and to summarize large volumes of data in a compact and efficient way.
This new methodology will help researchers use data from long time series and extract dominant patterns and trends in sonar echoes to allow for better interpretation of what is happening in the water column.
The ocean is highly dynamic and complex at the Oregon Offshore site of the OOI Coastal Endurance Array, where echosounder data from a cabled sonar were used in this paper. At this site, zooplankton migrate on a diurnal basis from a few hundred meters to the surface, wind-stress curl and offshore eddies interact with the coastal circulation, and a subsurface undercurrent moves poleward. The echosounder data offer opportunities to better understand the animals’ response to immediate environmental conditions and long-term trends. During the total eclipse of the Sun in August 2017, for example, echosounders captured the zooplankton’s reaction to the suddenly dimmed sunlight by moving upwards as if it was dusk time for them to swim toward the surface to feed (Barth et al, 2018).
Open access of echosounder datasets from the OOI arrays offers researchers the potential to study trends that occur over extended stretches of time or space. But commonly these rich datasets are underused because they require significant processing to parse out what is important from what is not.
Echosounders work by sending out pulses of sound waves that bounce off objects. Based on how long it takes for the reflected echo to come back to the sensor, researchers can determine the distance of the object. That data can be visualized as an echogram, an image similar to an ultrasound image of an unborn baby.
But unlike an ultrasound of a baby, when an undersea acoustic sensor records a signal, it may be a combination of signals from different sources. For example, the signal might be echoes bouncing off zooplankton or schools of fish.
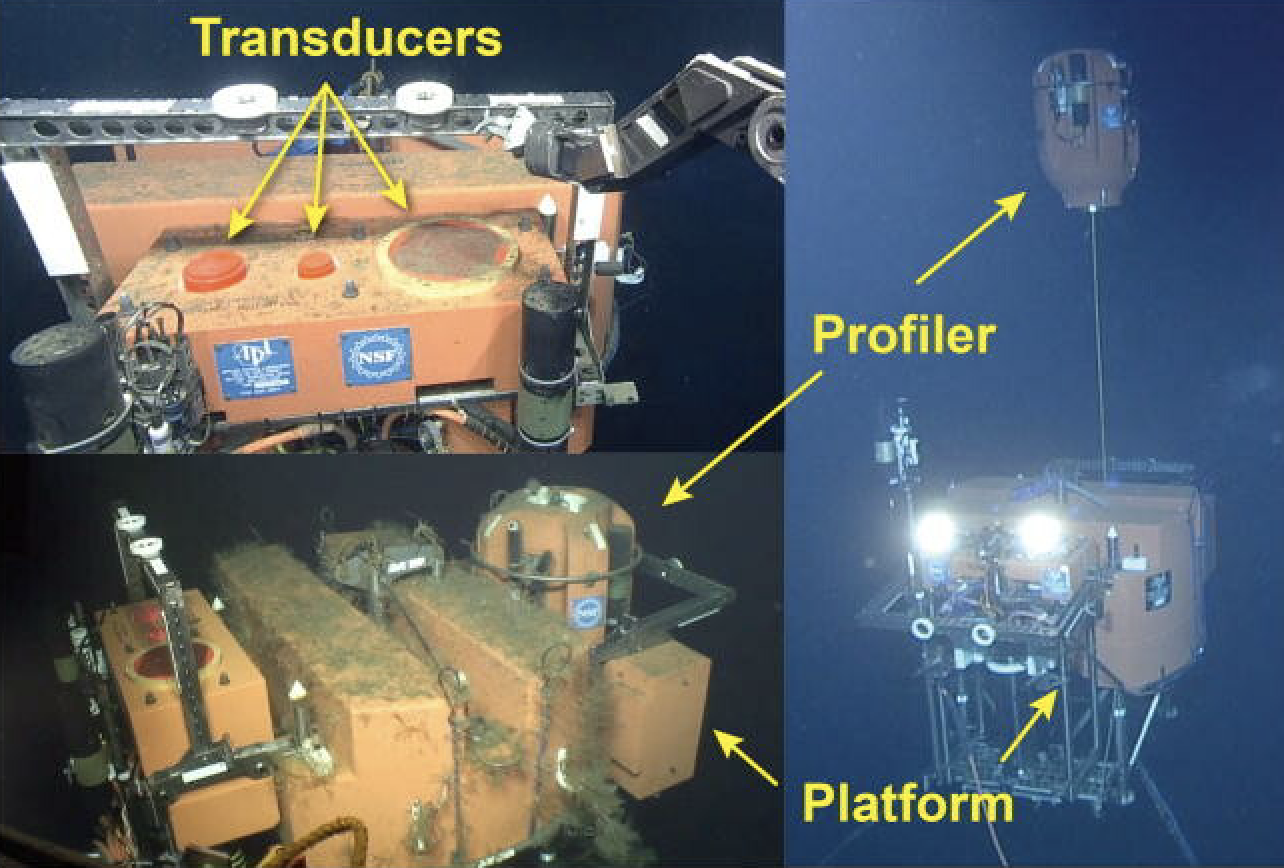
[caption id="attachment_20566" align="alignleft" width="350"]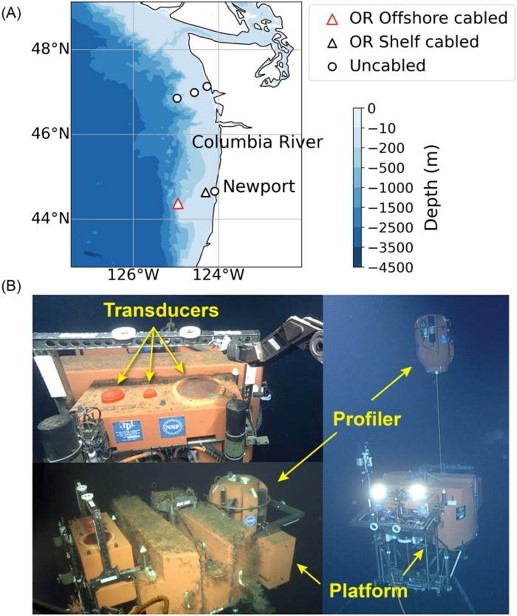 (A) Data used in this work were collected by a three-frequency echosounder installed on a Regional Cabled Array Shallow Profiler mooring hosting an underwater platform (200 m water depth) and profiler science pod located at the Oregon Offshore site of the OOI Coastal Endurance Array (red triangle). The symbols indicate the locations of all OOI echosounders installed along the coast of Oregon and Washington. (B) The transducers are integrated into the mooring platform (from left to right: 120, 200, and 38 kHz). The platform also hosts an instrumented profiler that traverses the water column above the echosounder from ~ 200 m to ~ 5m beneath the ocean’s surface. (Image credit: UW/NSF-OOI/WHOI-V15).[/caption]
“When the scatterers are of different size, they will reflect the sound at different frequencies with different strengths,” said Lee. “So, by looking at how strong an echo is at different frequencies, you will get an idea of the range of sizes that you are seeing in your echogram.”
Current echogram analysis commonly requires human judgement and physics-based models to separate the sources and obtain useful summary statistics. But for large volumes of data that span months or even years, that analysis can be too much for a person or small group of researchers to handle. Lee and Staneva’s new methodology utilizes machine learning algorithms to do this inspection automatically.
“Instead of having millions of pixels that you don’t know how to interpret, machine learning reduces the dataset to a few patterns that are easier to analyze,” said Staneva.
Machine learning ensures that the analysis will be data-driven and standardized, thus reducing the human bias and replicability challenges inherently present in manual approaches.
“That’s the really powerful part of this type of methodology,” said Lee. “To be able to go from the data-driven direction and say, what can we learn from this dataset if we do not know what may have happened in a particular location or time period.”
Lee and Staneva hope that by making the echosounder data and analytical methods open access, it will improve the democratization of data and make it more usable for everybody, even those who do not live by the ocean.
In the future, they plan to continue working together and use their new methodology to analyze the over 1000 days of echosounder data from the OOI Endurance Coastal and Regional Cabled Array region.
References
Lee, W-J and Staneva, V (2021).Compact representation of temporal processes in echosounder time series via matrix decomposition. Special Issue on Machine Learning in Acoustics. The Journal of the Acoustical Society of America.
Barth JA, Fram JP, et al. (2018). Warm Blobs, Low-Oxygen Events, and an Eclipse: The Ocean Observatories Initiative Endurance Array Captures Them All.Oceanography, Vol 31.
McDermott, J (2009). The Cocktail Party Problem.Current Biology, Vol 19, Issue 22.
Cherry EC (1953). Some Experiments on the Recognition of Speech, with One and Two Ears.The Journal of the Acoustical Society of America. Vol. 25, No.5.
Read More
Spring Expeditions: Keeping OOI Arrays Fully Operational
OOI teams were in the water on opposite coasts in late March to service the Pioneer and Endurance Arrays. The teams will “turn” the moorings (recover old and deploy new) to keep the arrays continually collecting and reporting data back to shore. This is the 14th turn of the Endurance Array; the 16th for the Pioneer Array.
The Endurance 14 Team set sail from Newport Oregon aboard the R/V Sikuliaq on 24 March for a 15-day expedition. The Pioneer 16 Team departed from Woods Hole, MA, a few days later on 29 March aboard the R/V Armstrong for a 21-day mission. Both expeditions will require two legs because of the need to transport a huge amount of equipment. The equipment for the Pioneer Array weighs more than 129 tons. The Endurance equipment tops the scale at 95 tons.
Departures for both teams occurred after arranging for reduced occupancy on site and social distancing during preparation, followed by 14 days of quarantine to meet COVID-19 restrictions. And while onboard, COVID has necessitated other changes ranging from smaller science parties to scheduled meal times to allow for social distancing.
“It is very impressive that the OOI team has been able to continue to service these arrays in spite of the challenges presented by COVID,” said Al Plueddemann, Chief Scientist of the Pioneer 16 Expedition. “The ocean is a tough environment in which to keep equipment operational, even in normal times. This year, in particular, has required both our shore-based staff and those onboard to be adaptable, flexible, and innovative to get the job done.”
[media-caption path="https://oceanobservatories.org/wp-content/uploads/2021/03/burnin_Travis.jpg" link="#"]The full cycle of preparation for an OOI mooring service cruise takes many months. The “burn-in” period for Pioneer-16, during which equipment is assembled and tested, began in January 2021 with snow on the ground outside of the LOSOS building on the WHOI campus. Credit:Rebecca Travis © WHOI.[/media-caption]In addition to the mooring and deployment recoveries, both teams are deploying and recovering gliders that collect additional data within the water column and the area between the moorings. They also are conducting CTD casts and water sampling at the mooring sites, and doing meteorological comparisons between ship and buoys. The Pioneer Team will be operating autonomous underwater vehicles (AUVs), while the Endurance Team will have its inaugural use of OOI’s own remotely operated vehicle (ROV) to recover anchors at the Oregon shelf site.
“In normal times, we would invite external students and scientists along to conduct ancillary experiments on the cruise,” said Edward Dever, Chief Scientist for Endurance 14. “But given the limited science party allowed onboard due to COVID-19, the OOI team will be conducting some of this additional work to ensure the continuity of these experiments.”
For Endurance 14, this work includes collection of organisms that grow on panels attached to Endurance buoys for invasive species research, collection of settling organisms on devices attached to Multi-Function Nodes, which power near bottom data instruments, and test deployments of tagged fish acoustic monitors on near surface instrument frames on three moorings.
Likewise, the Pioneer 16 Team is helping ensure ongoing science investigations installing and operating unattended underway sampling for the Northeast U.S. Shelf Long-Term Ecological Research (LTER) project and conducting CTD casts at LTER sites during the cruise. They will also conduct communication tests at the Offshore mooring site in support of the Keck-funded 3-D Acoustic Telescope project.
Science teams of 9-10 people on each cruise are sharing the multitude of tasks needed for the moored array service.
[media-caption path="https://oceanobservatories.org/wp-content/uploads//2021/03/Screen-Shot-2021-04-01-at-9.19.20-AM.png" link="#"]OOI’s remotely operated vehicle will be used for the first-time during Endurance 14. Credit: Seaview Systems.[/media-caption]
Read More