
Posts Tagged ‘QARTOD’
QARTOD Flag Statistics Using Cloud-Based Resources and Zarr Data Formats
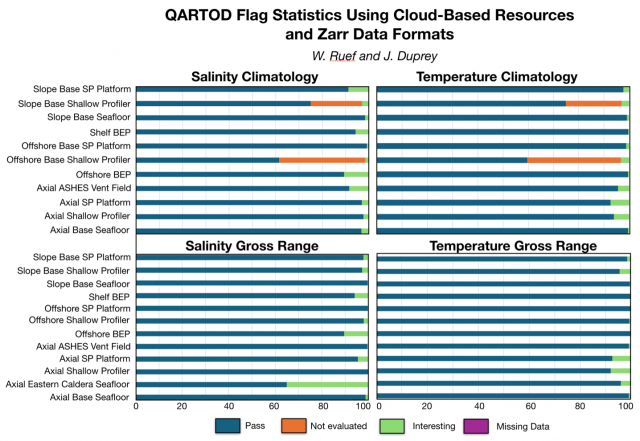
Central to the Regional Cabled Array (RCA) Quality Assurance/Quality Control (QA/QC) workflow is a cloud-based data harvest and visualization platform that allows for efficient and timely review of the high-frequency and high-density time series data streaming from RCA instruments. A key component of this workflow is a Zarr-based version of the OOI RCA data, a cloud optimized file format that stores metadata separately, allowing data chunks to be retrieved without loading the entire dataset. Using Zarr files and Amazon Web Services (AWS) cloud computing resources for QA/QC has made it possible to create a dashboard that is refreshed daily for multiple high-density datasets and parameters. This also results in minimization of both costs and OOI-Cyberinfrastructure load by appending only new data daily, with a full dataset refresh occurring only when necessary. Because the Zarr files contain time-series data records that include all variables served through M2M (Machine to Machine Learning), this workflow also allows for the efficient deep data review that is currently required for compiling and reviewing QARTOD (Quality Assurance/Quality Control for Real-Time Oceanographic Data) data flag tables.
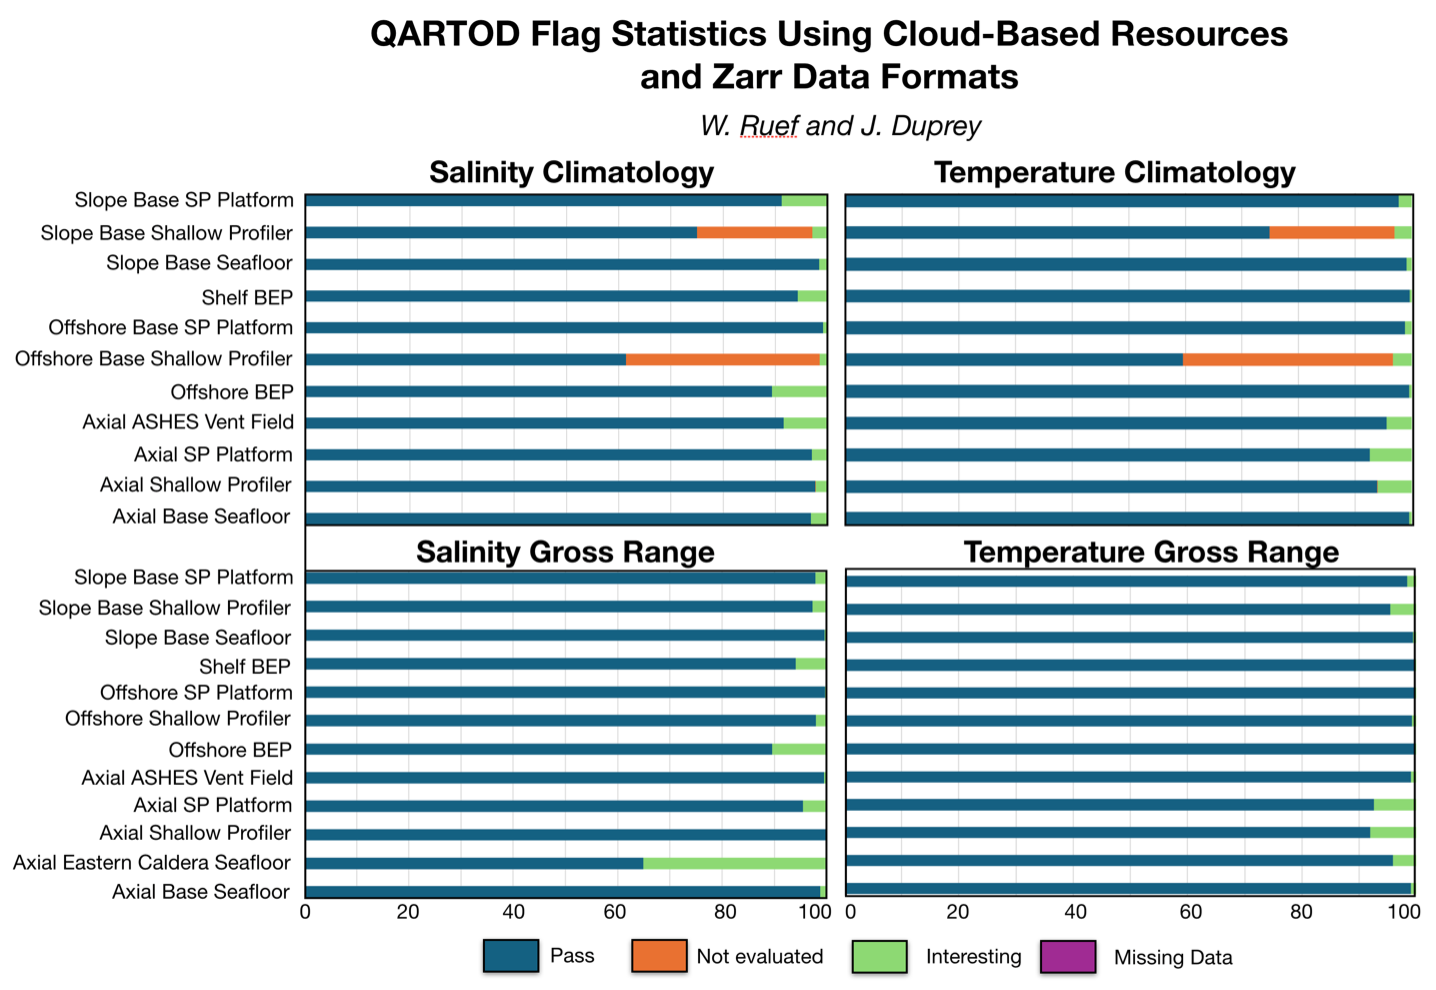
With the existing Zarr files, we were able to quickly access all active QARTOD flags in the RCA data streams for gross range and climatology and produce basic summary statistics for each parameter using minimal AWS cloud and data team resources. The figures above include the results from CTD (Conductivity, Depth, and Temperature) streams across the RCA for temperature and salinity, for both gross range and climatology QARTOD tests. In this initial compilation over 90% of all data points pass the gross range tests for temperature, and all except 2 pass gross range tests for salinity. Similar results were seen with the climatology tests, with nearly all streams having less than 10% of data points flagged as “suspect or interesting”. Most of the flags for non-passing data points in the climatology results were values of “not evaluated” in the Offshore and Slope Base Shallow Profiler streams. Our first set of investigations will focus on these streams to identify the cause for these flags. A suspected cause may be that the isoclines in the water column are not being accurately represented in the climatology depth bins.
Read More
Video Demo about Using QARTOD Flags for OOI data
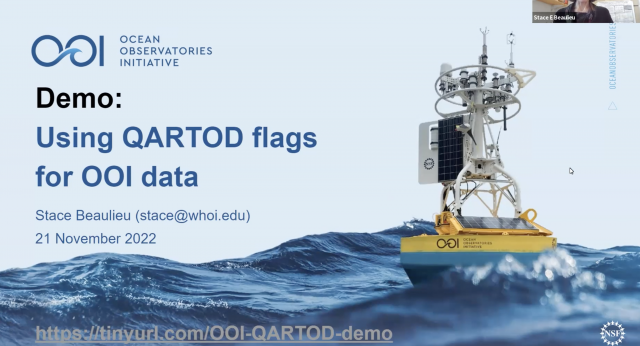
Woods Hole Oceanographic Senior Research Specialist Stace Beaulieu presents a demonstration on how to explore and visualize data for the Ocean Observatories Initiative (OOI) in Data Explorer, with an emphasis on Quality Assurance of Real-Time Oceanographic Data (QARTOD) flags. In this example, we use QARTOD flags in Data Explorer to rapidly identify a time period of interest and then access those data from ERDDAP.
https://vimeo.com/user110037220/qartod
Read MoreOOI Launches QARTOD
WHAT IS QARTOD?
As part of the ongoing OOI effort to improve data quality, OOI is implementing the Quality Assurance of Real-Time Oceanographic Data (QARTOD) on an instrument-by-instrument basis. Led by the United States Integrated Ocean Observing System (U.S. IOOS), the QARTOD effort draws on the broad oceanographic observing community to provide manuals for different instrument classes (e.g. salinity, pH, or waves), which outline best practices and identify tests for evaluating data quality. A common code-base is available on GitHub and actively maintained by IOOS partner Axiom Data Science.
OOI has committed to implementing available QARTOD tests where appropriate. QARTOD is well-documented and actively maintained with an engaged user-base across multiple data collection and repository programs. It has a publicly available code-base with standardized tests and flag definitions that result in simplified, easy-to-interpret results. However, some instruments deployed by OOI, such as seismic sensors, hydrophones, and multispectral sensors, are not well-suited towards QARTOD. For instruments for which there is no existing QARTOD manual, such as seawater pCO2, OOI is implementing “QARTOD-like” quality control (QC).
HOW ARE QARTOD RESULTS COMMUNICATED?
QARTOD utilizes a standardized data-flagging scheme, where each data point for an evaluated variable (e.g. salinity) receives one of the following flags: 1 if the data point passed the test and is considered good; 2 if a test was not evaluated; 3 if the data point is either suspect or interesting/unusual; 4 if the data point fails the test; 9 if the data point is missing. Importantly, QARTOD only Flags data, it does not remove data. In fact, OOI is committed to delivering all available data, whether good or bad; the goal is to provide further information on the possible quality of the data. Furthermore, a flag of 3 does not necessarily mean a data point is bad – it could also mean something interesting or unusual occurred that resulted in the given data point being outside of the expected test threshold.
HOW IS QARTOD IMPLEMENTED BY OOI?
OOI is prioritizing implementation of QARTOD on instruments and variables which are shared across arrays and with broad or high scientific interest, such as CTDs, seawater pH and pCO2, dissolved oxygen, and chlorophyll/fluorescence. OOI is currently implementing the gross range and climatology tests (see this article for a more detailed description of the specific implementation). Note that the climatology test is a site-specific seasonally varying range test and not a World Ocean Atlas-like climatology. These two tests, in addition to other tests under development, utilize thresholds and ranges which are calculated from existing OOI datasets. The code used to calculate the thresholds is publicly available at the oceanobservatories ooi-data-explorations github repository and resulting threshold tables are available at the oceanobservatories qc-lookup github repository. The tests executed and results are added to the datasets as variables named _qartod_results and _qartod_executed, with the relevant tested data variable name prepended (e.g. practical_salinity would be practical_salinity_qartod_results and practical_salinity_qartod_executed). The _qartod_executed variable is a list of the individual results of each of the tests applied stored as a string. The tests applied and the order in which they were applied are stored in the variable metadata attributes. The _qartod_results provide a summary result of all the tests applied.
WHAT IS THE CURRENT OOI QARTOD STATUS?
The IOOS QARTOD manuals define the tests for each instrument class as “Required,” “Recommended,” and “Suggested”. The OOI priority will be the “Required” tests for each instrument class in use by OOI. “Recommended” and “Suggested” test development will be reviewed, with the support of subject matter experts, in the future. The IOOS QARTOD manuals can be found at Quality Assurance/Quality Control of Real Time Oceanographic Data – The U.S. Integrated Ocean Observing System (IOOS).
Current tests under development are gross range (GRT) and climatology (CT). The gap test (GT) will follow next. The syntax and location tests are considered operational checks and are handled within OOI operations and management systems. QARTOD test data will be available in specific locations where OOI supplies data, starting with M2M, and then propagated to THREDDS and Data Explorer. The current status of QARTOD test development and availability is shown in Table 1.
[media-caption path="/wp-content/uploads/2022/10/QARTOD-Table-1.png" link="#"]Table 1: Current Status of Development & Availability[/media-caption]
[media-caption path="/wp-content/uploads/2022/10/QARTOD-Figure-1.png" link="#"]Figure 1: QARTOD “Required” Test Development Timeline[/media-caption]
Read MoreOOI Rolls Out Initial QARTOD Tests

As part of the ongoing the Ocean Observatories Initiative (OOI) effort to improve data quality, OOI is implementing Quality Assurance of Real-Time Oceanographic Data (QARTOD) tests on an instrument-by-instrument basis. Led by the United States Integrated Ocean Observing System (U.S. IOOS), the QARTOD effort draws on the ocean observing community to provide manuals, which outline and identify tests to evaluate data quality by variable and instrument type. Currently, OOI is focused on implementing the Gross Range and Climatology Tests for the variables associated with CTD, pH, and pCO2 sensors. Over the coming months tests will be applied to data collected by pressure sensors, bio-optical sensors, and dissolved oxygen sensors. Ultimately, where and when appropriate, QARTOD tests will be applied to the relevant variables for all OOI sensors.
The Gross Range test aims to identify data that fall outside either the sensor measurement range or is a statistical outlier. OOI identifies failed/bad data with a threshold value based on the calibration range for a given sensor. We also calculate suspicious/interesting data thresholds as the mean ± 3 standard deviations based on the historical OOI data for the variable at a deployed location. As implemented by OOI, the Gross Range test identifies data that either fall outside of the sensor calibration range, and is thus “bad”, or data that are statistical outliers based on the historic OOI data for that location.
The Climatology Test is a variation on the Gross Range Test, modifying the relevant suspicious/interesting data thresholds for each calendar-month by accounting for seasonal cycles. The OOI time series are short (<8 years) relative to the World Meteorological Organization (WMO) recommended 30-year climatology reference period. To help ensure quality, we calculate seasonal cycles for a given variable using harmonic analysis, a method that is less susceptible to spurious values that can arise either from data gaps, measurement errors or from the presence of real, but anomalous, geophysical conditions in the available record. First, we group the data by calendar-month (e.g. January, February, …, December) and calculate the average for each month. Then, we apply the monthly-averaged-data with a two-cycle (annual plus semiannual) harmonic model. Each harmonic is determined using a least-squares fit – a procedure that minimizes the sum of the squares of the differences between the data points and the curve to be fit. This produces a “climatological” fit for each calendar-month.
Next, we calculate the standard deviation for each calendar-month from the grouped observations for the month. The thresholds for suspicious/interesting data are set as the climatological-fit ± 3 standard deviations. Occasionally, data gaps may mean that there are no historical observations for a given calendar-month. In these instances, we linearly interpolate the threshold from the nearest months. For sensors mounted on profiler moorings or vehicles, we first divide the data into subsets using standardized depth bins to account for differences in seasonality and variability at different depths in the water column. The resulting test identifies data that fall outside of typical seasonal variability determined from the historic OOI data for that location.
Read More