
Posts Tagged ‘UW’
2025 OOIFB Summer School on Acoustics: Applications Now Open
The Ocean Observatories Initiative Facility Board (OOIFB), funded by the U.S. National Science Foundation (NSF), is hosting the 2025 Summer School on Acoustics from July 14–18, 2025, at the University of Washington in Seattle, WA.
This five-day, in-person program will provide targeted lectures, hands-on tutorials, and practical exercises using real-world examples and NSF Ocean Observatories Initiative (OOI) data products. Participants will focus on accessing, analyzing, and interpreting acoustic data alongside complementary oceanographic datasets available through OOI.
By the end of the program, participants will have a deeper understanding of underwater sound propagation, passive and active acoustic instruments (e.g., hydrophones and echosounders) deployed through OOI, and the available datasets. They will also learn how to navigate OOI data portals, apply basic acoustic data processing methods, and explore how these data can support scientific research. The program also offers opportunities to connect with a professional network of researchers using OOI data.
There are no registration fees, and travel support is available for participants from U.S. institutions. For details on program requirements, eligibility, a draft agenda, and the application process, visit the OOIFB Summer School on Acoustics webpage.
Please share this opportunity with your colleagues and networks. For questions, contact Holly Morin (holly@ooifb.org).
Read MoreNational Science Foundation Renews OOI for Another Five Years
The National Science Foundation (NSF) announced that it has awarded a coalition of academic and oceanographic research organizations a second, five-year contract to operate and maintain the Ocean Observatories Initiative (OOI). The coalition, led by the Woods Hole Oceanographic Institution (WHOI), and including the University of Washington (UW) and Oregon State University (OSU), will continue operations of the OOI, a science-driven ocean observing network that delivers real-time data to address critical science questions regarding the world’s oceans.
WHOI has led the operations and management aspects of the OOI since 2018 and will continue to serve as the home for the next five years of the OOI Project Management Office, led by Principal Investigator James B. Edson and Sr. Program Manager Paul Matthias.
The OOI collects and serves measurements from more than 900 autonomous instruments on the seafloor and on moored and free-swimming platforms that are serviced during regular, ship-based expeditions to the array sites. Data from each instrument are transmitted to shore and are freely available to users worldwide, including scientists, policy experts, decision-makers, educators, and the public.
Under this new $220 M investment, each institution will continue to operate and maintain the portion of OOI assets for which it is currently responsible: WHOI will operate the Pioneer Array in the mid-Atlantic Bight off the North Carolina coast, subject to environmental permitting, and the Global Arrays in the Irminger Sea off the southern tip of Greenland and at Station Papa in the Gulf of Alaska; UW will operate the Regional Cabled Array that extends across the Juan de Fuca tectonic plate and through the overlying ocean; and OSU will operate the Endurance Array off the coast of Washington and Oregon. OSU also houses and operates OOI’s Data Center that ingests and delivers all OOI data.
“OOI has proven to be an exceedingly valuable source of information about the ocean,” said NSF Program Officer for OOI George Voulgaris. “Its freely available data are contributing to better understanding of ocean processes and how the ocean is changing. Scientists are using OOI data as the source of cutting-edge scientific discoveries—everything from getting close to predicting underwater volcanic eruptions to changing ocean circulation patterns that have real life implications for weather and fishing patterns. OOI data also are serving as inspiration for students in the classroom, who are excited about learning about the ocean with access to real-time ocean data. We at NSF are proud of our continued investment in making these data available.”
“WHOI is honored to have been selected to continue the mission of the OOI, which is providing valuable ocean data at a time when it is critically needed,” said Peter de Menocal, President and Director of the Woods Hole Oceanographic Institution. “The continued extreme weather events reinforce the importance of this ocean monitoring program to provide science-based data that is accessible to researchers, modelers, agencies, and the public, and we look forward to being part of the continued scientific advancements from this transformational program in the years ahead.”
The Project Management Office at WHOI collaborates with NSF to provide high-level oversight and financial management of the project. In addition, the office coordinates with partner institutions to establish annual priorities for each of the arrays individually and for the network. “The WHOI team and our partners at UW and OSU have learned a great deal over the past five years and are grateful that our efforts to perfect OOI and its data delivery system have been recognized,” said WHOI Senior Scientist Jim Edson, lead principal investigator on the OOI. “We look forward to the next five years where we can continue to perfect our collection and serving of data, while encouraging its increased use and collaboration among ocean scientists funded by NSF and other agencies.”
——————————————
About the Ocean Observatories Initiative
The Ocean Observatories Initiative is a science-driven ocean observing network that delivers real-time data from more than 900 instruments to address critical science questions regarding the world’s oceans. The National Science Foundation has funded the OOI, under Cooperative Agreement No. 1743430, to encourage scientific investigation. OOI data are freely available online to anyone with an Internet connection.
The U.S. National Science Foundation is an independent federal agency that supports science and engineering in all 50 states and U.S. territories.
Any opinions, findings, and conclusions or recommendations expressed in this material are those of the author(s) and do not necessarily reflect the views of the National Science Foundation.
Read More
Seismic Hazards Around the Globe: A Visualization Tool to Bring RCA Data into the Classroom
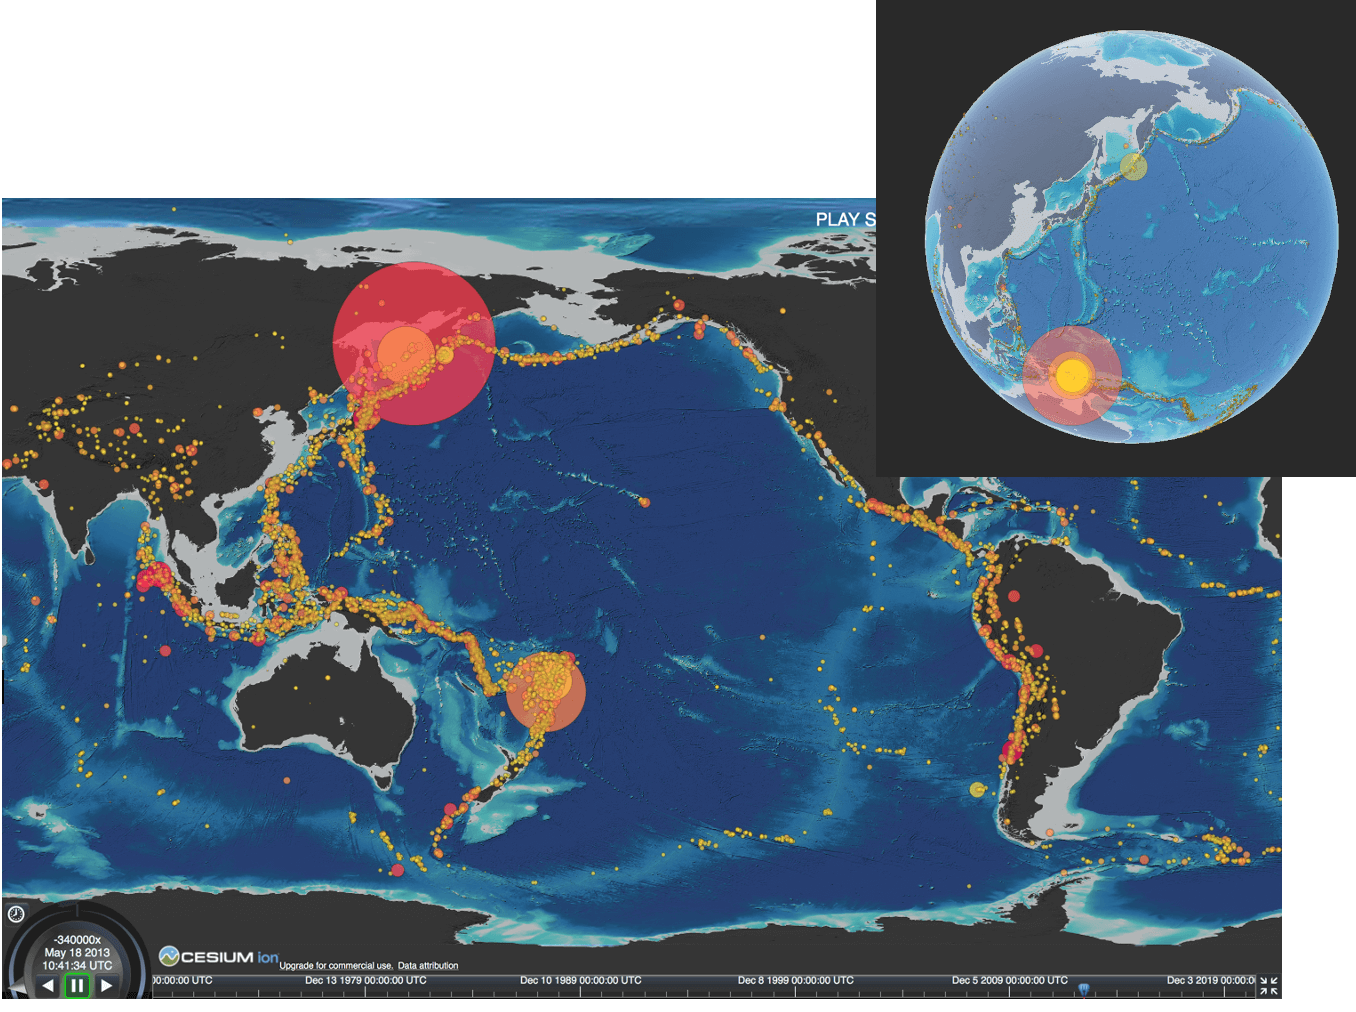
As part of the continuing University of Washington engagement effort, and in preparation for the new National Science Foundation K12 education award focused on bringing OOI data into the classroom, Kelley collaborated with the Center for Environmental Visualization within the School of Oceanography to generate an earthquake exploration tool focused on seismic events within the global oceans from 1970 to present. We anticipate that one of the curriculum modules developed for the K12 program will be focused on geohazards, with an emphasis on the Cascadia Subduction Zone within the context of the “ring of fire.” A video of this animation is hosted on interactive oceans and a direct link to the developmental site is provided above. The animation will be used in a Queens College physical geology class this next year that has 150 students (Dr. Dax Soule). This effort is also in preparation for completing a similar visualization focused on Axial Seamount and Regional Cabled Array seismic data.
The data sets used for this effort include a map centered on the Pacific Ocean that shows the distribution of earthquakes of magnitude ≥6 in the U.S. Geological Survey catalog from 1970 through 2021. The topographic dataset is licensed under Creative Commons CC BY-4.0. The data were formatted to match the JSON format recommended for use of global visualization using the ‘Cesium’ interactive virtual earth viewer promoted within its 3D geospatial visualization for the web toolset. The Cesium JavaScript API was utilized to implement algorithms for procedural color determination based on magnitude and hypocenter point radius animation based on the date-time of the earthquake event. The resultant animation is highly interactive, allowing the user to choose a 3D global view or a flat view, and viewing speeds of 1-8 times. In addition, the field of view can be changed to move to a specific area of interest and includes zoom capabilities. A sliding time bar allows the user to focus in on particular items of interest.
Read More