
Posts by ooistaff
Pioneer 15 Underway
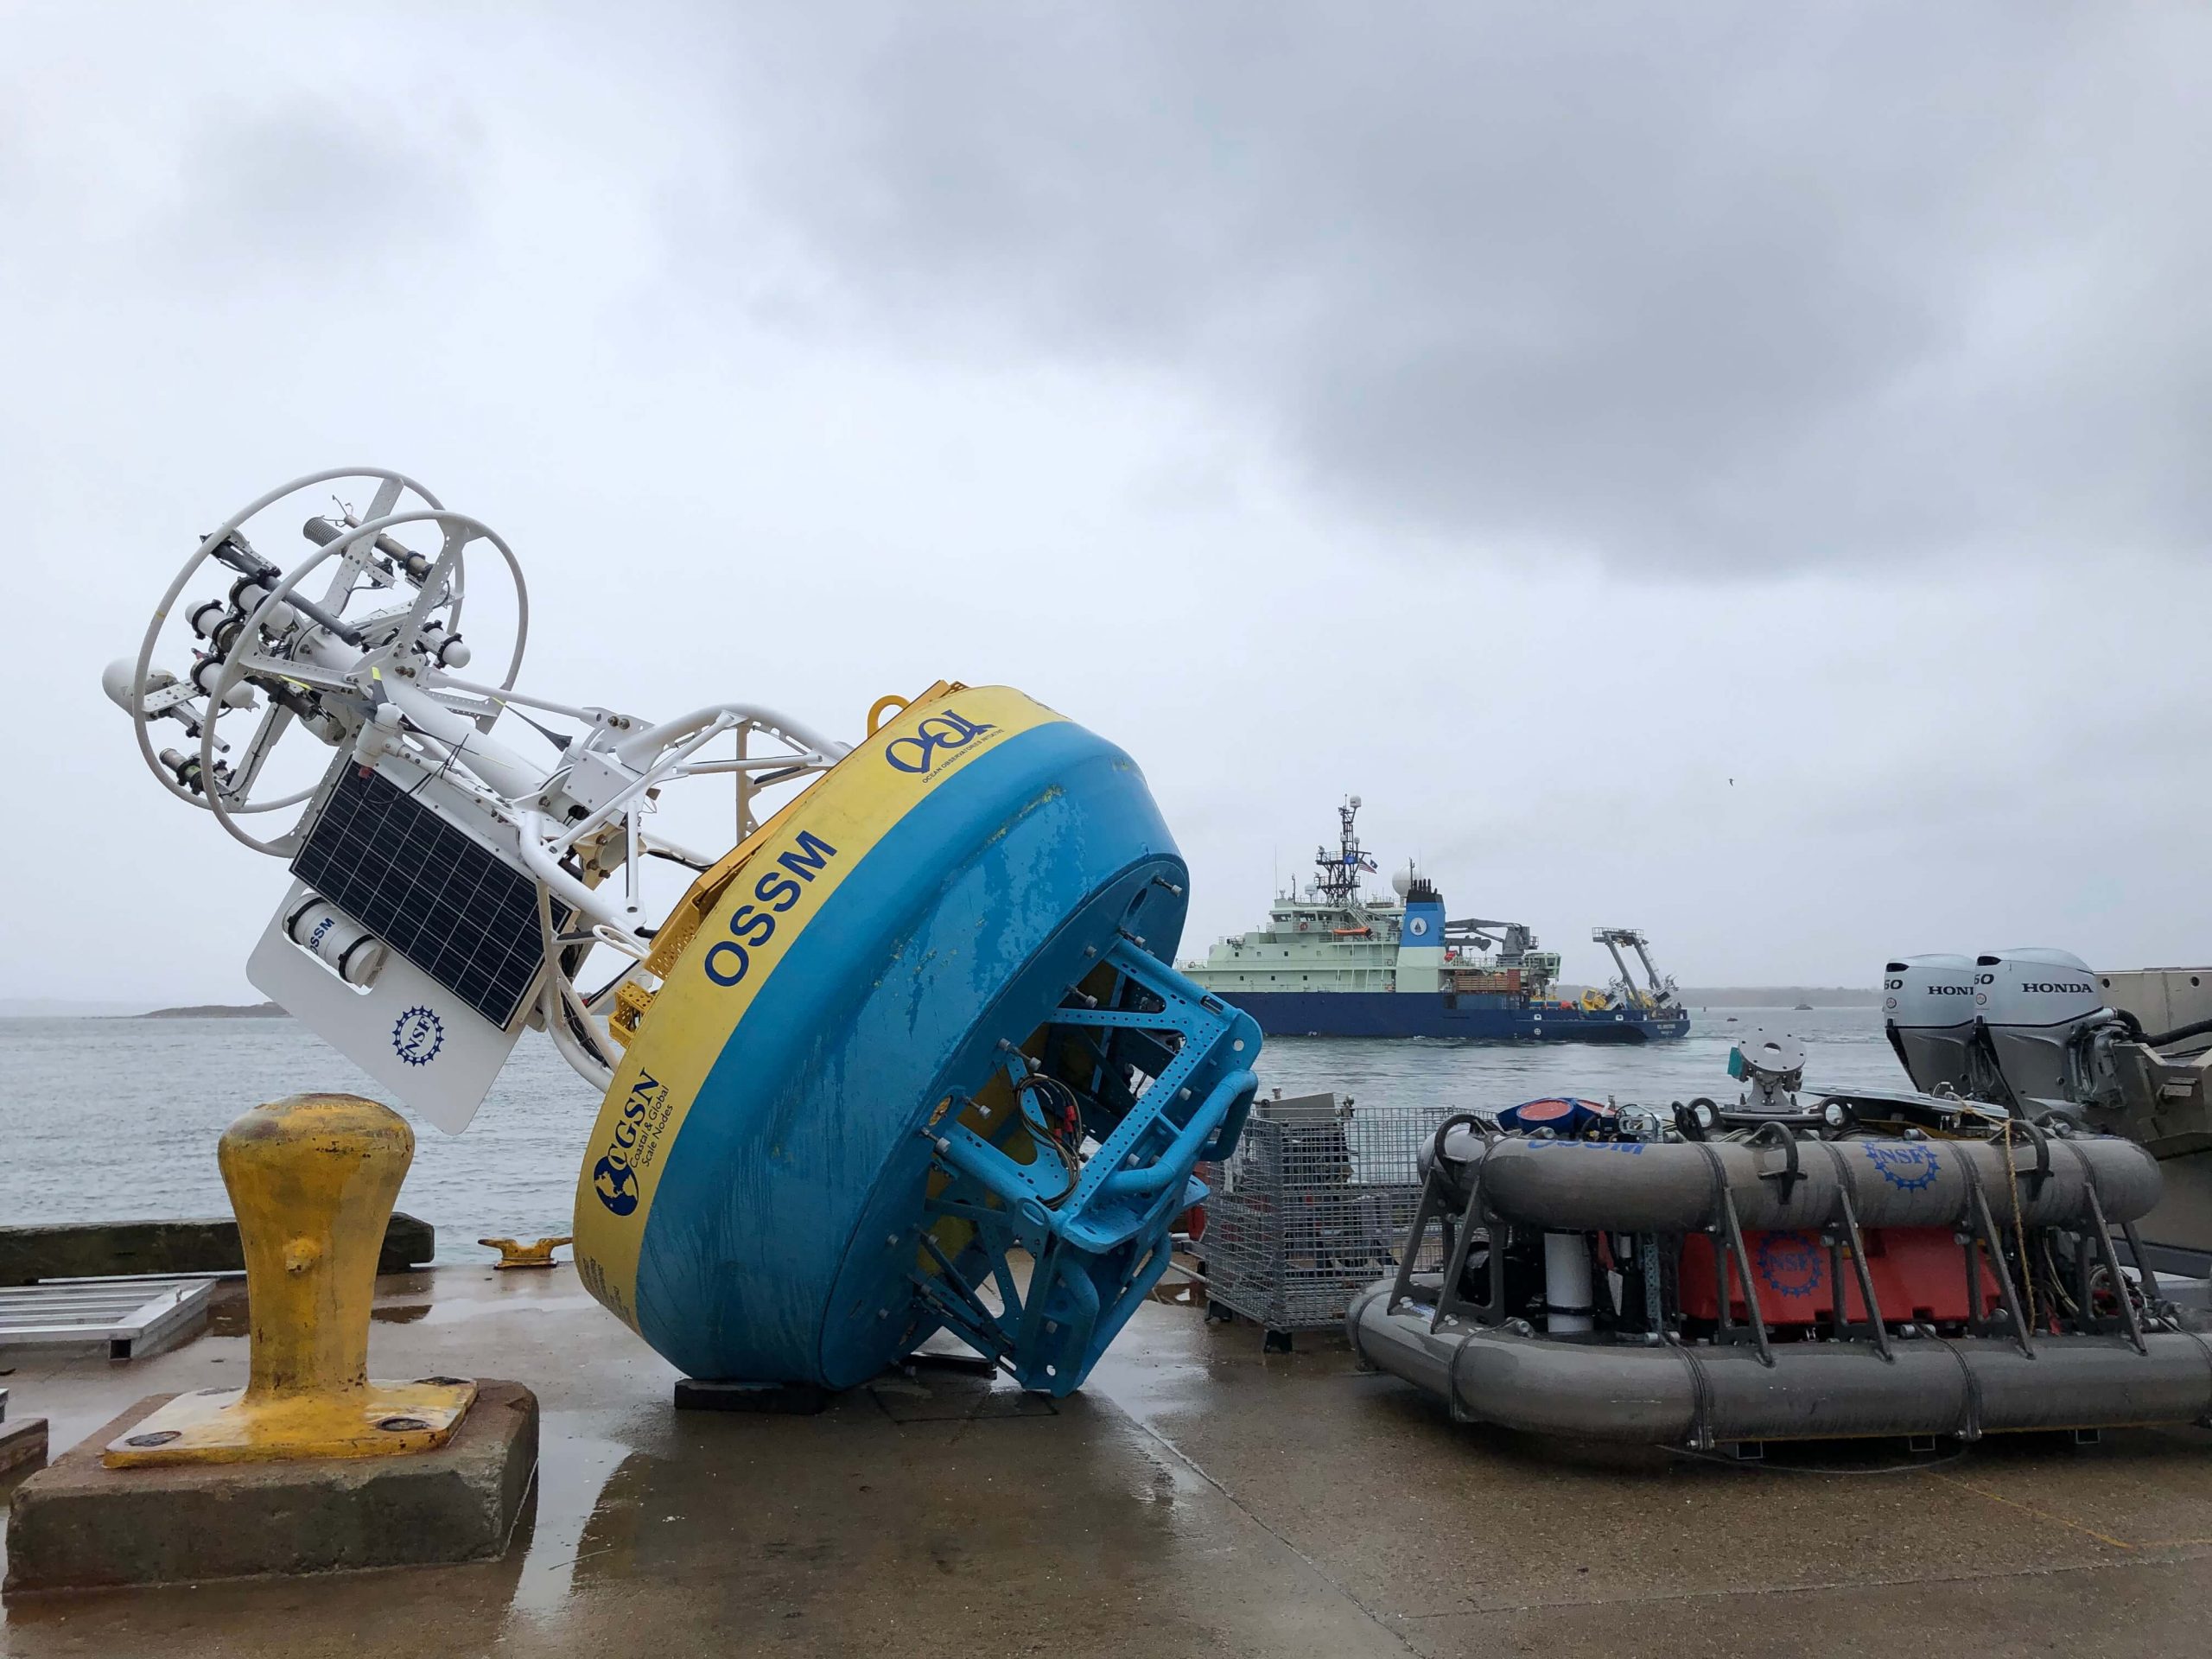
[media-caption path="/wp-content/uploads/2020/11/IMG_0034-scaled.jpeg" link="#"]The Pioneer 15 Team departs aboard the R/V Neil Armstrong, framed by equipment that awaits deployment on leg two. [/media-caption]
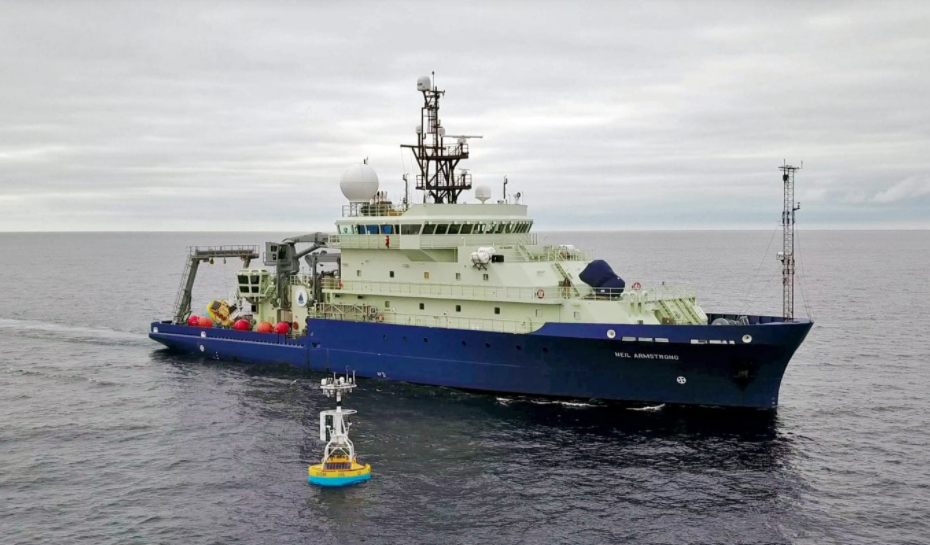
On October 28th, ten scientists and engineers from Woods Hole Oceanographic Institution departed aboard the R/V Neil Armstrong headed to the Pioneer Array, about 75 nautical miles south of Martha’s Vineyard in the Atlantic Ocean. This trip is the 15th time that a team has traveled to the Pioneer Array to recover and deploy equipment at the site.
The team will recover and deploy three coastal surface moorings and a profiler mooring, and deploy two winter coastal profiler moorings. They will also conduct CTD (Conductivity, temperature, and depth) casts and water sampling at the deployment and recovery sites. In addition, the team will compare ship and buoy meteorological measurements at the surface mooring sites as a way to validate the mooring measurements.
“We’ve been isolating for 14 days, have successfully passed 2 COVID-19 tests, and are ready to go, “ said Sheri White, chief scientist for Pioneer 15. “This is a two-leg expedition because we can’t fit all of the moorings on the deck for one trip to the array. We plan to be in port on November 4th to swap out gear, but we can adjust our schedule accordingly. If bad weather picks up, we can head back to port early to collect the equipment for leg two and not lose valuable time at sea when we can’t work due to weather.” The ship is expected to return from leg two on 11 November.
The surface moorings being recovered have been deployed for one year – six months longer than intended, due to the COVID-19 pandemic – and so are starting to experience some wear and tear. The new moorings being deployed incorporate design updates intended to improve the robustness of components such as the wind turbines and stretch hoses. The team also will be deploying a prototype quad transducer for the ZPLSC instrument. The ZPLSC is a bio-acoustic sonar which measures acoustic signals of plankton and zooplankton at the OOI Coastal Arrays. It has transducers that emit at frequencies of 38, 125, 200 and 400 kHz (the latter three are all from a single quad-transducer). The new quad transducer design should lead to less failures and improved data collection for that instrument.
In addition to performing OOI tasks, the team will be conducting ancillary work to support the Northeast Shelf Long Term Ecological Research (NES-LTER) program. This will include CTD casts, and sampling from the ship’s underway seawater system with an Imaging FlowCytobot (IFCB) instrument.
The members of the scientific party include:
Sheri White, WHOI, Chief Scientist
Chris Basque, WHOI, Deck Lead
Jennifer Batryn, WHOI, Instrument Lead
Collin Dobson, WHOI, Surface Mooring Lead
Meghan Donohue, WHOI, Deck Ops
Eric Hutt, UNOLS, Deck Ops
John Lund, WHOI, Profiler Mooring Lead
Josh Mitchell, UNOLS, Deck Ops
Rebecca Travis, WHOI, Documentation Lead
Dave Wellwood, WHOI, Water Sampling
Read More
OOI Data in Research and in the Classroom
OOI Principal Investigator John Trowbridge gives a short overview of OOI and its capabilities of delivering real time ocean data, followed by a lively Q&A. Everything you need to know about OOI in 22 short minutes.
https://youtu.be/ddboz9XO6xU
Read MoreLive Lightning Talks
Join this group of scientists as they share what they are learning from OOI data in short five-minute presentations.
Wednesday 9 December 2020, 6-7 pm Eastern. To listen in, sign on here.
Shima Abadi
University of Washington
Characterization of ocean rain and wind noise using the OOI broadband hydrophones and surface buoys at the Coastal Endurance Oregon Shelf and Offshore location
Bill Davis
Beachnecessities.com
Ideas for growing consumption and use of OOI data
Rachel Eveleth
Oberlin College
OOI data as an accessible data source for undergraduate research in coastal marine carbon cycling
Erik Fredrickson
University of Washington
Exploring short term deflation events at Axial Seamount with cabled pressure and tilt sensors
Natalie Freeman
University of Colorado Boulder
Using observations from the Global Southern Ocean array to assess the fitness of a 1-D model to evaluate the response of the upper ocean to high-frequency wind variability
Matthew Lobo
Portland State University
Deriving higher-resolution, empirical representations of the vertical structure/normal modes of horizontal kinetic energy using wire-following profiler technology
Aaron Mau
University of South Carolina
In the classroom: A firsthand approach to learning with OOI data
Chris Russoniello
West Virginia University
OOI Early Career Scientist Working Group demonstrates the capability of interdisciplinary, remote collaboration
William Wilcock
University of Washington
Steps towards installing a resident autonomous underwater vehicle at Axial Seamount.
William Wilcock
University of Washington
Alternative senior thesis plans when the traditional senior cruise on the R/V Thomas G. Thompson was not feasible
Guangyu Xu
University of Washington
Monitoring Hydrothermal Plumes at ASHES Vent Field, Axial Seamount through Quantitative Acoustic Imaging
Read More
OOIFB Town Hall
Tuesday, 8 December 2020
10:00-11:00 am Eastern
Ocean Observatories Initiative Facility Board Town Hall
The Ocean Observatories Initiative Facilities Board (OOIFB) is hosting a Town Hall during the virtual 2020 Fall AGU meeting. The community will have the opportunity to hear the latest information about the OOI facility, meet the OOIFB members, and learn about research using OOI data. The new OOI Data Explorer tool will be demonstrated, the exciting activities of OOI education programs will be featured, and early career scientist activities will be highlighted.
The Town Hall will include a series of lightning presentations where scientists are invited to present one slide in one minute explaining how s/he has used (or plans to use) freely available observatory data in their respective research.
We hope you will attend!
Read More
See the Data Explorer in Action!
In case you missed it, here is an opportunity to see a live demo of the new Data Explorer tool. OOI Data Deliver Lead Jeff Glatstein provides a quick look at how the Data Explorer was developed. Craig Risien of the Coastal Endurance Array Team follows with a live demonstration of the tool’s capabilities using Endurance Array data to create a data view. Axiom Developer Brian Stone concludes the demo by answering questions and digging deeper into the many features of this outstanding new tool.
Watch now!
https://youtu.be/BBxdii0M-nA
Read More
OOI Irminger Sea Data Helping Fill Critical Gap in Climate Models
Researchers at Woods Hole Oceanographic Institution (WHOI) were recently awarded a $500,000 grant from the National Oceanic and Atmospheric Administration’s (NOAA) Climate Observations and Monitoring (COM) program to develop machine learning tools to improve estimates of air-sea heat exchange in the Arctic Ocean and adjacent seas. These tools are expected to fill critical gaps in climate models, which currently show large disparities when simulating the rate of polar ice melt.
Recent advances in remote sensing technologies have provided researchers with the data they need to better understand the forces behind Arctic ice melt and the implications of that heat exchange between the ocean and the atmosphere. These real-world measurements will allow researchers to develop algorithms that will validate and improve satellite-based modeling of the Arctic and subarctic regions.
Due to the difficulty of accessing the Arctic Ocean—especially during the stormy winter months—and the complexity of measuring air-sea heat exchanges, there has previously not been enough quality data to incorporate ice melt and seasonal changes into climate models. This challenge was overcome by recent advances in long-term remote data collection at high latitudes. For the first time in 2019, an Ocean Observatories Initiative (OOI) surface buoy in the Irminger Sea collected over a year’s worth of sensor data, including icy and windy winter conditions. Located in an important area of ocean circulation, the data collected from the OOI surface buoy provides critical verification for satellite-based models.
Lisan Yu, a WHOI senior scientist and the project’s principal investigator, said a machine learning-based framework will improve the accuracy of ocean-surface forcing estimates used to model the global climate. She said it will also improve the accuracy of ice and weather forecasts in a region that is rapidly opening up to commercial exploration. WHOI Senior Scientist Al Plueddemann, who also serves as a co-principal investigator for OOI and project lead for its Coastal and Global Nodes, is a collaborator on this project.
Read the full release here.
Read MoreMaking OOI’s Website Accessible to All
[media-caption path="/wp-content/uploads/2020/10/OOI-screenshot-01.jpg" link="#"]The OOI website was redesigned with accessibility and ease of use for all visitors as a top priority. [/media-caption]
Accessibility means different things to different people. When visiting a website by the visually or physically impaired, accessibility means the difference between being able to navigate and understand the site or getting lost in a labyrinth-like design with literally hidden pitfalls and navigational traps.
In redesigning OOI’s website, making the site accessible and easily navigable to all visitors was a top priority. “Websites are all about the user experience. It’s not simply about building something to experience the beauty on the screen, but rather building for everyone trying to access that information and treating them equally,” explained Nate King, web developer with Trapeze, the firm which designed and coded the new site.
“To be perfectly accessible, there would be very little design, most websites would consist of simple text on a screen. But there is a reason we put beauty into websites and that we please people with what is seen on the screen. That doesn’t mean that beauty and the experience have to be at the expense of accessibility. They can be intertwined as we have successfully done with OOI’s new website.”
King used a three-pronged approach to make OOI’s website accessible to those with visual, and other physical limitations. He developed a navigation system for keyboard users, who do not or are unable to navigate using a mouse, which takes them through the content in a logical way. He also incorporated audible-only information into the design that will help those who are blind or with other visual impairments navigate the site by providing context regarding its organization and logic when using screen reader technology. Lastly, King worked with the designers to ensure people with visual impairments such as color or partial blindness could successfully navigate the site and be able to differentiate its various components.
“As long as you put the time and effort into it—preferably from the outset—a site can be both beautiful and accessible, which we achieved here,” added King.
The OOI website represents a high standard for accessibility as it attempts to meet or exceed the Web Content Accessibility Guidelines (WCAG). Meeting such accessibility guidelines levels the playing field for all visitors to the website, giving every visitor to the site equal access to the information.
King further explained that the OOI site was designed with a logical approach to enhance its accessibility. For example, headline sizes/styles are used in a predictable way—headings contain semantically correct structure, the single H1 contains H2 headlines which in turn contain H3 headlines—rather than choosing headline sizes based on the designer’s preference. The accompanying audible information guides the visually impaired and provides context when visiting the site, better explaining the navigation of the site, how the site is referenced through search, and where the visitor will land next. And, the OOI website’s design allows for magnification up to 200 percent to provide more visitors with the opportunity to experience and explore the site. “A website is not a piece of paper. It can expand, contract, and offers up all sorts of ways to get information to visitors,” said King. “We are delighted to have used an empathy-driven design methodology to help OOI make its site accessible to all.”
[media-caption path="/wp-content/uploads/2020/10/OOI-screenshot-04.jpg" link="#"] Keyboard navigation is accompanied by audio that explains where one is on the site and what to expect next.[/media-caption]
[media-caption path="/wp-content/uploads/2020/10/OOI-screenshot-03.jpg" link="#"] Context provided by the keyboard navigation system allows user to move through OOI’s website with ease.[/media-caption]
Read More
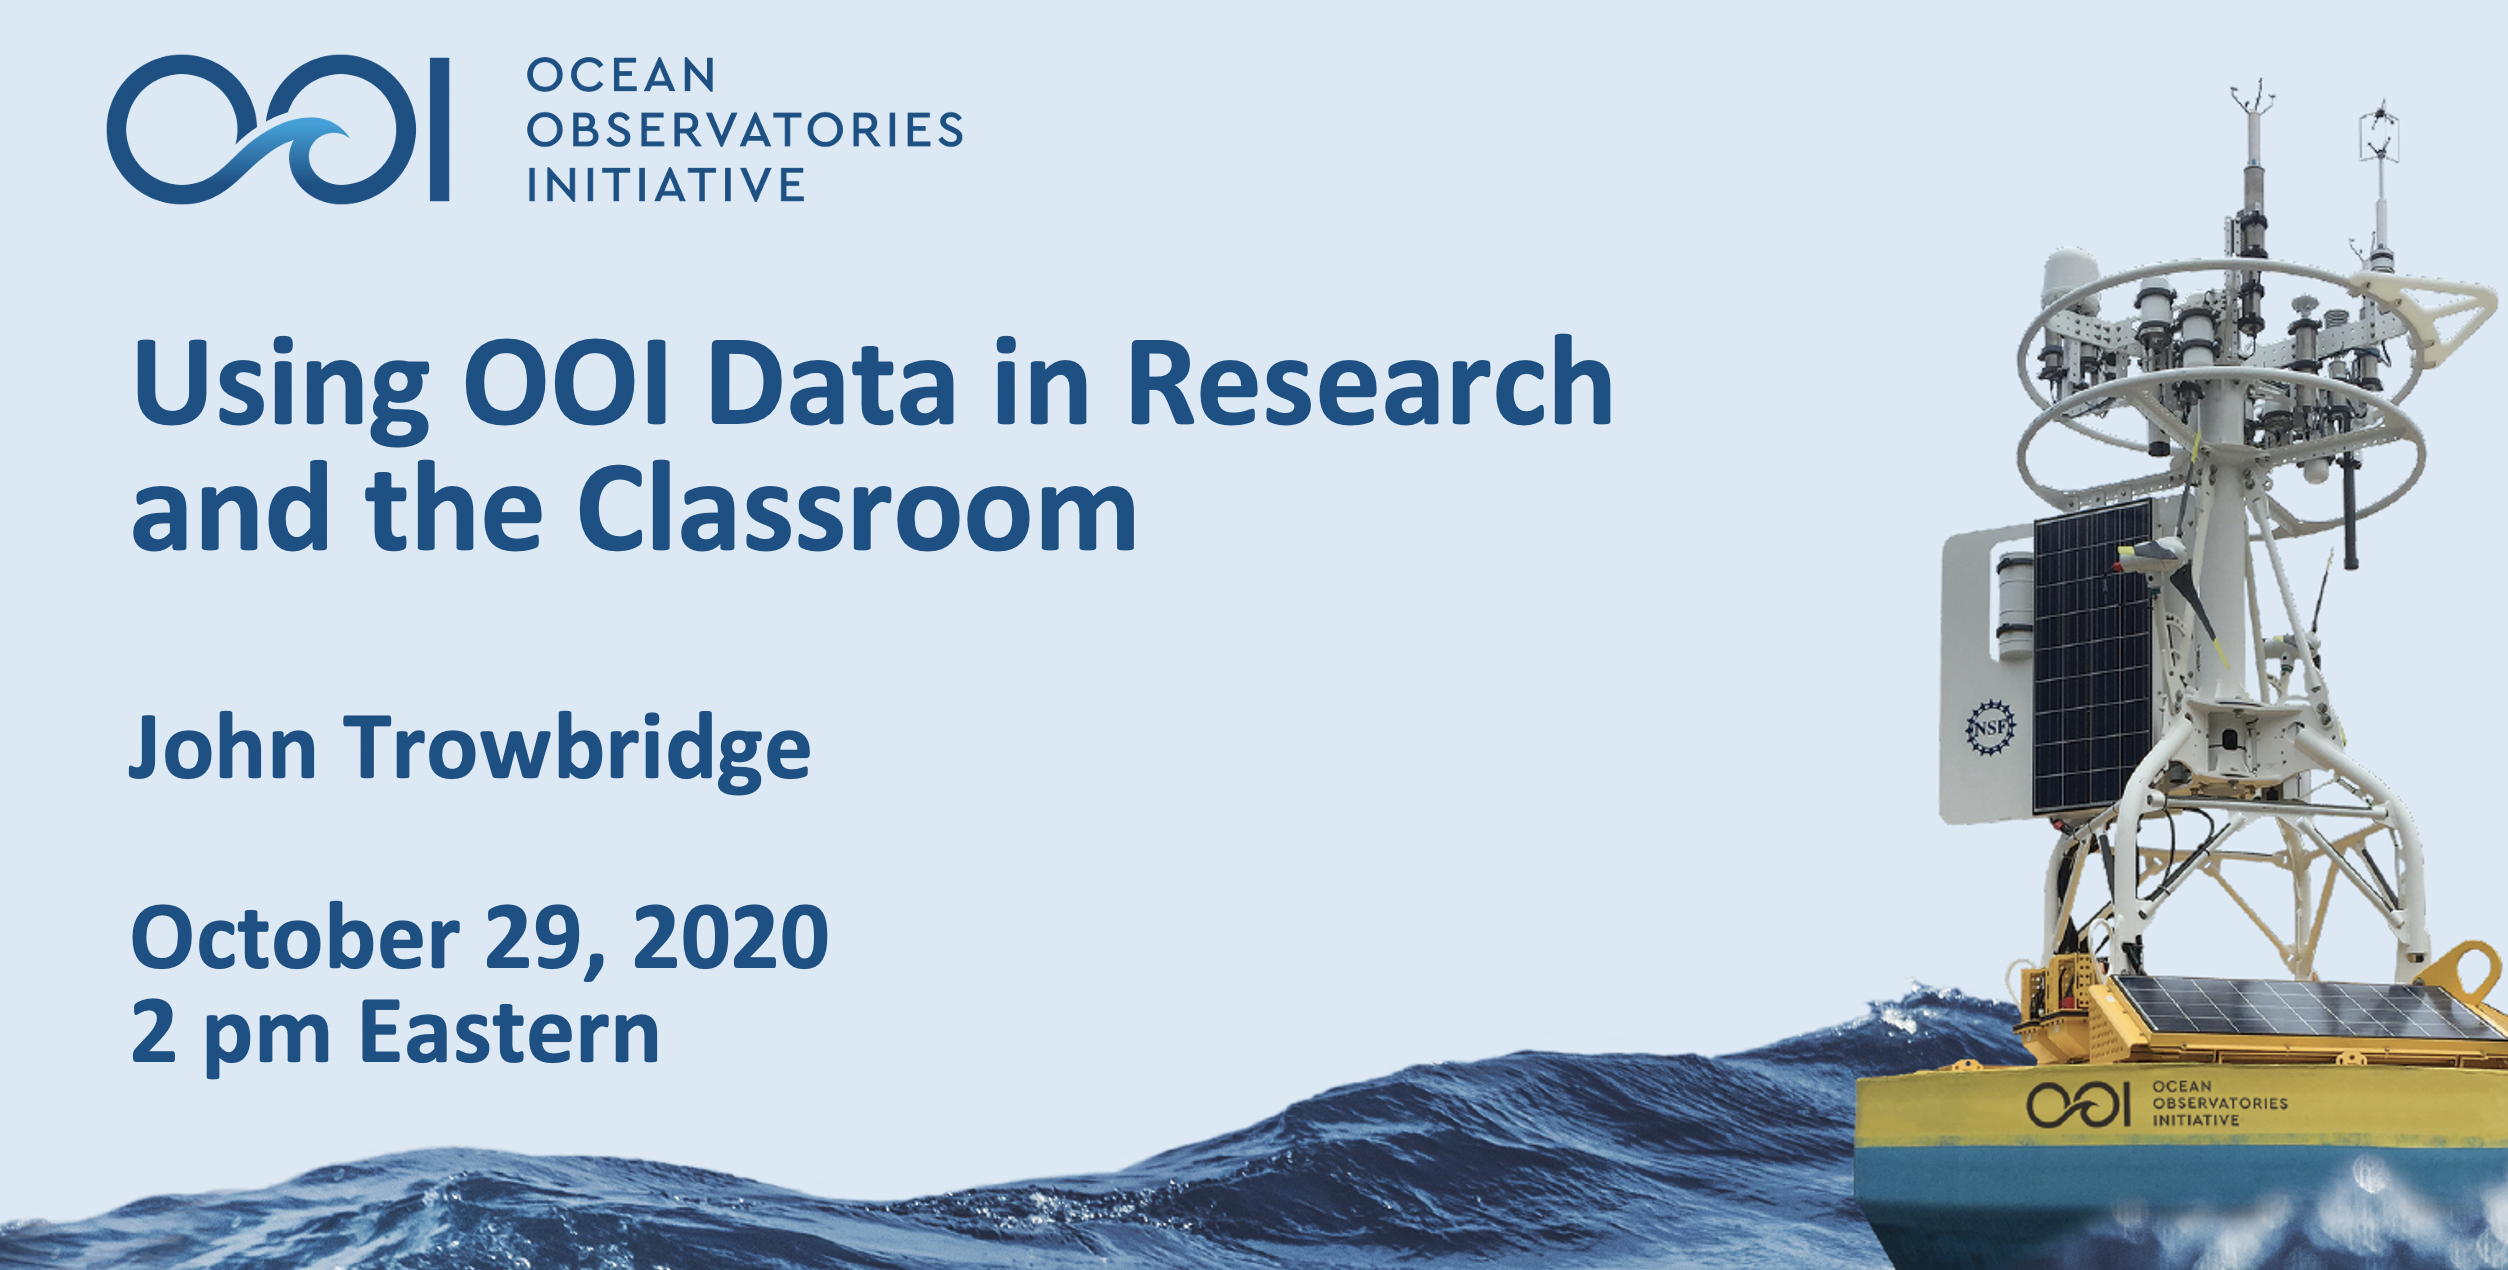
Oct 29: Opportunity to Learn More About the OOI
[media-caption path="/wp-content/uploads/2020/10/Screen-Shot-2020-10-23-at-2.33.33-PM.png" link="#"]To attend, please register for the webinar at bit.ly://newtoOOI. [/media-caption]
There is still time to register for this webinar here to learn more about OOI and how it can advance your research and aid you in the classroom.
Please join OOI Principal Investigator John Trowbridge in this webinar as he provides an overview of OOI, what it is, how it delivers data, and how researchers and instructors are using OOI data to advance what is known about the changing ocean. There will be ample opportunity to ask questions and engage in discussion.
This webinar is particularly helpful for those new to OOI.
Read More
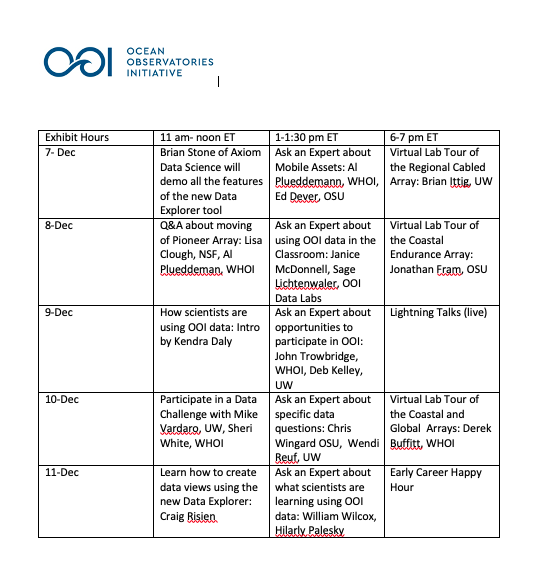
OOI Booth Schedule
The Ocean Observatories Initiative has a full plate of activities at its virtual AGU booth during AGU’s exhibit hall hours. Registration is required for the 11 am-noon time slots, indicated below. Please join us for all other activities, by simply clicking here:
Monday 7 December
- 11 am-noon Eastern: Learn how to use the new Date Explorer: Register here.
Brian Stone of Axiom Data Science will demonstrate the many features of the OOI’s new data discovery tool, Data Explorer.
- 1-1:30 pm Eastern: Ask an expert about specific data questions
OOI Data Team members Chris Wingard with the Coastal Endurance Array and Wendi Ruef with the Regional Cabled Array will be available to answer any and all questions.
- 6-7 pm Eastern: Curious about how OOI collects and delivers data?
Join Derek Buffitt, program manager for the Coastal and Global Scale Nodes (CGSN), for a virtual lab tour of the CGSN Facility at Woods Hole Oceanographic Institution.
Tuesday 8 December
- 11 am-noon Eastern: Announcement forthcoming
- 1-1:30 pm Eastern: Ask an expert about using OOI data in the classroom .
Sage Lichtenwaler from the OOI Ocean Data Labs has helped hundreds of professors seamlessly integrate OOI into undergraduate classrooms. He will be on hand to answer your question on how to use OOI data in your course instruction.
- 6-7 pm Eastern: Curious about how OOI collects and delivers data?
Join Jonathan Fram, program manager for the Coastal Endurance Array (EA), for a virtual lab tour of the EA Facility at Oregon State University.
Wednesday 9 December
- 11 am-noon Eastern: Hear from scientists who are using OOI data to advance their research: Register here.
Kendra Daly, chair of the Ocean Observatories Initiative Facilities Board, will provide a quick look at what’s new in the OOI’s latest science plan.
Glen Gawarkiewicz, Woods Hole Oceanographic Institution, will share what is now known about the shelf break exchange process.
Andrew Leising, Southwest Fisheries Science Center, National Oceanic and Atmospheric Administration, will review what we have learned about marine heatwaves.
Douglas S. Luther, University of Hawai’i at Manoa, will discuss internal tide impacts of ocean circulation.
Wu-Jung Lee, University of Washington, will review how echosounder data are accelerating marine ecological research. (To be confirmed).
- 1-1:30 pm Eastern: Ask an expert about opportunities to participate in OOI
OOI Principal Investigator John Trowbridge and Co-Principal Investigator and lead of OOI’s Regional Cabled Array Deborah Kelley will be on hand to answer any and all questions about how to get involved in the OOI.
- 6-7 pm Eastern: Live Lightning Talks
Eleven presenters will share the latest research investigations using OOI data, as well as examples of how OOI data are being integrated into classroom instruction.
Thursday 10 December
- 11 am-noon Eastern: Participate in a data challenge: Register here.
Two members of OOI’s data team, Mike Vardaro, RCA and University of Washington, and Andrew Reed, CGSN and Woods Hole Oceanographic Institution, will lead participants through a series of three data challenges to demonstrate the capabilities of the Data Explorer.
- 1-1:30 pm Eastern: Ask an expert about opportunities OOI’s mobile assets
Coastal and Global Scale Node Team members Al Plueddemann or Peter Brickley and Coastal Endurance Lead Edward Dever will answer questions about OOI’s mobile assets, everything from why we use them to what we are learning from them.
- 6-7 pm Eastern: Curious about how OOI collects and delivers data?
Join Brian Ittig or Dana Manalang of the Regional Cabled Array Team (RCA) for a virtual lab tour of the RCA Facility at the University of Washington.
Friday 11 December
- 11 am-noon Eastern: Learn how to create data views using the new Date Explorer: Register here.
OOI Data Team and Coastal Endurance team member Craig Risien will guide us through the steps of creating a data view using Coastal Endurance array data to demonstrate this feature of OOI’s new data discovery tool, Data Explorer.
- 1-1:30 pm Eastern: Ask an expert about what scientists are learning using OOI data
Join William Wilcock, University of Washington, and Hilary Palvesky, Boston College, to hear what they have learned using OOI data and how you might do the same.
- 6-7 pm Eastern: Early Career Scientists’ Happy Hour
Close down the OOI virtual booth by joining your friends and colleagues at a virtual hour. This is an opportunity to network, reconnect with friends and colleagues, and raise a glass together.
All activities other than the 11 am time slots can be accessed here. Look forward to seeing you soon!
Read More
What We Are Learning
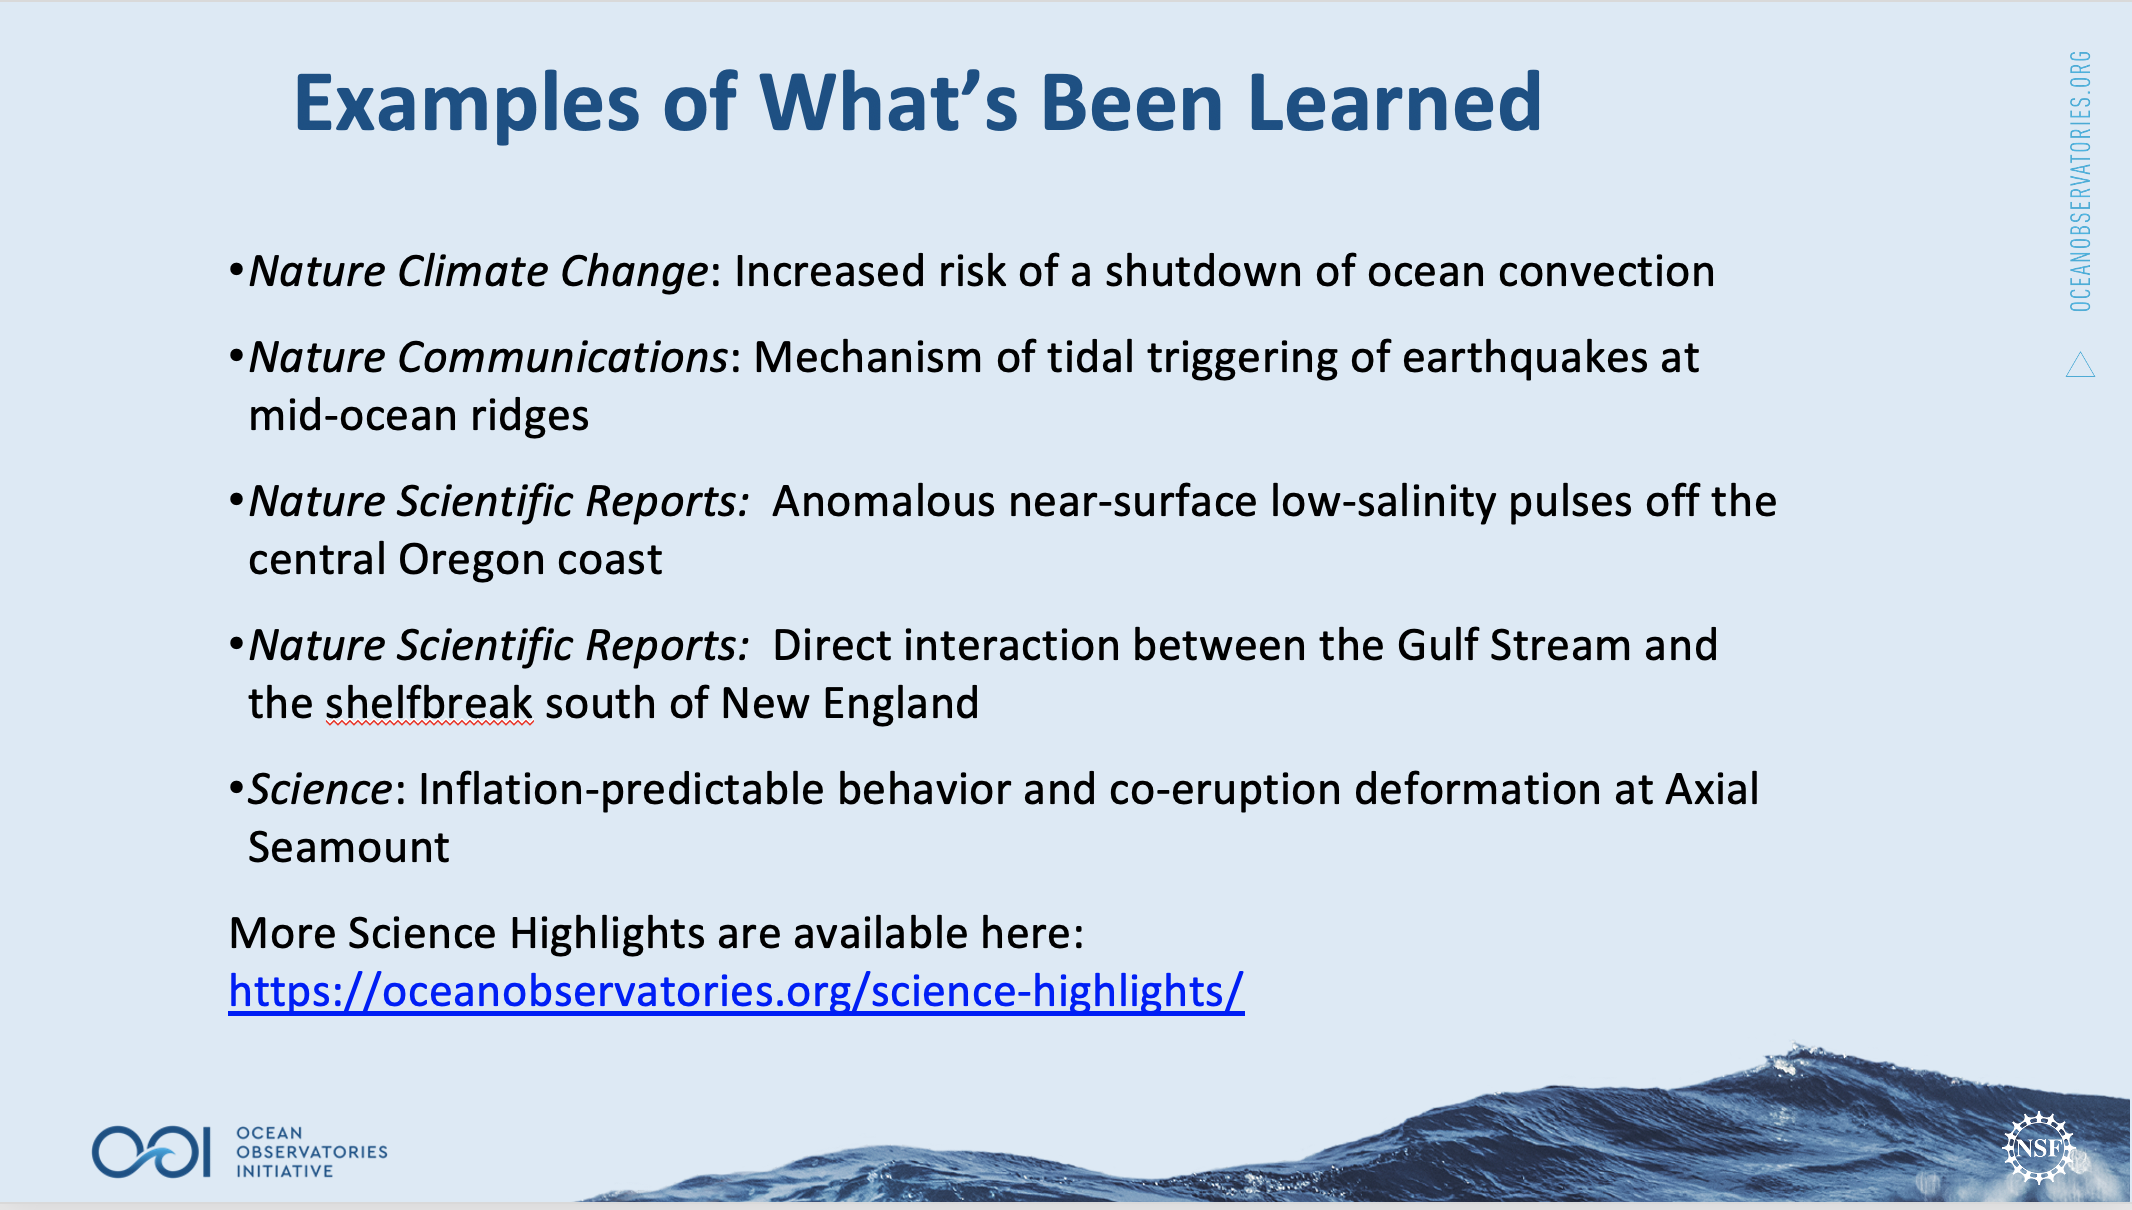
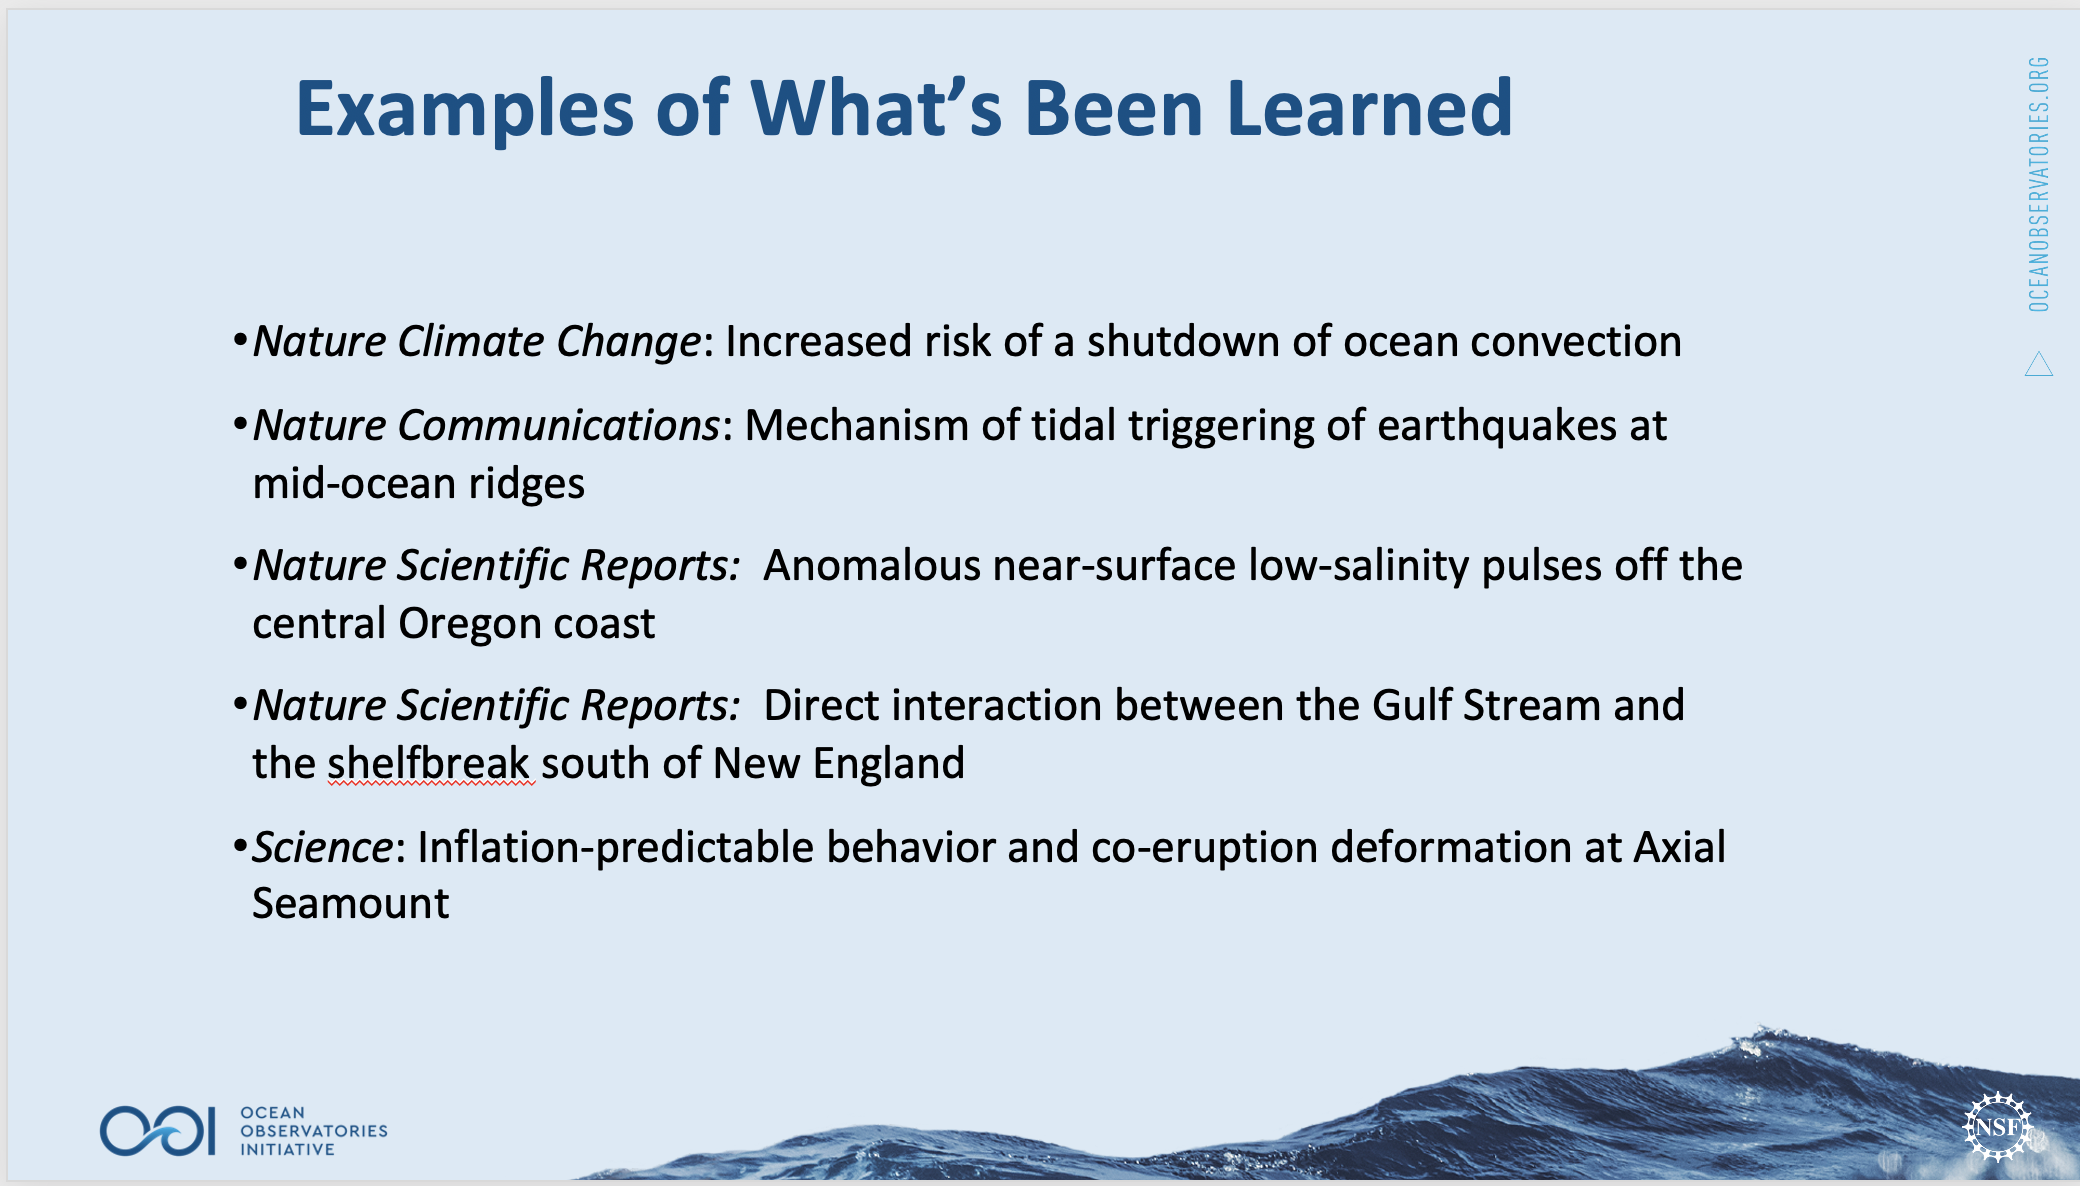
More Science Highlights are available here: https://oceanobservatories.org/science-highlights/
And here: https://oceanobservatories.org/science/publications/
Read More