
Posts by ooistaff
Return to Sea in the COVID-19 era

The R/V Neil Armstrong returned to its home port in Woods Hole, MA, on 16 June 2020, having completed a successful 10-day mission to service the Pioneer Array, 75 nautical miles south of Martha’s Vineyard. Its crew and nine-member science party from Woods Hole Oceanographic Institution proved that it is possible to work onboard while adhering to strict precautionary measures to prevent the spread of the coronavirus.
The expedition was the first science mission to have departed Woods Hole, MA following a “pause” in research expeditions imposed in March by UNOLS (University-National Oceanographic Laboratory System). UNOLS coordinates the U.S. academic research fleet ship schedules and has established guidelines for COVID prevention and mitigation aboard these ships.
“The preparation was arduous and comprehensive” said Al Plueddemann, Chief Scientist for the Pioneer Array expedition. “That preparation paid off with a cruise that completed everything we set out to do.” Plueddemann led the scientific team in a partial “turn” of the moored array, which means that equipment that had been deployed was recovered for refurbishment, and replaced with equipment that could undergo the rigors of being at sea, collecting, and recording data for the next six months. Over the 10 days, the team deployed five Coastal Profiler Moorings (CPMs) and recovered seven CPMs. In addition to the mooring turns, the expedition included many CTD casts (measuring Conductivity, Temperature and Depth) in the vicinity of the Pioneer Array, and the collection of shipboard meteorological and oceanographic data, both while on station next to the moorings, and while underway along specific track lines.
On top of what would be accomplished under normal operating conditions, the team was able to provide data in real-time to scientists who would normally be onboard, but whose participation was limited due to COVID-19 restrictions. Through an innovative use of data telemetry from the ship, WHOI’s Shipboard Scientific Services Group made it possible for members of the Northeast U.S. Shelf Long-Term Ecological Research (NES-LTER) team to receive data and images of phytoplankton and microzooplankton in near-real-time along the cruise track. The data were collected by Imaging FlowCytobots (IFCBs), which provide long term, high-resolution measurements of phytoplankton abundance and their cell properties.
“Our ability to conduct a near-normal cruise in the midst of the COVID-19 pandemic is a testament to the commitment to preparation from UNOLS and WHOI, and a reflection of the strong team within OOI and on the Armstrong” said Plueddemann. “We were all excited to get back to sea”.
The following is a collection of images from this successful mission.
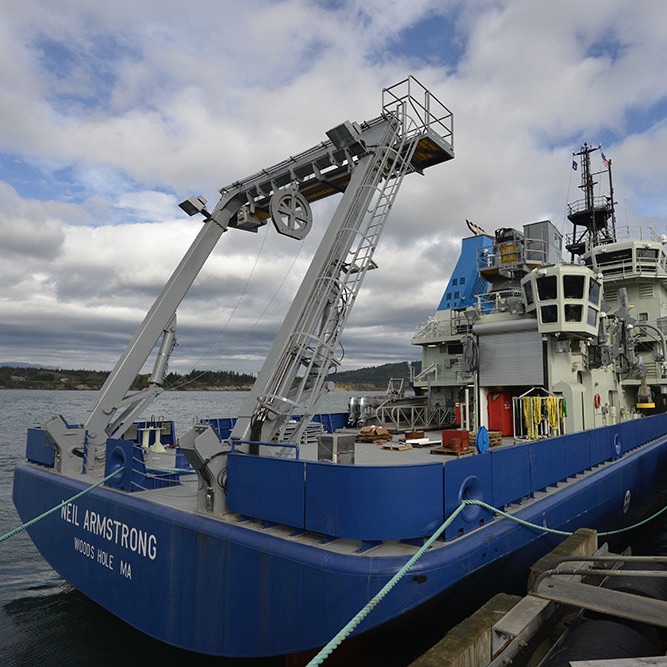
After 14 days of quarantine, a nine-person science team from Woods Hole Oceanographic Institution boarded the R/V Neil Armstrong on 5 June 2020 to prepare for a 10-day expedition to service the Pioneer Array, 75 nautical miles south of Martha’s Vineyard in the Atlantic Ocean.The expedition was the first science mission to depart Woods Hole, MA, with new COVID-19 precautions in place. Photo: © Woods Hole Oceanographic Institution, Rebecca Travis
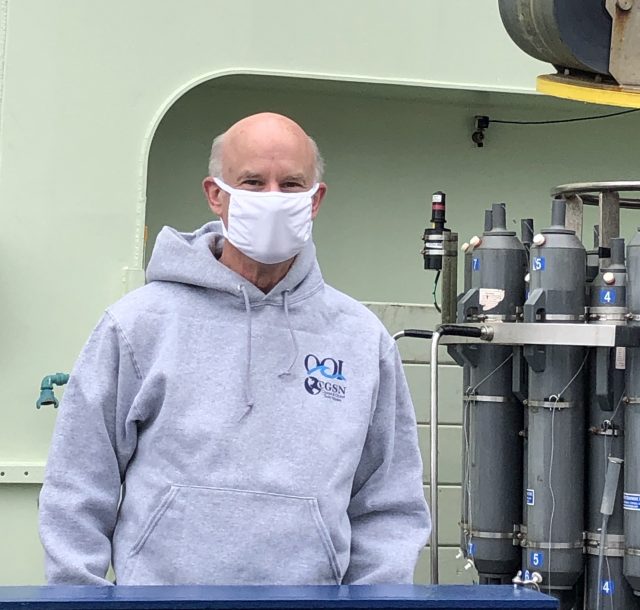
Chief Scientist of the Pioneer 14 Expedition, Al Pluedemann, models the uniform de rigueur —mandatory mask-wearing for the duration of the 10-day cruise. It was one of many stringent precautions taken to address the coronavirus pandemic. Photo: © Woods Hole Oceanographic Institution, Darlene Trew Crist
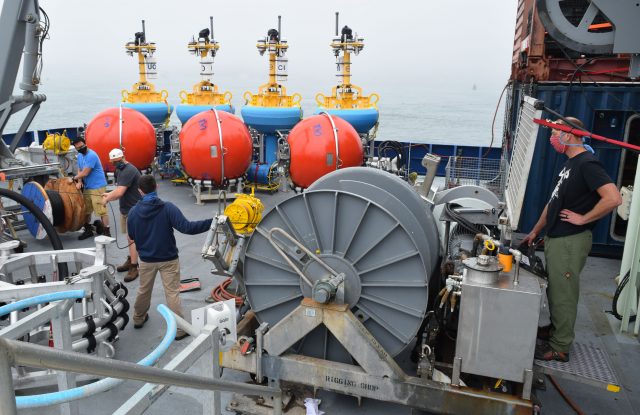
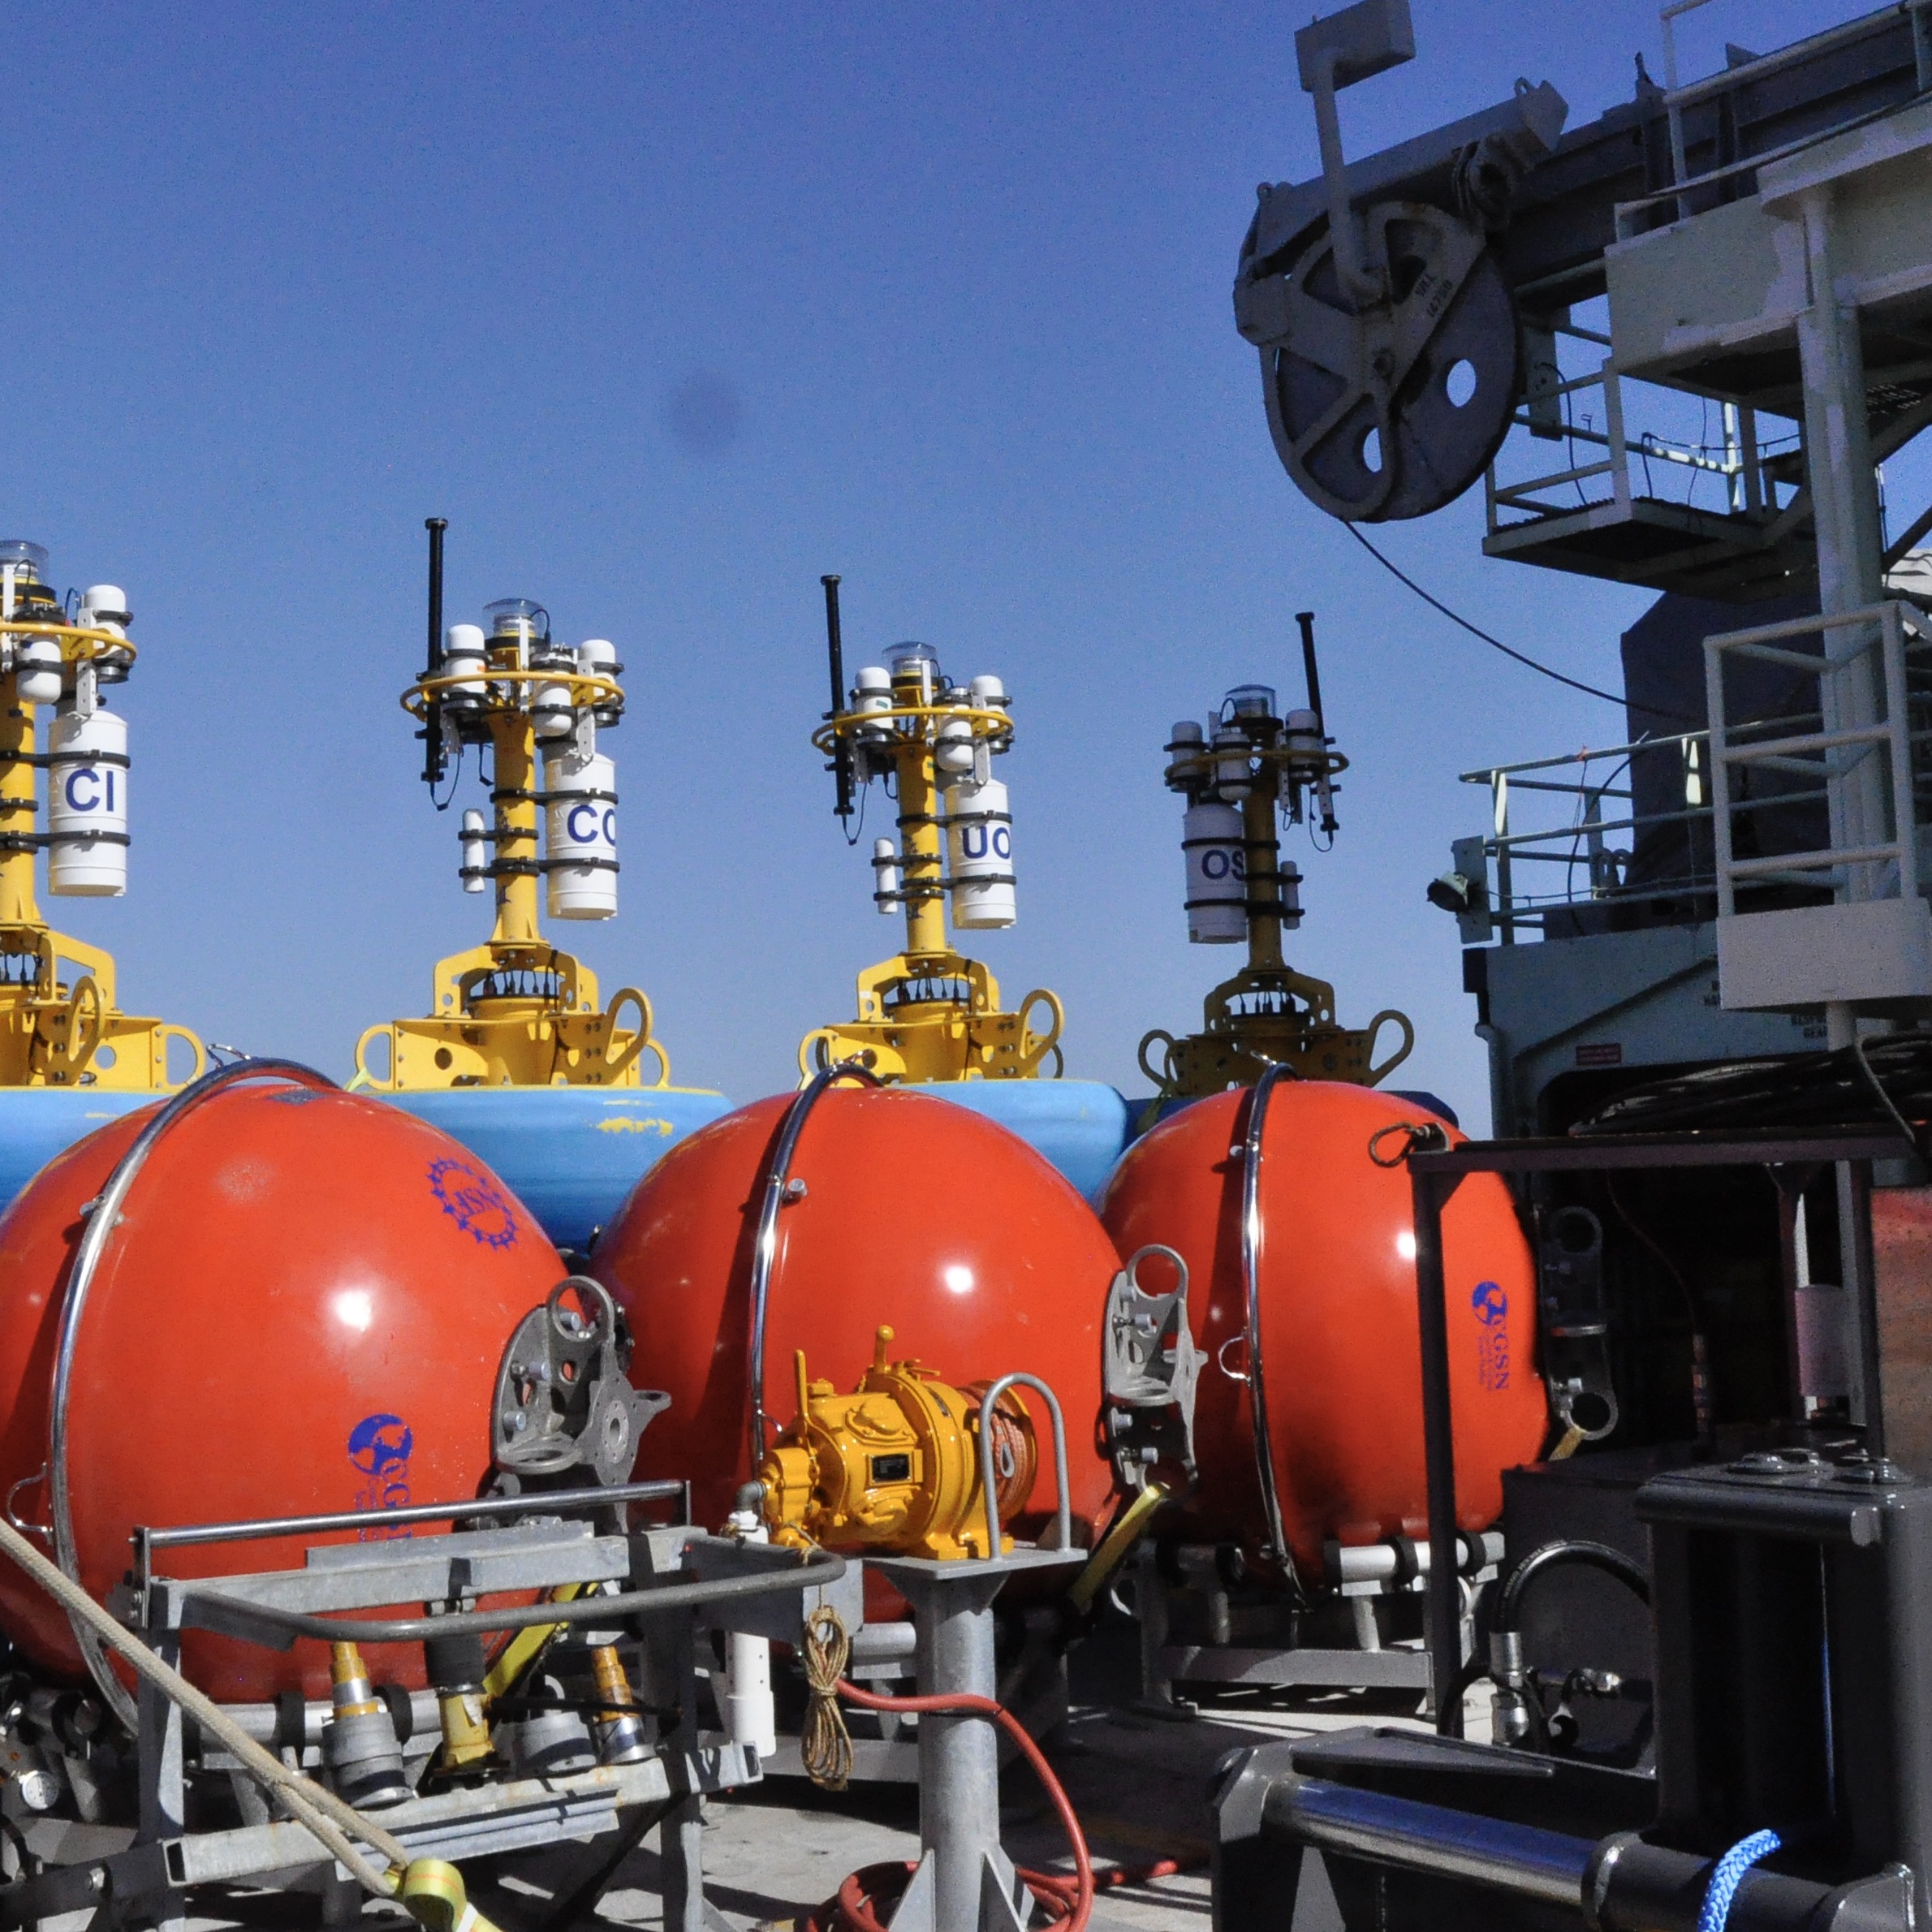
WHOI technicians (from left) Dan Bogorff, Nico Llanos, Chris Basque and Eric Hutt work to ensure that all equipment is in place as they prepare to head to the Pioneer Array. Photo: © Woods Hole Oceanographic Institution, Rebecca Travis
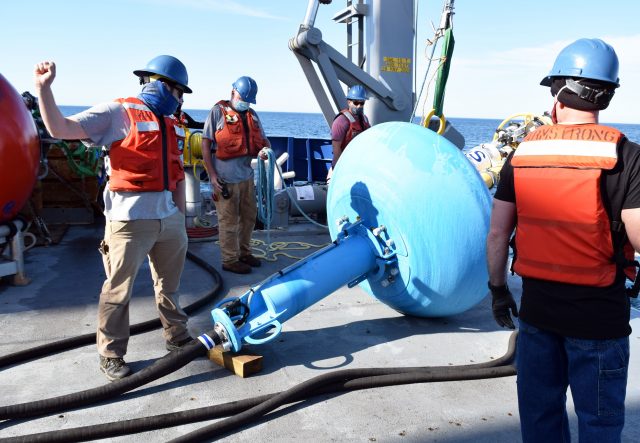
WHOI technician Chris Basque (far left) runs the deck while Bos’n Pete Liarikos and WHOI technician Nico Llanos (behind the buoy) assist in deploying the OSPM profiling mooring at Pioneer Array. Photo: © Woods Hole Oceanographic Institution, Rebecca Travis
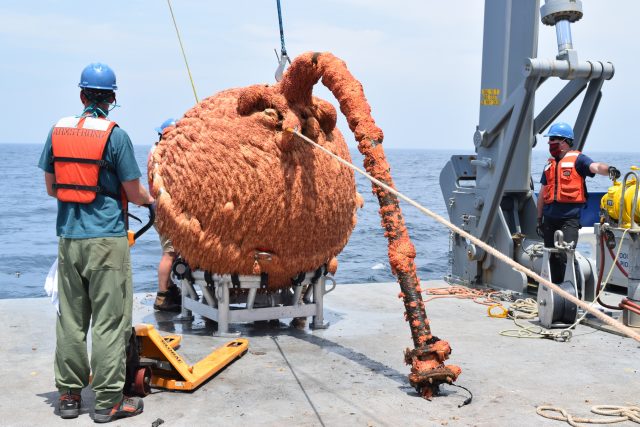
While this may look like Snuffleupagus on the back deck of the R/V Neil Armstrong, it is actually a profiler buoyancy sphere recovered on the Pioneer 14 cruise. The sphere is covered with marine growth after spending eight months in the water. Photo: © Woods Hole Oceanographic Institution, Rebecca Travis
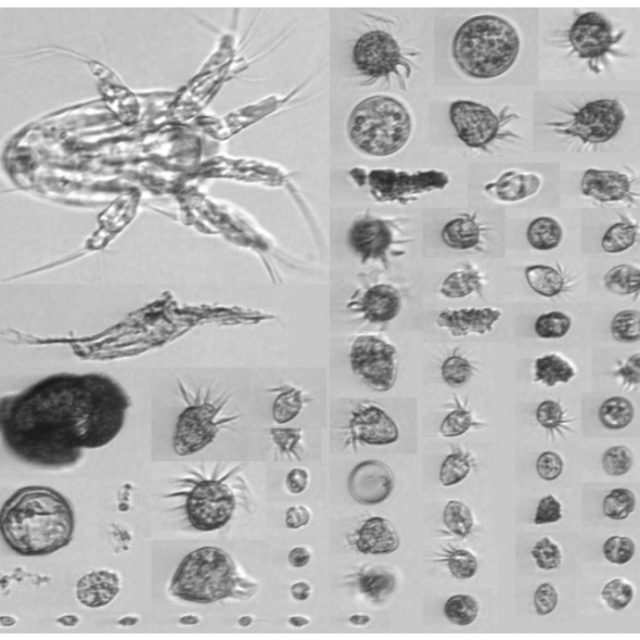
The Northeast U.S. Shelf Long-Term Ecological Research (NES-LTER) team, whose members would have been onboard under normal circumstances, remained onshore due to COVID-19 restrictions. But through an innovative use of data telemetry, Wood Hole Oceanographic Institution’s Shipboard Scientific Services Group made it possible for the NES-LTER team to receive data and images of phytoplankton and microzooplankton in near-real-time along the cruise track. Photo: NES-LTER
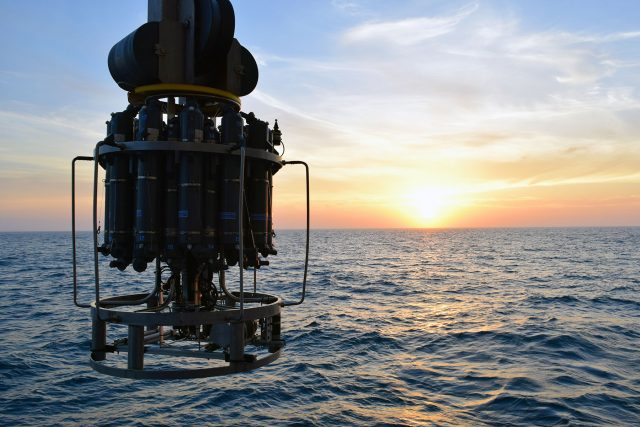
One of the rewards of working at sea is the peacefulness and beauty at the end of a long day aboard the R/V Neil Armstrong. Here the Pioneer 14 team got its just rewards as they lowered a CTD rosette frame into the Atlantic at sunset. Photo: © Woods Hole Oceanographic Institution, Rebecca Travis
Read MoreReady-to-use Educational Datasets Available
A new website of curated OOI datasets, called Data Nuggets, has launched. It contains valuable resources ready for integration into educational activities. The nuggets explore various concepts common in upper-level high school and introductory college courses and are designed and packaged to be readily accessible to educators to integrate into their existing curricula. Datasets were selected based on their quality and alignment with a broader OOI Science Theme.
 The nuggets were created as part of the National Science Foundation-funded OOI Synthesis & Education project, Ocean Data Lab, conducted by Rutgers University and led by the Consortium for Ocean Leadership.
For now, four data nuggets are available:
- 2015 Axial Seamount Eruption
- Seasonal Phytoplankton Blooms at High Latitudes
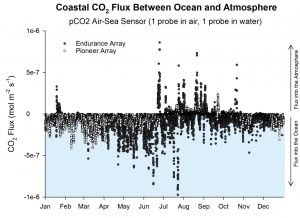
- Flux of CO2 Between Ocean and Atmosphere
- Seasonal Mixing of the Irminger Sea Water Column
The material provided in each nugget ranges from a description of scientific relevance to high resolution graphs to how use Python to pull and use OOI data in the classroom. The nuggets are designed to support educators as they design their own activities using OOI data.
More nuggets will be continually added so check the website often.
Read More
COVID-prevention, Quarantine, and Collaboration: Endurance Array 13 is Ready to Go
After two weeks of quarantine at home where possible, Airbnbs, and deserted family vacation homes, the 12-member Endurance Array team will head to Newport, Oregon on July 1 to board the R/V Thomas G. Thompson. As part of COVID-19 precautions, all of the needed equipment to service the Endurance Array will have been transported to the pier by non-seagoing staff prior to their arrival. The seagoing staff will simply arrive at the dock, load the ship, and then go to sea.
Under normal circumstances, the array is serviced – that is moorings are recovered and new ones deployed to ensure that the collection and transmission of ocean data continues seamlessly – twice a year. The regularly scheduled expedition this spring was canceled due to the coronavirus epidemic, so the cruise this summer will combine the work of the spring and fall expeditions.
“We are pleased to be able to get to the arrays this summer and to work aboard the R/V Thomas G. Thompson. This ship is large enough to give us all enough space to adequately social distance while onboard,” said Ed Dever, project scientist and principal investigator for the Endurance Array project. The ship will sail from its homeport in Seattle to meet the Endurance Array team in Newport, Oregon.
“With COVID-19 keeping some researchers on land, people are more interested than ever in the data that we collect remotely using the OOI. It’s important to have this opportunity to recover and replace the equipment at our Oregon and Washington lines,” Dever added.
The expedition will involve replacing seven moorings at six locations and the deployment of four gliders and four coastal surface piercing profilers. The team also will be measuring salinity, temperature, density, oxygen, and chlorophyll as a function of depth, during CTD casts before and after mooring recoveries. These onsite real-time data are publicly shared, as are all data continuously collected by the arrays throughout the year.
This expedition will involve three legs, traveling back and forth between different locations in the array and Newport to unload and pick up the huge coastal moorings. (Estimated weight of ~ 11 tons/per mooring). In total, the team will travel an estimated 1000 nautical miles during the expedition.
Dever’s OOI colleague Jon Fram at Oregon State University will be the chief scientist on this expedition. He remarked, “COVID-prevention has significantly changed operations onshore as well as while we are aboard the Thompson. Even for the seemingly simple task of ensuring that everyone had adequate masks for the duration, we tried out six different mask styles to find one that would be comfortable enough for everyone to wear for the duration of the journey. We also had to figure out how to achieve appropriate social distancing while onboard, which will change our normal operations.”
The Endurance Array team usually invites graduate students along on these expeditions to provide extra sets of hands, while offering mentoring opportunities and shipboard experiences for future potential marine scientists. During this summer expedition, only one graduate student will be onboard, who has previous experience on similar cruises.
Collaborative non-OOI scientific experiments, however, will take place. The Endurance Array team will gather the data rather than the non-OOI scientists involved, who would normally be onboard. Three different non-OOI experiments will occur. The first involves Linsey Haram of the Smithsonian, who collects fouling communities that grow on panels attached to OOI buoys. Ashley Burkett of Oklahoma State University is involved in the next, which entails collecting settling organisms on devices attached to the Seafloor Multi-Function Nodes (MFN) at the base of some surface moorings and act both as an anchor as well as a platform to affix instruments. The third, proposed by Taylor Chapple of Oregon State University, involves testing deployment of tagged fish acoustic monitors on the Near-Surface Instrument Frame (NSIF), a cage containing subsurface oceanographic instruments attached to multiple data concentrator logger computers.
Added Dever, “These three experiments are great examples of how scientists can become involved in the OOI and access the data they need. They demonstrate how scientists can have access to ocean data without ever having set foot aboard a ship.”
After the Endurance Team’s expedition, the Regional Cabled Array team will board the R/V Thomas G. Thompson on 30 July to begin a month-long expedition to service the RCA array, which provides power and equipment to a multitude of data gathering ocean equipment on the ocean floor.
Read MoreShipboard Data Transmission to Onshore Partners in Real-time
A team from Woods Hole Oceanographic Institution (WHOI) was onboard the R/V Neil Armstrong at the Pioneer Array, about 75 nautical miles south of Martha’s Vineyard in the Atlantic, deploying equipment and collecting data. Due to COVID-19 restrictions, the number of the science party onboard was limited. These limits prevented participation by the Northeast U.S. Shelf Long-Term Ecological Research (NES-LTER) team, whose members would have been onboard under normal circumstances.
But through an innovative use of onboard technology, WHOI’s Shipboard Scientific Services Group made it possible for the NES-LTER team to receive data and images of phytoplankton and microzooplankton in near-real-time along the cruise track. The data were collected by Imaging FlowCytobots (IFCBs), which provide long term, high-resolution measurements of phytoplankton abundance and their cell properties. The data can be viewed here.
Said WHOI researcher Taylor Crockford from her research laboratory on land, who beta-tested the data transmission with the WHOI onboard team, “In this challenging time of the Coronavirus, we are thankful for this opportunity to continue long-term research into the productivity and food web on the Northeast U.S. Shelf while the cruise was underway.”
The Ocean Observatories Initiative is funded by the National Science Foundation.
Read MoreCoastal and Global profiler mooring analysis MATLAB-based tools
https://bitbucket.org/ooicgsn/mmp_toolbox/src/master/, 8 May 2020
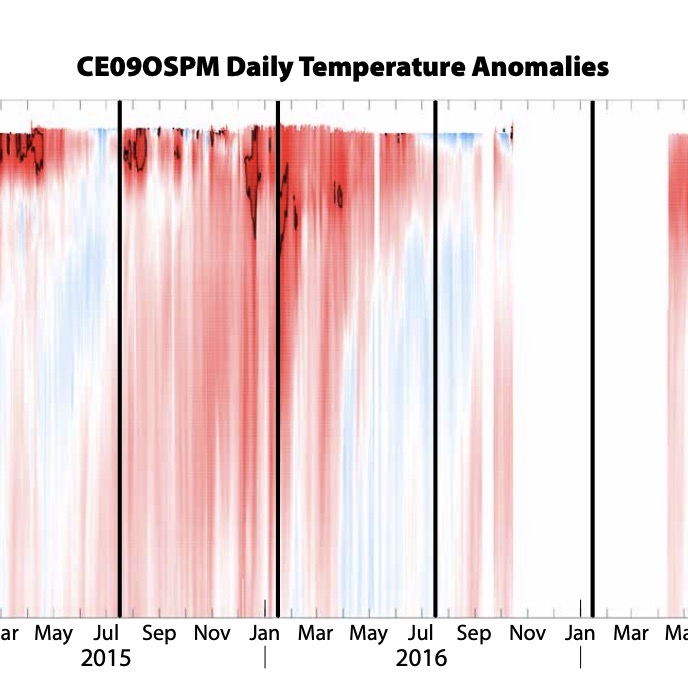
The McLane Moored Profiler is used on the Global profiler moorings, Pioneer and Endurance coastal profiler moorings, and, as a modified McLane Profiler, on the Regional Cabled Cable Array deep profiler moorings. Its water column measurements contribute to the OOI science goals of Climate Variability, Ocean Circulation, and Ecosystems; Turbulent Mixing and Biophysical Interactions; and Coastal Ocean Dynamics and Ecosystems. For example, Barth et al., 2018 used the Endurance Washington offshore profiler moorings to characterize the subsurface temperature response to the recent warm blob event (Figure to right).
While profiler mooring data are available via the OOI Data Portal, the Data Portal does not provide a tool to easily analyze and visualize profiler data. In response to this need and to user requests for profiler analysis tools, Endurance Array staff have developed a MATLAB-based toolbox called radMMP. This toolbox allows users to easily import and visualize a WFP data set. It has been thoroughly tested with Endurance and Pioneer profiler mooring data and has been uploaded to the publicly available CGSN Bitbucket website (https://bitbucket.org/ooicgsn/mmp_toolbox/src/master/) along with comprehensive tutorial information. Using this toolbox, the Endurance Array data team has completed annotations for all Endurance Array profiler mooring since the initial deployment. While the toolbox was initially developed for the coastal profiler mooring, it is being extended to the global profiler mooring and should be adaptable to the Regional Cabled Array deep profiler moorings.
Read MoreOOI Launches “Download” to Keep Community Informed
[/media]
The first issue of Download, the OOI’s new newsletter, was released on 1 May. It provides a short, concise look at the OOI, with clickable links for digging deeper into specific topics. It covers the latest OOI developments, scientific advances being made using OOI data, and opportunities for you to participate in the OOI, through help with proposals, data use, workshops, and other events.
The newsletter is available online here. If you’d like to subscribe, please send an email to dtrewcrist@whoi.edu, with a subject line: Download subscribe.
Read More
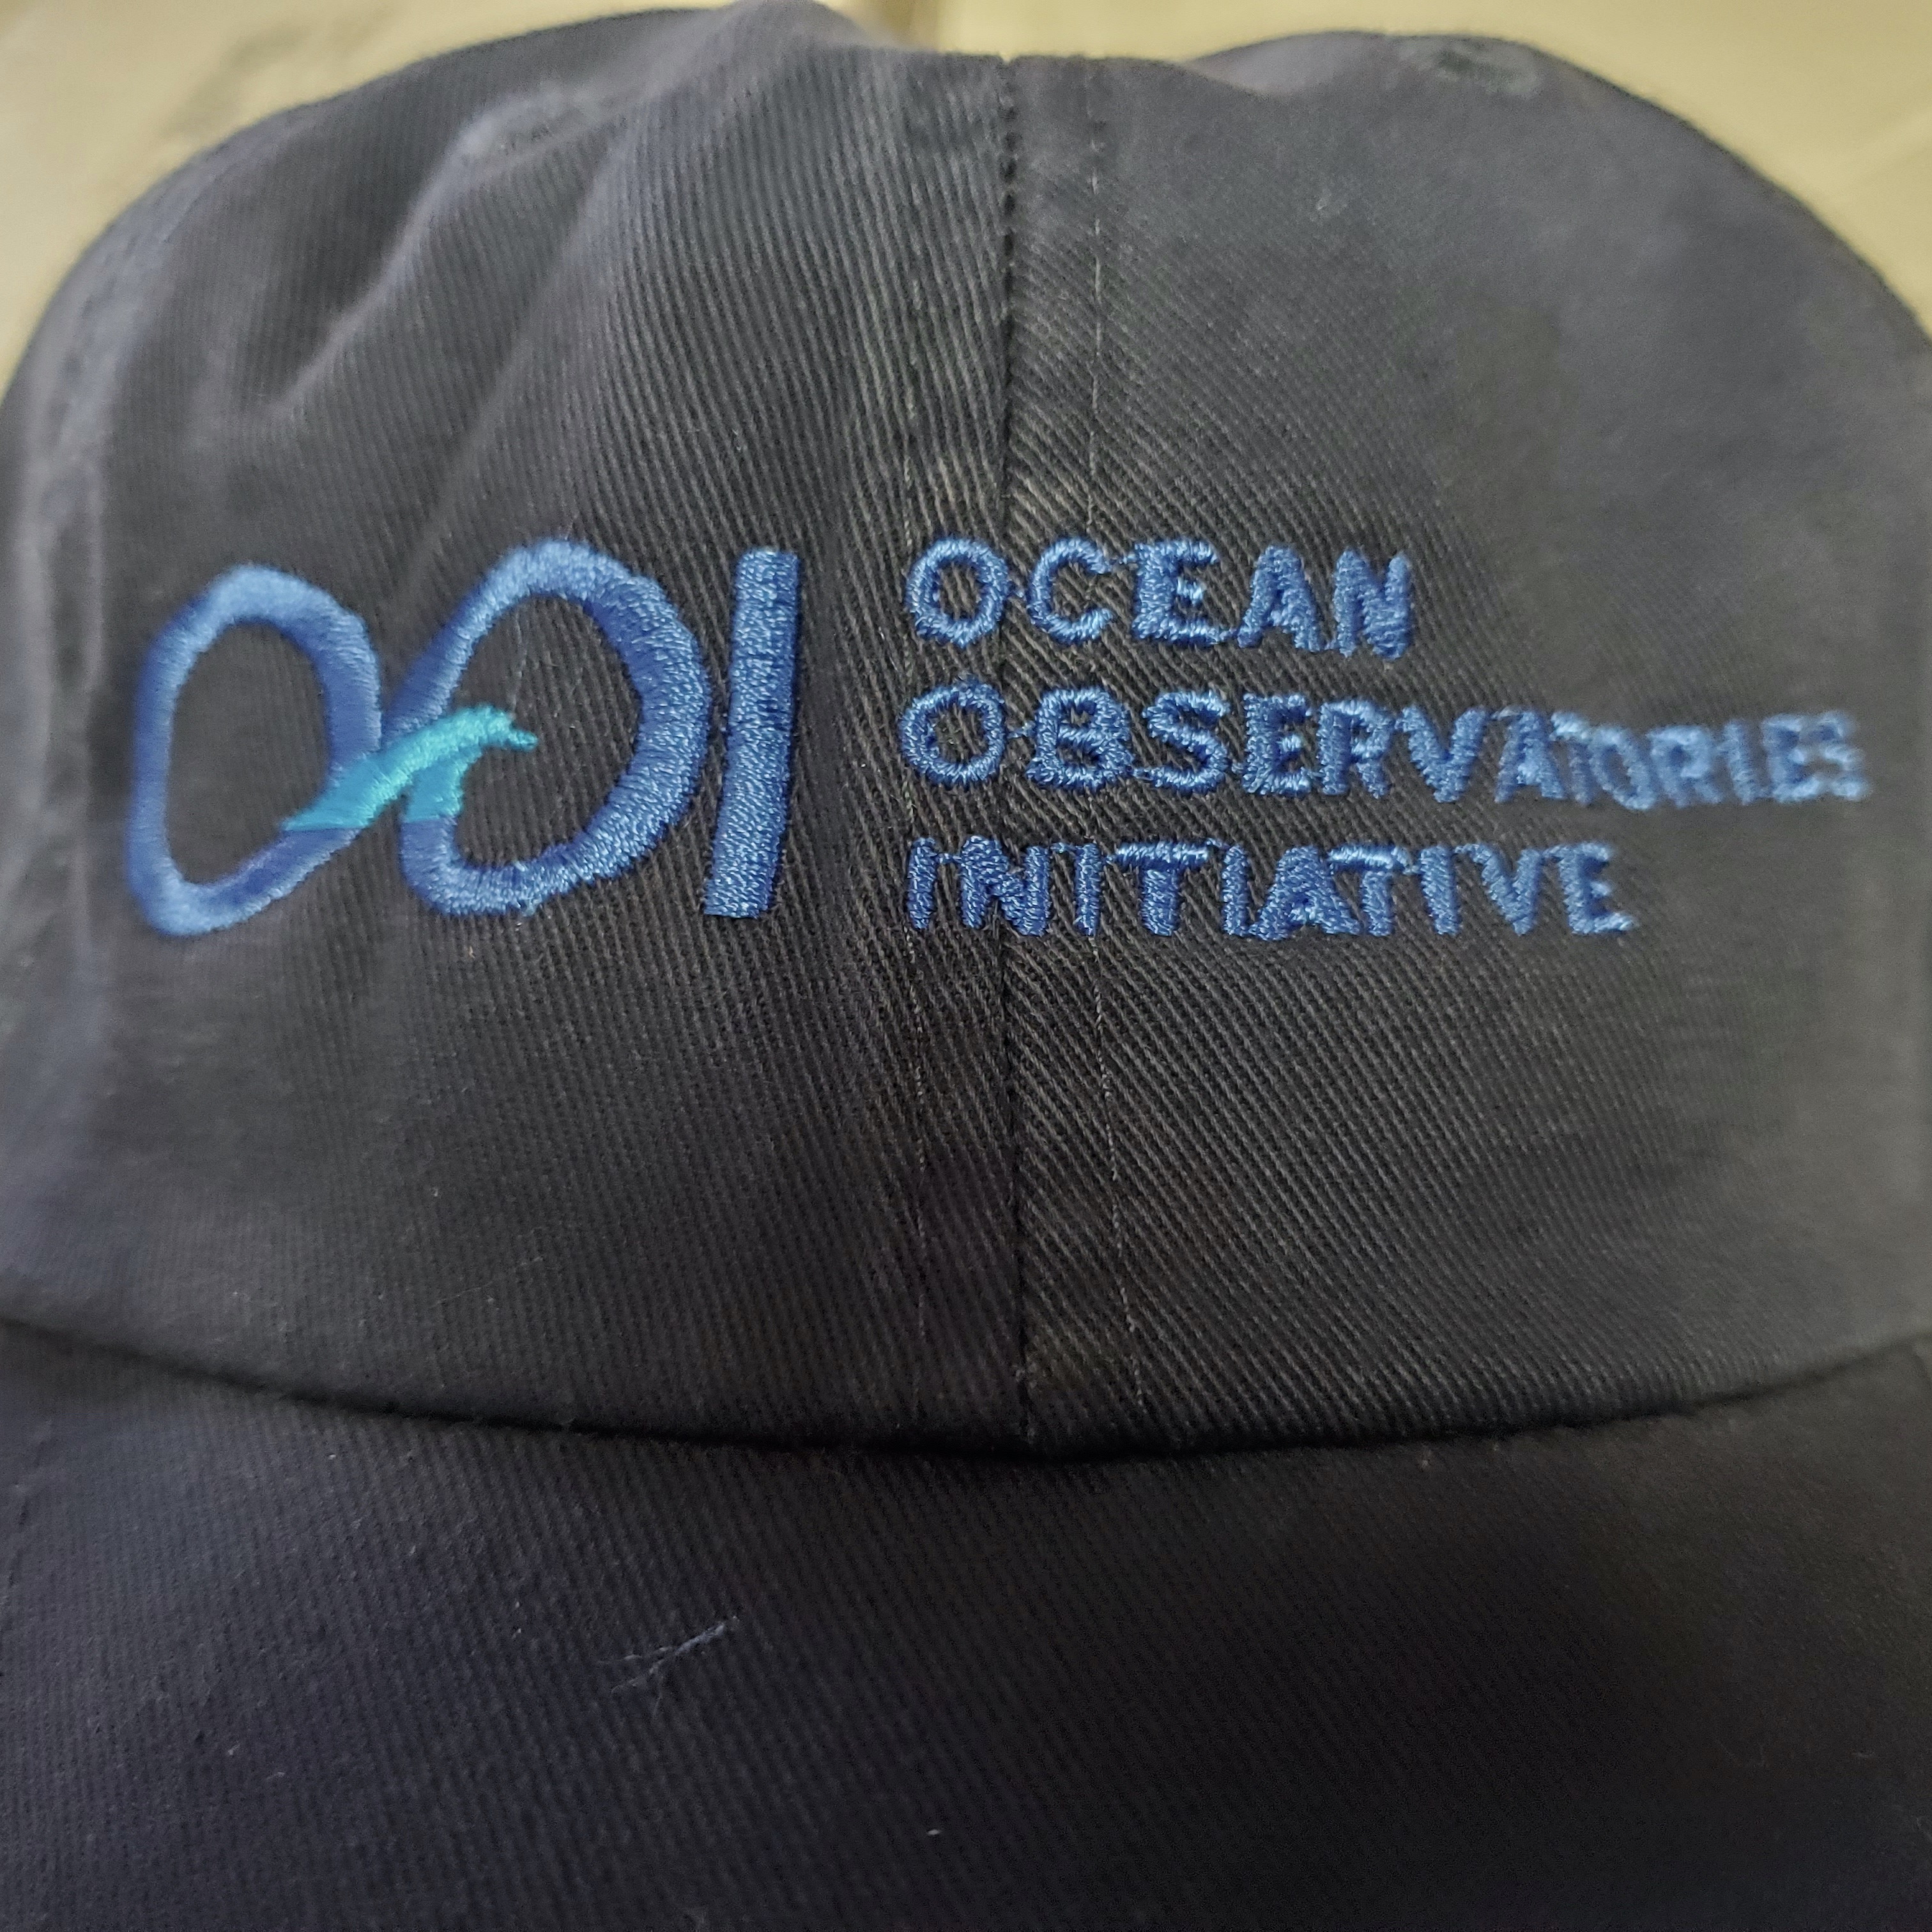
A Hat for a New Name
In July, OOI will launch the Beta version of our new and improved data discovery tool. We are asking for the community’s help in naming the tool, which will make it possible to:
- search and download data from cabled and moored arrays and recovered data from for in situ physical, chemical, geological, and biological observations
- compare datasets across regions and disciplines
- generate and share custom data views
- download full data sets using ERDDAP
Want to take a crack at coming up with a name? The selected winner will receive an OOI hat in recognition of his/her creativity. If there is more than one winner, each will receive an OOI hat.
The deadline for submission is 15 May 2020. Please submit your nominations to dtrewcrist@whoi.edu, with subject line: “I deserve a hat!
Read MoreFrom Whale Songs to Volcanic Eruptions: OOI’s Cable Hears the Sounds of the Ocean
Sound is omnipresent in the ocean. Human-induced noise has the potential to affect marine life.
After the global recession in 2008, the ocean became quieter as shipping declined. Off the coast of Southern California, for example, scientists at Scripps Institution of Oceanography found that noise amplitudes measured from 2007-2010 were lowered by 70 percent with a reduction in one ship contributing about 10 percent.
A similar quieting of the ocean can be expected as global ship traffic continues its decline in response to the corona virus pandemic. This quieter ocean offers scientists ways to expand their ongoing research on ocean sound and its impact on marine life.
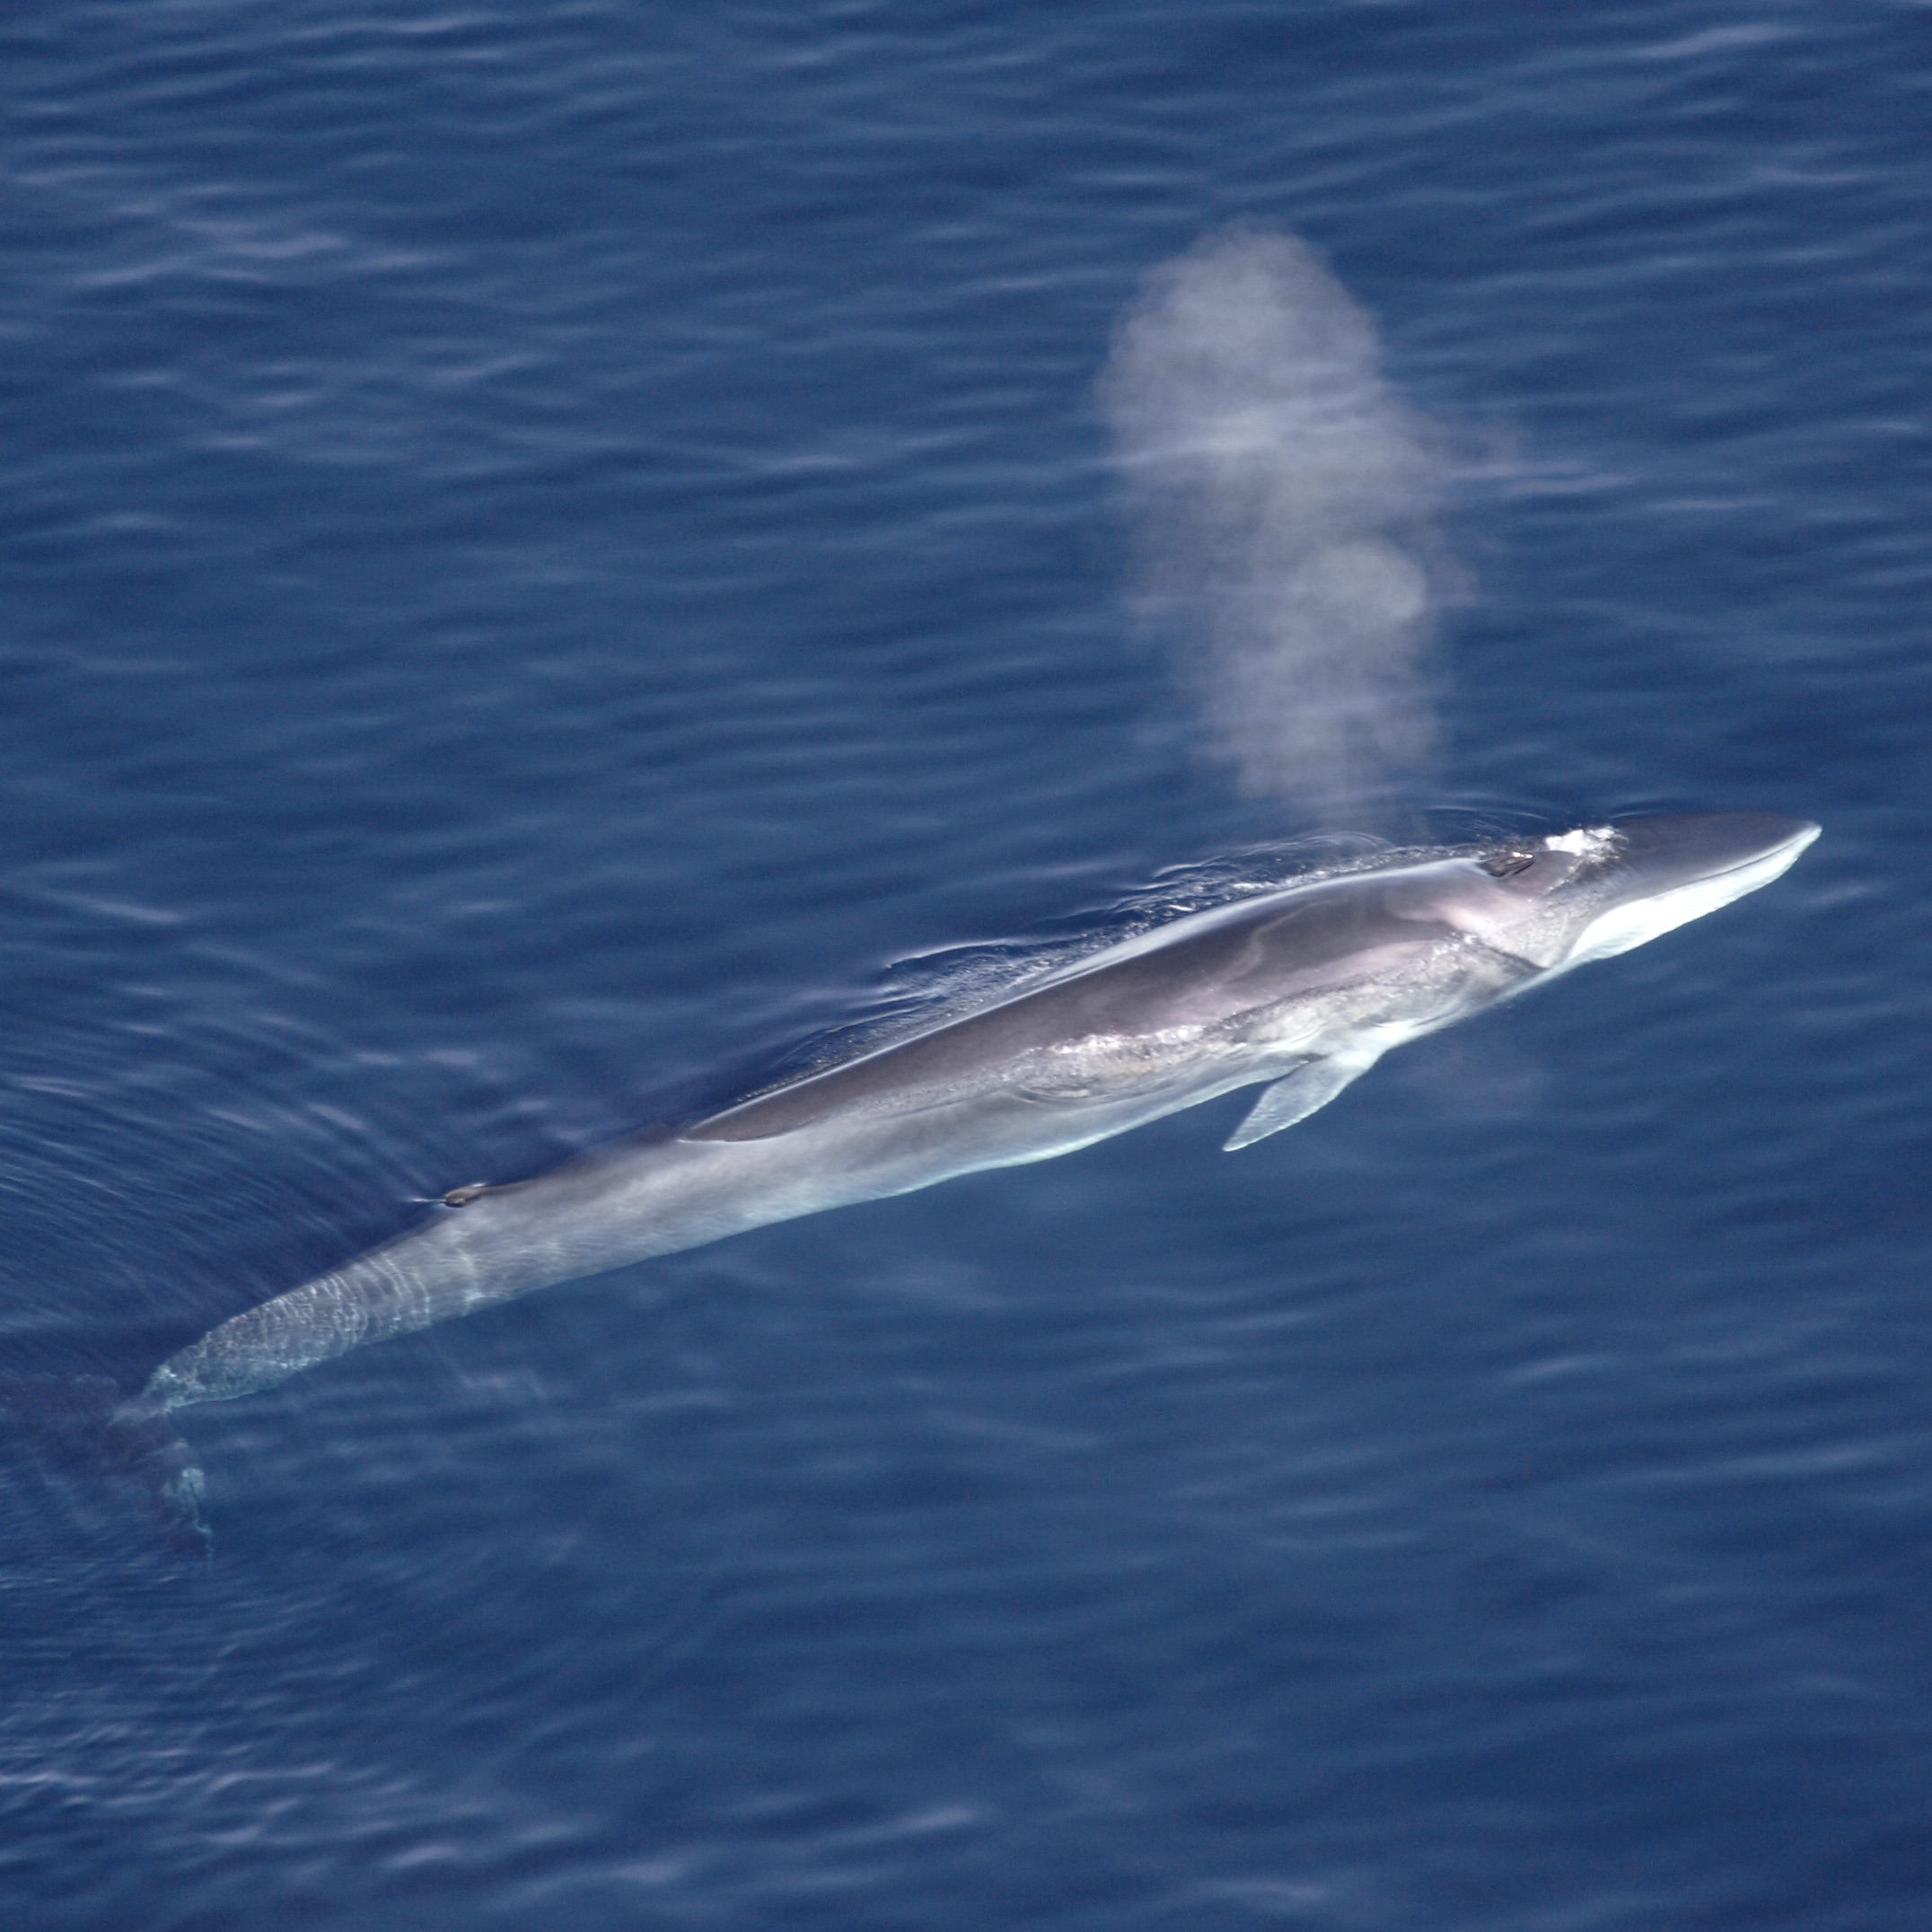
[media type="image" path="https://oceanobservatories.org/wp-content/uploads/2020/04/Finhval_1.jpg" link="#" alt="Fin Whale"][/media]“It takes time to document real change in the ocean, but University of Washington oceanographers have reported that over the past decade, fin whales have been communicating more softly in the Pacific,“ said Deborah Kelley, professor of oceanography at the University of Washington and director of the OOI’s Regional Cabled Array (RCA) component. “A quieter ocean allows us to hear more clearly life and other natural processes within the ocean.”
Years of listening to whales
John Ryan, a biological oceanographer at the Monterey Bay Aquarium Research Institute (MBARI), has been “listening in” on whales and other marine creatures since 2015 using a hydrophone on the Monterey Accelerated Research System (MARS), a cabled observatory, which was in part established as a test bed for the OOI Regional Cabled Array. Ryan and colleagues studied the occurrence of humpback whale (Megaptera novaeangliae) song in the northeast Pacific using three years of continuous recordings off the coast of central California.
[media type="image" path="https://oceanobservatories.org/wp-content/uploads/2020/04/Humpback_Whale_underwater_shot.jpg" link="#" alt="Humpback Whale"][/media]“We’ve been listening almost continuously since July 28, 2015, using a broadband, digital, omnidirectional hydrophone connected to MARS. Listening continuously for that long at such a high sample rate is not easy; only by being connected to the cable is this possible,” explained Ryan.
The researchers were able to discern whale songs from the busy ocean soundscape in Monterey Bay National Marine Sanctuary, which is a feeding and migratory habitat for humpback whales. The humpbacks’ song was detectable for nine months of the year (September–May) and peaked during the winter months of November through January. The study revealed strong relationships between year-to-year changes in the levels of song occurrence and ecosystem conditions that influence foraging ecology. The lowest song occurrence coincided with anomalous warm ocean temperatures, low abundances of krill – a primary food resource for humpback whales, and an extremely toxic harmful algal bloom that affected whales and other marine mammals in the region. Song occurrence increased with increasingly favorable foraging conditions in subsequent years.
Because the hydrophone is on the cabled observatory, its operation can be adjusted to achieve new goals. For example, the sampling rate of the hydrophone was doubled during an experiment that successfully detected very high frequency echolocation clicks of dwarf sperm whales (with Karlina Merkens, National Oceanic and Atmospheric Administration). “And that’s a beautiful aspect of being on the cable,” added Ryan. “Not only do we know that it is working, we catch any network glitches pretty quickly so we don’t lose data, and we can do real-time experiments like these.”
William Wilcock of the University of Washington and his students have compiled a decade worth of data on fin whales in the northern Pacific. Fin whales call at about 20 HZ, which is too low of a frequency for humans to hear, but perfect for seismometers to record. The researchers aggregated ten years of data from both temporary recorders and now permanent RCA hydrophones and seismic sensors and looked at the frequency of the calls and calling intervals. The researchers found both have changed over time.
The fin whales call seasonally and the frequency of the calls has gone down with time.
[audio mp3="https://oceanobservatories.org/wp-content/uploads/2020/04/Fin_whale_10x.mp3"][/audio]Calls peak in late fall, early winter in relation to mating season. Gradually through the season the frequency decreases. At the start of the next season, the call frequency jumps up again, but not quite to where it was the year before. Over ten years, the frequency has gone down about 2 HZ, and scientists are puzzled as to why this is occurring. It is unlikely to be due to increasing ship noise, because this lower sound frequency is getting closer to the range of the noise level of container ship propellers, about 6-10 HZ.
In some settings, ship noise is known to affect whale behavior and the permanent network of hydrophones operated by the OOI and Ocean Networks Canada will provide an opportunity to study whether whales are avoiding the shipping lanes to Asia.
Volcanoes also rumble in the deep
Whale sounds are but one of many acoustic signals being recorded and monitored using hydrophones and broadband seismometers. The OOI’s RCA off the Oregon Coast includes 900 kilometers (~560 miles) of submarine fiber-optic cables that provide unprecedented power, bandwidth, and communication to seafloor instrumentation and profiler moorings that span water depths of 2900 m to 5 m beneath the ocean surface. Using a suite of instruments connected to the cable, which continuously stream data in real time, scientists are listening in on the sounds of submarine volcanism, which accounts for more than 80 percent of all volcanism on Earth.
More than 300 miles off the Oregon coast in 1500 meters of water, 20+ cabled seafloor instruments are located at the summit of Axial Seamount, the most active volcano on the Juan de Fuca Ridge, including hydrophones and seismometers, which can also record sounds in the ocean.
“Scientists were able to hear(as acoustic noises traveling through the crust) >8000 earthquakes that marked the start of the Axial eruption in 2015. Coincident with this seismic crisis bottom pressure tilt instruments showed that the seafloor fell about 2.4 meters (~8 feet).
[video width="670" height="384" m4v="https://oceanobservatories.org/wp-content/uploads/2020/04/Axial-seamount-audio-.m4v"][/video]It was a remarkable collaborative event with scientists from across the country witnessing the eruption unfold live,” added Kelley. Such real-time documenting of an eruption in process was possible because of how Axial is wired. It is the only place in the oceans where numerous processes taking place prior to, during, and following a submarine eruption are captured live through data streaming 24/7. William Wilcock, University of Washington, and Scott Nooner, University of North Carolina, Wilmington, and colleagues reported these findings in Science, 2016.
Data collected from the hydrophones at the seamount’s base supported another discovery about Axial, indicating that it explosively erupted in 2015. Hydrophones recorded long-duration diffusive signals traveling through the ocean water consistent with explosion of gas-rich lavas, similar to Hawaiian style fissure eruptions. Follow-on cruises documented ash on some RCA instruments, again indicating the likelihood of explosive events during the 2015 eruption.
“Having the opportunity to listen in while a submarine volcano is active offers a really interesting window into things,” said Jackie Caplan-Auerbach, associate dean at Western Washington University and lead author of a G-cubed article that reported the possible eruptive findings. “While we cannot say with utter certainty that there were explosions at Axial, there’s a lot of evidence that supports this. We know from having listened to other eruptions that this was the same type of sound. It’s distinct, like the hissing sound of a garden hose on at top speed. We also found these really fine particulates, which could only have resulted from an eruption, had collected on one of the instruments at the site.”
[audio wav="https://oceanobservatories.org/wp-content/uploads/2020/04/axial_explosive.wav"][/audio]Added Caplan-Auerbach, “My favorite part of having OOI is it offers an ability for pure discovery. Its real time nature makes it possible to observe and see what happens. And sometimes the planet just hands you a gift that you didn’t expect. Not always being hypothesis driven is a very valuable aspect of science that I hope does not get lost. I’m very appreciative of projects like this that open our eyes into signals that we didn’t know were there.”
More opportunities to expand knowledge about sound and the sea are on the horizon. The US. Navy has funded Shima Abadi, University of Washington, Bothell, for a comprehensive study of sounds recorded by the OOI hydrophones. Stay tuned!
Image credits: Top fin whale: Wikipedia, Aqqa Rosing-Asvid – Visit Greenland. Second from top: humpback whale: Public domain, National Oceanic and Atmospheric Administration.
Read More
Talented Seafloor Workhorse
Enjoy some amazing underwater footage of the work that takes place off the Oregon coast to bring scientists and educators a constant stream of data from the seafloor through the water column across the Juan de Fuca plate.
https://vimeo.com/412358105
[embed]http://iframe%20src=https://player.vimeo.com/video/412358105%20width=640%20height=360%20frameborder=0%20allow=autoplay;%20fullscreen%20allowfullscreen/iframe[/embed]https://vimeo.com/user110037220/download/412358105/01ffce7409
Read MoreUNOLS Extends Guidance to Suspend Cruises through 1 July 2020
The University-National Oceanographic Laboratory System (UNOLS), which coordinates oceanographic ships’ schedules, recommended on 17 March 2020 that cruise activities be paused for 30 days due to the COVID-19 pandemic. On 30 March UNOLS extended its guidance to suspend research cruises to July 1 2020. This action is designed to protect the health and safety of the crews and scientific parties.
The planned spring operation and maintenance (O&M) cruise to the Endurance Array in March was affected by the original 30-day guidance. The upcoming O&M cruises for the Pioneer, Irminger, and Papa Arrays aboard R/V Neil Armstrong and R/V Sikuliaq are impacted by this latest guidance.
The OOI is working with UNOLS and ship operators to find potential opportunities to complete the scheduled cruises and conduct needed maintenance on the arrays. In the meantime, there’s been no interruption in OOI data. OOI data continue to be collected and made available for use by the scientific and educational communities.
Read More