
News
Amber Stronk Appointed New OOI Community Engagement Manager

Principal Investigator of the U.S. National Science Foundation Ocean Observatories Initiative (OOI) Program Office James B. Edson today announced that Amber Stronk is the new OOI Community Engagement Manager. Stronk assumed her responsibilities on June 24, taking over for Darlene Trew Crist, who has served in this role since January 2020. Trew Crist announced her retirement in January 2024, which led to an exhaustive search to find a qualified replacement.
“Darlene’s done an exceptional job for OOI and leaves very big shoes to fill, but we are delighted to have Amber assume the reins of this well-run effort. Amber brings a wealth of experience running communication and engagement operations for environmentally focused organizations and has a deep understanding of both the scientific and communication strategies essential to OOI. We are enthusiastic about the new energy and insights she will bring to the position,” said Edson.
Stronk most recently served as the Communications & Engagement Manager for the Marketing Science Institute. Previously, she was the Communications Manager for Sailors for the Sea Powered by Oceana, the world’s leading advocacy organization dedicated to ocean conservation. Her extensive background also includes communications roles at PricewaterhouseCoopers and the Broad Institute of MIT & Harvard. Stronk holds a master’s degree in marine biodiversity and conservation from the Scripps Institution of Oceanography and a BA in communications from Marist College.
To ensure a smooth transition, Stronk and Trew Crist will overlap in the position for two weeks, until July 5 when Trew Crist formally leaves Woods Hole Oceanographic Institution, where OOI’s program office is based.
The Ocean Observatories Initiative is a long-term infrastructure project funded by the U.S. National Science Foundation to gather physical, chemical, and biological data from the ocean, atmosphere, and seafloor and to deliver that data on demand and in near real-time online. The program includes moored instrument arrays and autonomous underwater vehicles deployed at critical locations in the coastal and open ocean worldwide. Data from the observatories help researchers address questions across short and long time periods, small and large spatial scales, and from the ocean surface to the seafloor. OOI is managed by the Woods Hole Oceanographic Institution (WHOI) and implemented by WHOI, the University of Washington and Oregon State University.
Read More
Rosetta Stone for OOI Sensor Names

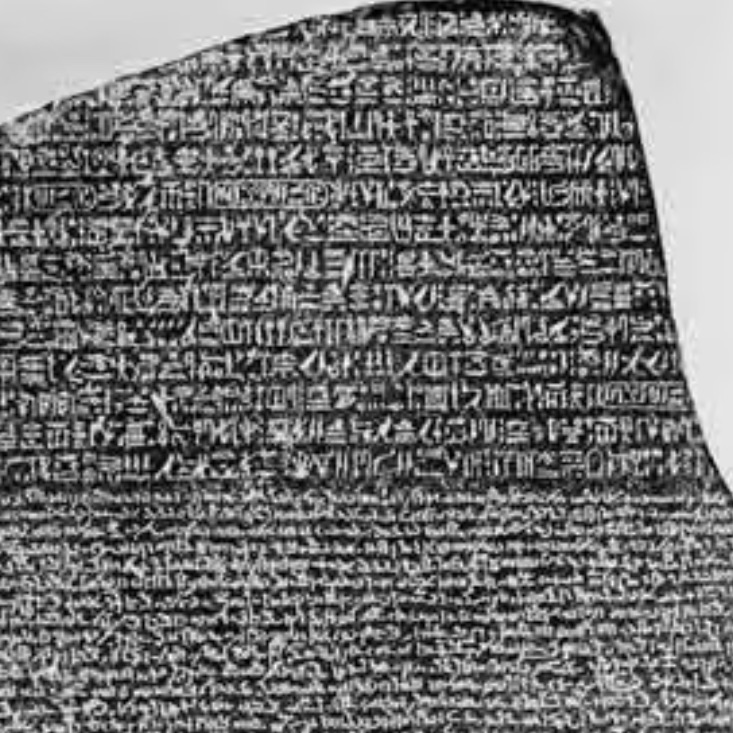 OOI’s instrument page is the Rosetta Stone for deployed instruments.[/caption]
Ever wonder what a SPKIR is? If the meaning isn’t top of mind, SPKIR is the Spectral Irradiance sensor (Sea Bird OCR-507 multispectral radiometer), which measures Spectral Irradiance. What about ADCP? This stands for Acoustic Doppler Current Profilers that use acoustics to measure 3D water-current velocity for a small volume of the water column above or below the sensor. The sensor calculates velocity by measuring changes in the sound waves.
All of this information and more is available on OOI’s website on the “Rosetta Stone for OOI Sensor Names” (instrument page) at https://oceanobservatories.org/instruments/. Bookmark this page where you can easily find the definition of these acronyms, as well as a visual of what the instrument looks like and information on how it works. In addition, you can be linked to data products specific instruments create, and much more.
Read MorePOGO Fellow Reports on Shipboard Training
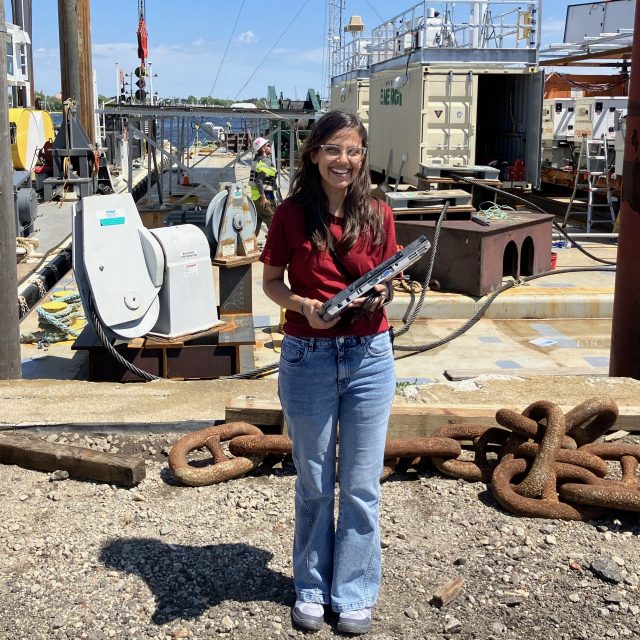
Aditi Sharma, a PhD candidate at the National Institute of Oceanography India, was selected from more than 80 applicants for a shipboard training fellowship sponsored by the Partnership for Observation of the Global Ocean (POGO), WHOI, OOI, and the Nippon Foundation. She was aboard the R/V Sikuliaq for a 17-day expedition to recovery and deploy OOI’s Global Station Papa in the Gulf of Alaska. Jim Edson, Principal Investigator for OOI’s Program Management Office, is also onboard as her advisor. In addition to fantail activities, Edson and she will be working on a project to compare near surface “sea-snake” temperature with an infrared radiometer measuring the sea-surface or skin temperature. This will provide hands-on experience at sea and enhance Aditi’s research experience as she works to complete her PhD when she returns to India. Over the course of the expedition, Aditi shared her experiences, which can be read at the link below.
JUNE 14, 2024 Lots to Report!
Sunrise Surprise
Sunrise has become a rare sight after spending ten days onboard in the Gulf of Alaska.
[media-caption path="https://oceanobservatories.org/wp-content/uploads/2024/06/1-scaled.jpg" link="#"]Sunrise view from the bedside window. Credit: Aditi Sharma, NIO.[/media-caption]Tangled Glass Balls
We began retrieving the mooring from the Global Papa 10 Array deployed last year. The most captivating aspect of the operation for me was dealing with the glass balls. These glass balls are often tangled, presenting a fascinating challenge to untangle them, which I found incredibly enjoyable and fun.
[media-caption path="https://oceanobservatories.org/wp-content/uploads/2024/06/2-1-scaled.jpg" link="#"]Retrieval of Acoustic Release accompanied by entangled glass balls. Credit: Aditi Sharma, NIO.[/media-caption] [media-caption path="https://oceanobservatories.org/wp-content/uploads/2024/06/3-1-scaled.jpg" link="#"]Entangled glass balls on deck, awaiting detangling.Credit: Aditi Sharma, NIO.[/media-caption] [media-caption path="https://oceanobservatories.org/wp-content/uploads/2024/06/4-1-scaled.jpg" link="#"]Jim Edson lending a hand in deciphering the tangled puzzle of glass balls.Credit: Aditi Sharma, NIO.[/media-caption]Teamwork on Deck
Following the retrieval of the Global Papa array moorings, the team commenced operations to recover the University of Washington wave rider mooring.
[media-caption path="https://oceanobservatories.org/wp-content/uploads/2024/06/5-1-scaled.jpg" link="#"]Team members assisting in tagging the ropes during the retrieval of the waverider mooring. Credit: Aditi Sharma, NIO.[/media-caption] [media-caption path="https://oceanobservatories.org/wp-content/uploads/2024/06/6-scaled.jpg" link="#"]Recovery of the spheres from the waverider mooring.Credit: Aditi Sharma, NIO.[/media-caption] [media-caption path="https://oceanobservatories.org/wp-content/uploads/2024/06/7-scaled.jpg" link="#"]Mooring covered in biofouling by goose neck barnacles and “sea-slime”. Credit: Aditi Sharma, NIO.[/media-caption]Ocean Wizards or Inflatable Tube-man
The rope connected to the mooring was covered with organisms, creating a mesmerizing, almost wizard-like appearance. Dr. Jim Edson compared these organisms to inflatable tube-man at used-car lots, a comparison I found amusing and wholeheartedly agreed with.
[video width="1280" height="720" mp4="https://oceanobservatories.org/wp-content/uploads/2024/06/v1-1.mp4"][/video]The mooring rope bio-colonized by organisms.
Winch Adventure
Deck Operation Lead Jim Ryder offered me the opportunity to learn how to operate the winch, which I found exhilarating despite the cold weather. Fueled with happiness, my hands worked efficiently as I operated the winch barehanded. Despite his offers for a break, I was too excited to pause, deeply grateful to the team for their guidance and teachings during my learning experience.
[video width="720" height="1280" mp4="https://oceanobservatories.org/wp-content/uploads/2024/06/v2.mp4"][/video]Winch operation following instructions from Deck Operations Lead Jim Ryder.
CTD operations
In addition to deploying moorings and gliders, we performed CTD casts near the deployment locations to gather samples at specific depths using a 24-bottle rosette of Niskin samplers. The samples were collected for analysis of Dissolved Oxygen (DO), Dissolved Inorganic Carbon (DIC), nutrients and conductivity by salt analysis. Apart from sensors for conductivity, temperature, and depth, CTD was equipped with additional sensors for dissolved oxygen, chlorophyll fluorometer, transmissometer, and PAR.
DIC samples were treated with mercuric chloride for preservation prior to storage. Nutrient samples underwent filtration before being stored in the deep freezer, while Dissolved Oxygen samples were analyzed onboard.
[video width="720" height="1280" mp4="https://oceanobservatories.org/wp-content/uploads/2024/06/v3.mp4"][/video]Sample collection using 24-bottle rosette of Niskin samplers via the wet wall.
Spooky dangling figure
As I was doing my laundry after a day’s work, my attention was drawn to the mannequin dressed in safety gear. Ironically, for a moment I didn’t feel safe at all since it actually freaked me out. Well, for a little while.
[media-caption path="https://oceanobservatories.org/wp-content/uploads/2024/06/8-scaled.jpg" link="#"]Safety gear attired mannequin. Credit: Aditi Sharma, NIO.[/media-caption]Spectacular Sunset
[media-caption path="https://oceanobservatories.org/wp-content/uploads/2024/06/9-scaled.jpg" link="#"]The stunning sunset painted the sky, as a masterpiece on a canvas.Credit: Aditi Sharma, NIO.[/media-caption]JUNE 11, 2024 The Giant Hairy Bearded Man
Recovery operations were set to begin once the deployment operations were successfully completed and the decks cleared. A little time was also allotted between the deployment of new and recovery of the old to provide overlapping data to intercalibrate the moored instruments. The recovery operations brought back the old moorings that had been deployed a year ago. Covered with a dense growth of organisms and encrusted with biofouling, with many goose barnacles, the old moorings took on an almost anthropomorphic appearance, resembling a “Giant Hairy Bearded Man.”
Recovering the Synactic sphere while Jim Edson handles the tag lines helping to stabilize the sphere.
[video width="720" height="1280" mp4="https://oceanobservatories.org/wp-content/uploads/2024/06/v1.mp4"][/video] [gallery ids="34111,34112,34113,34110,34114,34115,34116,34117"]With the weather not on our side, we’ve adjusted our plans to make the most of the sunset’s glow. Working into the evening doesn’t feel exhausting with the late sunset, enabling us to make up for lost time during the storm. With the improvised plans, the team has successfully completed tasks up to date. As we move forward, our sights are set on recovering another mooring and glider.
Stay tuned for more exciting updates on our upcoming adventures!
JUNE 1-7, 2024 A Week at Sea: A Journey of Science and Collaboration
Last week we commenced our oceanographic journey, for the deployment of mooring instruments and the acquisition of invaluable data. Below is a firsthand account of our week-long expedition:
Sea-snake (Thermistor) Setup and Calibration
Our endeavors started by setting up and calibrating the equipment, ensuring readiness for deployment. Sea-snake thermistors were checked and calibrated, ensuring accuracy for subsequent data collection.
[media-caption path="https://oceanobservatories.org/wp-content/uploads/2024/06/Sea-snake.jpg" link="#"]Jim Edson helping in setting up the sea-snake boom, aimed at collecting near-surface sea temperature data.[/media-caption]Mooring Deployments
Given the constraints inherent to research vessels, such as cost and limited operational days, relying solely on these vessels for oceanographic data is impractical. Consequently, instruments are deployed into the sea for extended periods, facilitating the collection of data that would otherwise be challenging to obtain, especially during prolonged and stormy weather conditions. These moorings endure harsh marine environments for up to a year or more, continuously collecting and storing vital data.
The process of mooring deployment started with the attachment of instruments to the cable at designated depths, accompanied by the marking of the rope for subsequent attachment of larger instruments. The sequence began with the deployment of the syntactic sphere, followed by the attachment of additional instruments at predetermined intervals along the wire. Finally, the anchor was dropped, and the alignment and buoyancy of the instruments were ensured.
[media-caption path="https://oceanobservatories.org/wp-content/uploads/2024/06/Mooring-deployments.jpg" link="#"]The initial phase of mooring deployment, showing the 64” Syntactic sphere poised for deployment.[/media-caption] [media-caption path="https://oceanobservatories.org/wp-content/uploads/2024/06/Mooring-2.jpg" link="#"]James Ryder, Chris Newhall, and Keith Shadle affixing the Acoustic release float onto the line.[/media-caption] [media-caption path="https://oceanobservatories.org/wp-content/uploads/2024/06/Mooring-3.jpg" link="#"]Chris Newhall and James Kuo affixing the temperature salinity sensors on the line.[/media-caption]Release of anchor from the deck is captured in the video below.
[video width="848" height="480" mp4="https://oceanobservatories.org/wp-content/uploads/2024/06/anchor-deployment.mp4"][/video]
Glider deployment
[media-caption path="https://oceanobservatories.org/wp-content/uploads/2024/06/Glider-deployment.jpg" link="#"]Jessica Kozik, the glider operations lead, attaching wings to the glider that enables it to advance underwater.[/media-caption]Deployments and Challenges
While our mooring deployment was successful, we faced a few challenges. One of these is to be constantly aware that our equipment needs to be tied down and secure on our moving vessel. For example, I noticed that a row of our wooden spools was becoming loose. Promptly detecting this hazard through back deck camera footage, I alerted Joe Talbert and Jim Edson, who swiftly secured the spool, preventing a potential hazard. I quickly learnt that vigilance and swift action are pivotal in preserving the safety of our team and integrity of our equipment.
Cruising and Celebrating
With all the deployment works, we managed to celebrate two birthdays, including mine, with a delectable cake, infusing this journey with a sprinkle of joy.
[media-caption path="https://oceanobservatories.org/wp-content/uploads/2024/06/Cake.jpg" link="#"]Birthday celebrations with a delicious cake prepared by our talented cook, Evan Dunaway and chief steward, Alanna Trillingham.[/media-caption]Weathering the Storm
A swiftly escalating storm necessitated a diversion to safer waters. Nonetheless, we seized the opportunity to collect valuable data, conducting comparisons between sea-snake readings and temperature sensors to calibrate the IR temperature sensor, crucial for measuring sea surface temperatures.
[media-caption path="https://oceanobservatories.org/wp-content/uploads/2024/06/Storm.jpg" link="#"]High-speed winds sweeping across the Gulf of Alaska, captured via the Windy software.[/media-caption]Chilly Weather and Hot Chocolate
Following successful mooring deployments and CTD casts, we find ourselves back on course. Despite the chilly weather, the warmth of hot chocolate and hearty meals fills even routine tasks with enjoyment. There’s much to observe and to learn from our team of experts.
Stay tuned for further updates.
MAY 29, 2024 From a Small Town to the Vast Ocean
[media-caption path="https://oceanobservatories.org/wp-content/uploads/2024/05/IMG20240526190853-2-scaled.jpg" link="#"]The R/V Sikuliaq, loaded and ready to head out to the Global Station Papa site, about 620 nautical miles from Seward. Credit: Aditi Sharma, NIO.[/media-caption]Born in a small Indian town, my journey with the ocean began unexpectedly. Joining the National Institute of Oceanography for an internship, I immersed myself in ocean science under the guidance of Dr. Sarma. His mentorship fueled my passion, leading me to embark on a PhD journey. It was during my first cruise that the ocean’s enchantment took hold of me. As in the words of Jacques-Yves Cousteau: “The sea, once it casts its spell, holds one in its net of wonder forever.”
When the opportunity arose to participate in shipboard training in the Gulf of Alaska, I seized it eagerly. The journey from India to Boston was quite long, but the warmth of welcome from Dr. Edson and his family made every mile worth it. Exploring the operational side of oceanography at Ocean Observatories Initiative (OOI) at Woods Hole Oceanographic Institution alongside Dr. Edson and Dr. Carol Anne Clayson was fascinating. And as we journeyed from Boston to Anchorage, Alaska’s landscapes left me awestruck.
Now, aboard the RV Sikuliaq, our mission begins. Setting up the thermistor to start collecting sea surface temperature, we are navigating toward our deployment site. I still pinch myself to believe I’m living my dream. Talking about dreams, the endless daylight here makes sleep tricky, but the sight of the Alaskan mountains and the ocean under the midnight sun is worth watching. I am excited to enjoy this voyage while gaining invaluable knowledge from the experts in the field.
[media-caption path="https://oceanobservatories.org/wp-content/uploads/2024/05/IMG_20240527_083151-scaled.jpg" link="#"]A view of the Kenai mountains from the deck of the R/V Sikuliaq. Credit: Aditi Sharma, NIO.[/media-caption]
Read More
Hot Wash: Pioneer-Adjacent PIES Deployments

RAPID: A Cost-Effective Approach for Characterizing Variability at High Temporal Resolution for Long Duration on the Continental Slope of the Southern Mid-Atlantic Bight
Two popeye data shuttle-enabled current and pressure sensor equipped inverted echo sounders (PDS-PIESs, Figure 1) were successfully deployed on the continental slope east of the U.S. National Science Foundation Ocean Observatories Initiative (OOI) Pioneer Array in the southern Mid-Atlantic Bight in June 2024. Data collected during the 4-year deployments will be shared broadly when PDS pods ascend annually to the sea surface and return data batches via a satellite link.
[media-caption path="https://oceanobservatories.org/wp-content/uploads/2024/06/IMG_8421-scaled.jpg" link="#"]Figure 1. Massachusetts Institute of Technology/Woods Hole Oceanographic Institution (MIT/WHOI) Joint Program students, Ysabel Wang (right, Physical Oceanography) and Will Harris (left, Applied Ocean Science and Engineering) and WHOI technician Brian Hogue (background) preparing a PDS-PIES for deployment. The instrument will measure round trip vertical acoustic travel time with bursts of 16 pings every 10 minutes and near-bottom pressure and current measurements every 30 minutes. The PDSs (orange) are scheduled to rise to the sea surface to return data batches remotely on September 1 in 2024 and yearly thereafter until 2027 with recovery of the PIES (white) planned for 2028.[/media-caption]The scientific motivation is to (1) capture mesoscale variability offshore of the Pioneer Array, (2) capture western excursions of the Gulf Stream North Wall that may influence ocean-shelf exchange, and (3) observe the upper portion of the equatorward-flowing Deep Western Boundary Current where it squeezes under the poleward flowing Gulf Stream. The PDS-PIESs were deployed on the 1000 m isobath 40-km apart to extend the Pioneer Array mooring footprint offshore and to allow comparison with a glider which is running a line (nominally) along the 1000 m isobath (Figure 2).
[media-caption path="https://oceanobservatories.org/wp-content/uploads/2024/06/Screenshot-2024-06-11-at-2.08.19-PM.png" link="#"]Figure 2. Map of PDS-PIESs (red dots, C1: 36° 3.125′ N; 74° 42.365′ W and C2: 35° 42.005′ N; 74° 46.209′ W), Pioneer moorings (yellow dots), and nominal offshore Pioneer glider line (blue). Red curve is time-averaged position of the Gulf Stream core and dotted lines are Jason altimeter tracks. Heavy contours are the 200 and 1000 m isobaths.[/media-caption]Cruise RR2407 was supported through the Office of Naval Research through the National Ocean Partnership Program Global Internal Wave (NGIW) study and provided at sea experiences for four MIT/WHOI Joint Program students and four undergraduates from the University of Massachusetts Dartmouth as part of their Blue Economy Program with WHOI. Many thanks to the National Science Foundation Division of Ocean Sciences for funding the PDS-PIES deployments and to engineer Erran Sousa from the University of Rhode Island who provided emergency shoreside support (on a Saturday!) to walk us through the PDS setups.
Read More
Survey to Help First-Timers at Sea
Meg Yoder, a 4th year PhD student at Boston College is writing a general guide to going to sea for first-time, sea-going scientists, particularly those not housed at oceanographic institutions working for the broader impacts chapter of for her dissertation. She is collecting information from both early career researchers and experienced researchers using a survey here.
Meg was inspired to write this guide based on her experience going to sea for the first time two summers ago. She could find little information online about what the actual sea-going experience would be like, and what found was often outdated or very specific to certain vessels or cruises.
Please take a few minutes to complete the short survey. Your input is important so Meg can understand what other early career researchers are interested in hearing about prior to going to sea.
[media-caption path="https://oceanobservatories.org/wp-content/uploads/2024/06/IMG_1544-scaled.jpg" link="#"]Meg Yoder (foreground) shows two Boston College undergraduates the back deck of the R/V Neil Armstrong prior to their departure for the Irminger 11 expedition. Credit: D Trew Crist © WHOI. [/media-caption] Read MoreA Relationship Borne of OOI
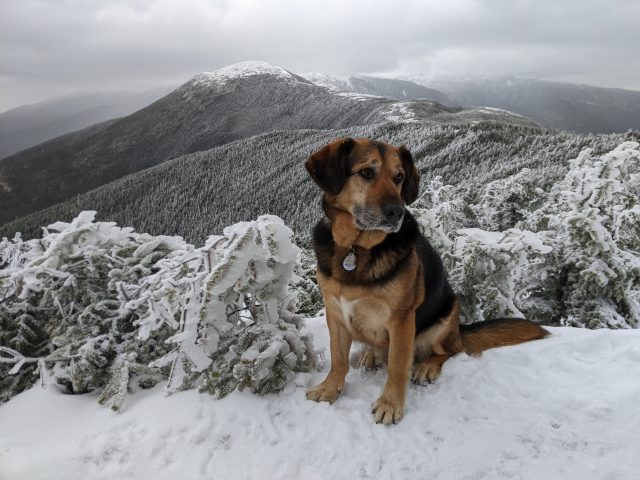
OOI Engineer Jennifer Batryn had traveled to Punta Arenas, Chile in October 2016, to help mobilize for the third deployment and recovery cruise of the Global Argentine Basin Array. Punta Arenas is home to numerous street dogs, including a pack that slept in front of the hotel where the National Science Foundation Ocean Observatories Initiative (OOI) team was staying. On the way to begin work the first morning, Batryn stopped to pet several of the dogs and happily encouraged one to follow her to the warehouse facility where the team was working. He snuck through the port security entrance and joined Batryn and the team at the warehouse for the morning. When Batryn went into town for lunch, he followed and waited patiently outside of the restaurant. He then followed Batryn back to the warehouse for the afternoon and to the hotel at the end of the day. This pattern continued for the next week and a half while the team built and prepared the moorings.
[media-caption path="https://oceanobservatories.org/wp-content/uploads/2024/06/IMG_20161016_162823687-scaled.jpg" link="#"] OOI Instrument Lead Jennifer Batryn with her Punta Arenas Street dog, Teddy, outside the hotel in Chile. [/media-caption][media-caption path="https://oceanobservatories.org/wp-content/uploads/2024/06/IMG_20161011_113630857-scaled.jpg" link="#"]Teddy relaxing (and waiting for pets) outside the warehouse in the Punta Arenas port facility.[/media-caption]
When it came time to start loading the R/V Nathaniel B Palmer, Batryn realized that this dog had weaseled its way into her heart and decided she wasn’t leaving Chile without him. (Editor’s note: After looking into Teddy’s eyes, it is easy to understand how this happened!). “Teddy had the sweetest and most laid-back personality. He loved getting belly rubs and pats but also was content napping on a piece of foam in the warehouse, completely unfazed by the forklift trucks and other commotion going on. He was also amazingly dirty from living on the streets and my hands would instantly get a black film on them after petting him, but there was no way I could say no to him, “said Batryn. She chose the name Teddy since he was like a big teddy bear and started looking into the many logistics necessary to bring him back home with her.
Batryn only had several days to figure everything out before boarding the ship for three weeks. Since there were no pet stores nearby, she walked to a large grocery store and purchased a collar, leash, and a large bag of dog food. She then found a local vet clinic through a web search and got the name and phone number of a local dogsitter from the port agent. With that information in hand, Batryn enlisted the help of a friendly hotel employee to make the necessary phone calls to schedule an appointment since her Spanish was limited. She lucked out and was able to arrange a vet appointment the next day and scheduled a taxi to pick her and Teddy up from the port and take them across town.
The next day was Teddy’s first day wearing a collar and leash. It took some getting used to as he watched the other street dogs running down the busy street chasing cars without being able to join in. It would be a day of many more firsts. When it came time for the taxi to pick Batryn and Teddy up from the port entrance, Teddy, who was used to chasing cars and not riding in one, wanted no part of getting inside the vehicle. The port security guard saw the struggle and kindly offered to help lift the nearly 60 lb. dog into the back of the taxi. During the stressful ride across town, Batryn tried to comfort Teddy. When they arrived at the vet office, the front desk assistant saw Batryn’s dirty hands and exclaimed, “Ahh, mecánica!” assuming the black film on her hands was due to work as a mechanic, and not the result of petting a dirty street dog.
Batryn had previously read that Chile is free of dog rabies and that rabies vaccines were not required from that origin, but she decided to play it safe to help ensure smooth entry into the United States. She had Teddy receive all the basic shots necessary for travel, as well as a rabies shot and a certificate from the vet that Teddy was cleared for travel. Since it would be mid-November by the time they flew back to New England together, Batryn also got a signed notice that Teddy was acclimated to cold temperatures, having lived outside on the streets of Punta Arenas. This would increase the chances that the airlines would allow Teddy to travel if air temperatures happened to dip on their planned travel day. Teddy then had to endure a second cab ride to the dog sitters where he would live for the next several weeks while Batryn was at sea.
The logistics of bringing Teddy back home continued for Batryn during her three weeks at sea. In her down time between mooring operations, she used the limited ship Wi-Fi to call family and friends back home. She coordinated with her mother in California to purchase a dog kennel suitable for airline travel and asked a friend who was flying down to join her for hiking afterwards to take the giant kennel as a second piece of checked luggage. Batryn also enlisted the help of an Argentinian guest student onboard the Palmer to help call the dog sitter back in Punta Arenas to have her measure Teddy for properly sizing a kennel. The sitter also offered to give Teddy a much-needed bath before his travel to the US. The sitter later described this process to Batryn in a mix of Spanish and English as the dirtiest bath he’s ever given, with the water coming off Teddy looking “like coffee”.
Air travel is not permitted for the first four weeks after receiving a rabies vaccine, but Batryn’s time at sea combined with her week of hiking with her friend turned out to be perfect for the human-canine match. After a successful cruise and hike, Batryn reunited with her dog, but there was a small hitch. The dog kennel that her friend brought down was borderline too small for Teddy and had the potential to be rejected based on the airline guidelines. Not to be deterred, Batryn called upon the good graces of her dog sitter who traded the new kennel for an older, larger one that would allow Teddy to be more comfortable during his nearly 24-hour journey to Boston.
[media-caption path="https://oceanobservatories.org/wp-content/uploads/2024/06/DSC_3365-scaled.jpg" link="#"]Jennifer’s layover in Santiago was long enough to allow for picking up Teddy from the separate cargo area and a nice pit stop for him outside before the next big flight.[/media-caption]The big travel day went relatively smoothly. Due to the size of the new, larger kennel, Teddy had to fly with cargo on the first leg of the journey from Punta Arenas up to Santiago. That meant that Batryn had to exit the airport in Santiago to claim Teddy from a separate cargo area. Fortunately, a friendly cab driver outside the airport offered to walk with Batryn down the street to the cargo section. The next leg of the journey took Batryn and Teddy from Santiago, Chile, up to Miami, Florida. When claiming luggage to clear US customs, the large kennel again proved difficult as it was too large to fit on a standard luggage cart. Fortunately, a helpful airport employee helped load Teddy in his crate onto a larger airport cart and escorted them through customs. Much to Batryn’s surprise, they breezed through customs, despite bringing in a live animal from another country. The new team caught their final flight up to Boston and soon enough Batryn and Teddy were in Massachusetts on their way home to Cape Cod.
Once home, Teddy quickly settled into the idea of a more pampered life with comfortable beds, couches, regular meals, walks to the beach, and lots of attention. While he had to work through some initial separation anxiety, Teddy started coming into the LOSOS facility at Woods Hole Oceanographic Institution after just a couple days of being in the US. Ever since, Teddy has become a gentle fixture at LOSOS, getting pets from everyone who passes by, and spreading Chilean hospitality and good cheer every day.
Read More
Pioneer MAB Providing Turbidity from OOI Core Fluorometers
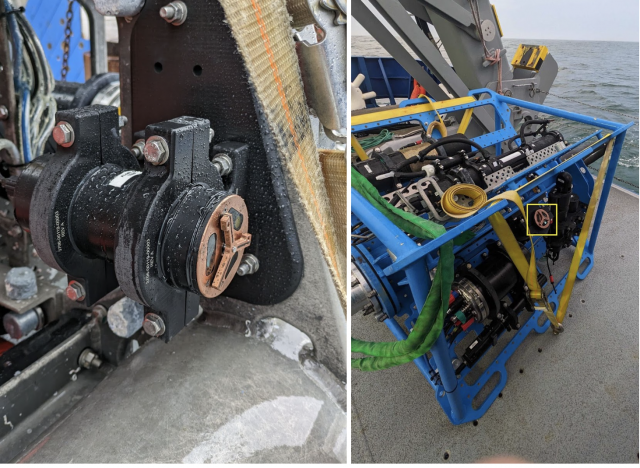
OOI is now providing telemetered turbidity measurements from the Coastal Pioneer Mid-Atlantic Bight (MAB) Array using Sea-Bird Scientific ECO triplet-w optical sensors. A test deployment showed that these instruments measured turbidity consistent with co-located turbidity meters that were recommended at the scientific community workshops. The results of the test deployment confirmed that OOI could satisfy the request for turbidity data with re-purposed instruments already in the suite of OOI core sensors. OOI has used ECO triplet-w optical sensors to measure chlorophyll a, CDOM fluorescence, and optical backscatter. This April, ECO triplet sensors were deployed with a secondary calibration from the vendor to convert backscatter channel (700 nm wavelength) measurements to turbidity in Nephelometric Turbidity Units (NTUs).
[media-caption path="https://oceanobservatories.org/wp-content/uploads/2024/05/Screenshot-2024-05-30-at-4.33.23-PM.png" link="#"]Figure 1: Comparison of turbidity recorded during Coastal Pioneer MAB Array At-Sea Test 3 from a Seapoint turbidity meter and a Sea Bird ECO triplet optical sensor. Data shown was recorded in March 2023 at a depth of 35 m.[/media-caption]To conduct the test deployment, turbidity measurements were recorded every 15 or 30 minutes from 1-minute bursts of sampling at 1 sample per second (1 Hz) by both the ECO-triplet and co-located community-recommended turbidity meters. Turbidity in NTUs from the ECO triplet was calculated by applying a vendor-supplied scaling factor to the raw voltage counts minus the dark counts. The requested turbidity meters reported their measurements as a mean of the sample burst measurements, so the mean of each ECO triplet sample burst was computed for comparison. The burst means from ECO triplets were compared with the other turbidity meter measurements at the same location and depths. A time series comparison from 35 m depth during March 2023 showed a mean difference of 0.2 NTU between the two instruments. The standard deviation of the difference at 35 m depth was 1.2 NTU (Fig. 1). The March 2023 comparison at 7 m depth showed a mean difference of 0.1 NTU. The standard deviation of the difference at 7 m depth was 0.06 NTU. Turbidity measurements recorded before and after a CTD cast at the start of the test deployment were also within 0.15 NTUs of the mean turbidity measurements in the surface mixed layer and bottom layer from a rosette-mounted Wet Labs FLNTURTD. The full report on the test deployment, At-Sea Test 3, is available upon request. Based on the results of the test deployment, the OOI Program determined that the ECO triplet-w optical sensors with a secondary calibration could deliver good quality turbidity data.
ECO triplet optical sensors deployed as part of the Coastal Pioneer MAB Array now allow OOI to serve turbidity data from all 3 surface moorings at 7 m depth and 1 m above the seafloor. The use of existing OOI core sensors simplified integration into the instrument platforms, since additional ECO triplets only had to be added to seafloor nodes, and it streamlined the process of serving data, since existing sensor processing code could be reworked to provide turbidity data. Turbidity data delivered by OOI include all samples recorded during a sample burst so that data users can apply their preferred aggregation method. Since April, the ECO triplets on the near-surface platforms (Fig. 2, right) have been sampling at 1 Hz for bursts of 3 minutes four times an hour, and on the seafloor nodes (Fig. 2, left) the sensor samples at 1 Hz for 17 minutes once an hour. Data users can view telemetered turbidity data here: Coastal Pioneer MAB Array turbidity on Data Explorer.
[media-caption path="https://oceanobservatories.org/wp-content/uploads/2024/05/Screenshot-2024-05-30-at-4.32.51-PM.png" link="#"]Figure 2: Sea Bird ECO triplet optical sensors that are measuring turbidity are mounted on the Seafloor Multi-Function Node (left) and on the Near-Surface Instrument Frame (right, yellow box) of the Coastal Pioneer MAB Surface Moorings: Northern, Southern, and Central. The copper-covered “Y” is a wiper blade that prevents growth and marine debris from accumulating over the oval sensor windows. Credit: Sawyer Newman © WHOI. [/media-caption]
Read More
Ian Black: Taking Inspiration from OOI
As an undergraduate at Oregon State University (OSU), Ian Black attended an oceanography course taught by the OOI’s Coastal Endurance Array Principal Investigator Ed Dever, where he was introduced to key oceanographic concepts and the observational capacity of the OOI. Black was so intrigued by the work that he approached Dever and asked about an internship with the OOI Endurance Array.
“Initially it was scraping barnacles, turning wrenches, very dirty and manual labor,” explained Black. “And I liked it. The project and its mission made sense to me.” The OOI provided Black with his first experience at sea, the Regional Cabled Array’s VISIONs cruise in 2015, where he sailed with another OOI alum Katie Bigham. Toward the end of his internship and undergraduate program, Black was interested in continuing to work on the Endurance Array and was encouraged to pursue a master’s degree. Throughout graduate school, Black continued to work part-time on the Endurance Array, continuing to scrape barnacles, but also gained some experience in electronics and coding.
In 2018, Black received his M.S. in Marine Resource Management and was hired on as an Endurance Array technician. Between 2018 and 2021, Black focused primarily on the Coastal Surface Piercing Profilers that are deployed at the CE01, CE02, CE06, and CE07 sites located off Oregon and Washington. He also provided assistance with the large coastal surface moorings and gliders during downtime and cruises.
Not one to sit still too long, Black decided to pursue a PhD, again at OSU in 2021. Black was originally brought on by his co-advisors, Dr. Clare Reimers and Dr. Maria Kavanaugh, to focus on the bio-optical sensors that are to be deployed on the NSF’s new Regional Class Research Vessels. While waiting for the deployment of these vessels, Black has developed a newfound interest in marine heatwaves. Currently, he and his advisors have a manuscript under review where they use OOI Endurance Array data to explore the biophysical impacts of marine heatwaves on phytoplankton.
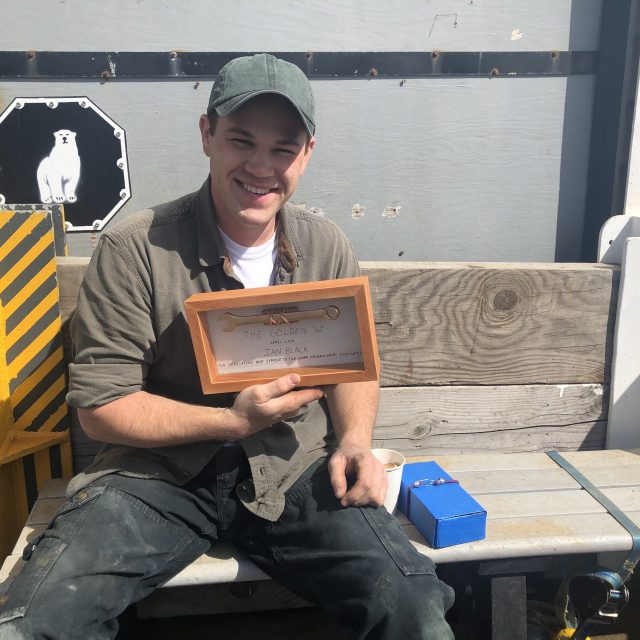
[media-caption path="https://oceanobservatories.org/wp-content/uploads/2024/05/Profiler-Victory-2-scaled.jpg" link="#"]Left to Right: Jon Fram, Ian Black, Alex Wick, and Steve Lambert pose with a recently recovered profiler. Credit: Oregon State University.[/media-caption]For the next chapter in his PhD dissertation, Black plans to again use OOI data from the Endurance Array to explore the finer scale effects of marine heatwaves over the Oregon shelf. “There are a lot of high-resolution data products from the moorings, profilers, and gliders that could be combined to tell an interesting story”, Black said. In particular, there are some “some really interesting still images from the camera located at the shelf site that coincide with events or phenomena that are commonly introduced in oceanography courses, much like the class Ed (Dever) taught all those years ago. Seeing these things with real data really reinforces those core oceanographic concepts.” Black hopes that this work will end up as a second manuscript, but at the very least “the code and results can be used as a tool, perhaps in the classroom, to show students that the concepts they learn about are supported with modern data.” Black added that has been instrumental in his PhD research. He uses it between several times per week to review, process, and assess data.
“The OOI Endurance Team has been supportive at every stage of my career so far, not just the OOI ones. “It’s a great place to work and Ed (Dever) and Jon (Fram) work hard to keep people invested in the project.” The few years working as a technician and almost decade of interaction with the OOI has been an important part of my development. Black added, “I even missed the camaraderie so much that I recently volunteered to join the 20th deployment of the Endurance Array (EA20) this past spring.” As an undergraduate, Black’s first Endurance cruise was EA5.
Black brings an interesting perspective to OOI data. He now looks at it from the vantage point of a scientist and how it can be used to answer questions, as well as from an engineering viewpoint on how data are collected in such a unforgiving marine environment. “The amount of data offered by OOI is daunting and is going to take anyone, regardless of data analysis skill level, a long time to look through. In my opinion, it is particularly important for graduate students, who might have more time to look at the data, to just start looking to see what they can find.” Black gave an example of the richness and uniqueness of data available. In 2019 as the Blob 2.0 marine heatwave was expanding in the Northeast Pacific, he was deploying an OOI profiler at the Oregon shelf site (CE02SHSP). Due to platform malfunction, operator error, or a combination of, the profiler decided to surface every 20 minutes for 2 days instead of the typical 12 hours for 2 months. Black hopes that something interesting could be found in this data and thinks it could make for a good term project for a class. “It’s very interesting data and it’s public’s data.” If Black stays in academia, he plans to encourage his students to explore open data collected by groups such as the NSF’s OOI.
Read More
Zotero Now Connected to OOI-Related Publications

The OOI is now using Zotero as a back-end publications tool that is helping make OOI-related publications easier to find, sort, and share. Since 2017, OOI has been keeping track of peer-reviewed scientific publications that either use OOI data or cite OOI as a resource for their findings. The list is closing in on 400, with 302 lead authors, representing 166 institutions from 26 countries making an efficient tracking, sorting, and accessing method essential.
The switch to Zotero was made to enhance users’ experience and to ensure easy tracking of OOI-related work. “For Zotero users, this tool offers many more import and editing options that will adapt to many workflows,” said Data Librarian Audrey A. Mickle at Woods Hole Oceanographic Institution. “Zotero offers more features and adaptability for users, such as adding items directly with a browser extension or choosing between web based and local clients, than were available with our previous publications sorting tool. By making this switch, we will enhance users’ experience while improving our own collecting, sorting, and posting processes.”
OOI is joining a huge Zotero community. At least 7.5 million people have a Zotero account, which offers a similar platform to other commonly used bibliographic tools. This uniformity makes it easier for people to learn how to keep bibliographies on Zotero.
Added Jim Edson, Principal Investigator for OOI’s Program Management Office, “OOI is always striving to improve how we operate by making things more efficient, reliable, and durable. Zotero meets these objectives, and we hope OOI data users check out our latest publication tracker supported by Zotero.”
If you would like to add a publication that we may have missed, please let us know here and we will add it to our list.
Read More
Close-up View of An Active Hydrothermal Vent Now Easily Accessible
Now accessible on OOI’s Data Explorer: 47,000 hours of video from a high-definition (HD) camera at an active hydrothermal vent and underwater volcano, 1500 meters below the ocean’s surface!
The HD camera has been streaming live video since 2015, offering a close-up look at what’s been happening within the caldera of Axial Seamount, a highly active underwater volcano about 300 miles off the coast of Oregon. The SubC 1Cam video camera was modified by the Applied Physics Lab (APL) at the University of Washington for deployment on OOI’s Regional Cabled Array (RCA) in the NE Pacific Ocean. The camera is connected via a roughly 4 km dedicated 10 Gb extension cable that runs across the caldera from the camera in the ASHES vent field to Primary Node PN3B located near the eastern edge of the caldera. From there imagery are streamed at the speed of light over 521 km of submarine fiber optic cable to the shore station in Pacific City, OR.
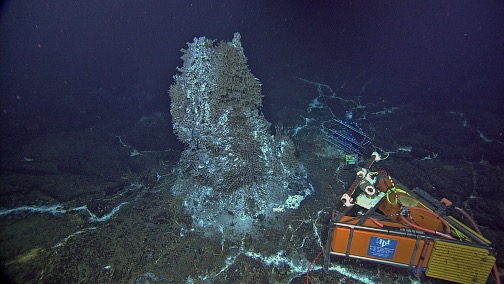
[media-caption path="https://oceanobservatories.org/wp-content/uploads/2024/05/HD-Camera.jpg" link="#"]The HD camera (orange triangular frame) images the 14 ft-tall actively venting hot spring deposit ‘Mushroom’ located within the caldera of Axial Seamount. Credit: NSF-OOI/UW/CSSF; Dive R1730; V14.[/media-caption]Up until recently, the footage has been available on the OOI raw data server in 14-minute increments as both high resolution MOV files and compressed MP4 formats, but the imagery was not easily reviewed or searchable. To make this unique nearly decade of footage more readily available to researchers, a new gallery feature on Data Explorer was created that allows researchers to easily view, search, and download the stunning video. All files created over each 24-hour period are used to create a sped-up, compressed, and time-stamped preview video allowing rapid overviews of daily events. Associated metadata and quick links provide access to the raw and log files, and a higher-resolution version of the preview is also available for download.
“The camera faces an active hydrothermal edifice called Mushroom that is completely encased in a dense biological community thriving in fluids emanating from the chimney walls,” explained Michael Vardaro, a research consultant for the RCA, who has been involved in OOI since construction began in 2011. “Mushroom hosts an active chemosynthetic community with 300 ºC hydrothermal fluids streaming out its top and from a small, highly dynamic chimney at its base. The camera allows the research community to see how the flow of hydrothermal fluid and the activity of all the different creatures living on it change over time, as well as the growth and evolution of the sulfide structure.”
Vardaro also said that the video allows viewers to watch what is happening in the short term. “You can catch predation events that include little scale worms nibbling on the gills of the tube worms. You can observe sea spiders [pycnogonids] crawling around the base of the chimney and watch as new vent openings develop. It’s a very changeable environment, because as the hydrothermal fluid hits the cold seawater, the metals and other chemicals dissolved in the superheated water precipitate out as solid minerals, creating fragile projections that then repeatedly crumble over time as the flow changes. The camera imagery provides important insights into linkages among geological, chemical and biological process at seismically active underwater volcano that has erupted in 1998, 2011, and 2015 and is poised to erupt again.”
[embed]https://youtu.be/oiDxkHWB3rI[/embed]The chimney stands about 14 feet high. The camera sits on a tripod at the base of the chimney with a pan and tilt unit. It follows an automated, 14-minute routine with the camera moving up, down and across the chimney and water column, stopping at pre-selected key areas of interest. What’s more, the APL team onshore can stop and alter the viewpoint if something interesting is happening or a question needs answering. “The Data Explorer now offers a hugely rich dataset of video footage extremely rare in mid-ocean ridge settings that offers a unique window into what is happening on the seafloor at an active hydrothermal vent site,” Vardaro added. “As development on the gallery continues, we also plan to add annotations and eventually incorporate machine learning and event detection to tag interesting biological features or significant changes to the site”.
In addition to the Data Explorer access, the live video stream is available every three hours for 14-minutes online (at 2:00, 5:00, 8:00, and 11:00 EDT & PDT). The camera also runs for 24 hours straight on the 10th and 20th of the month, with a 72-hour run on the 1st-3rd of the month as a means of gaining a fuller picture of activity at the site.
[embed]https://youtu.be/VjqduffxNyU[/embed]
Read More