
News
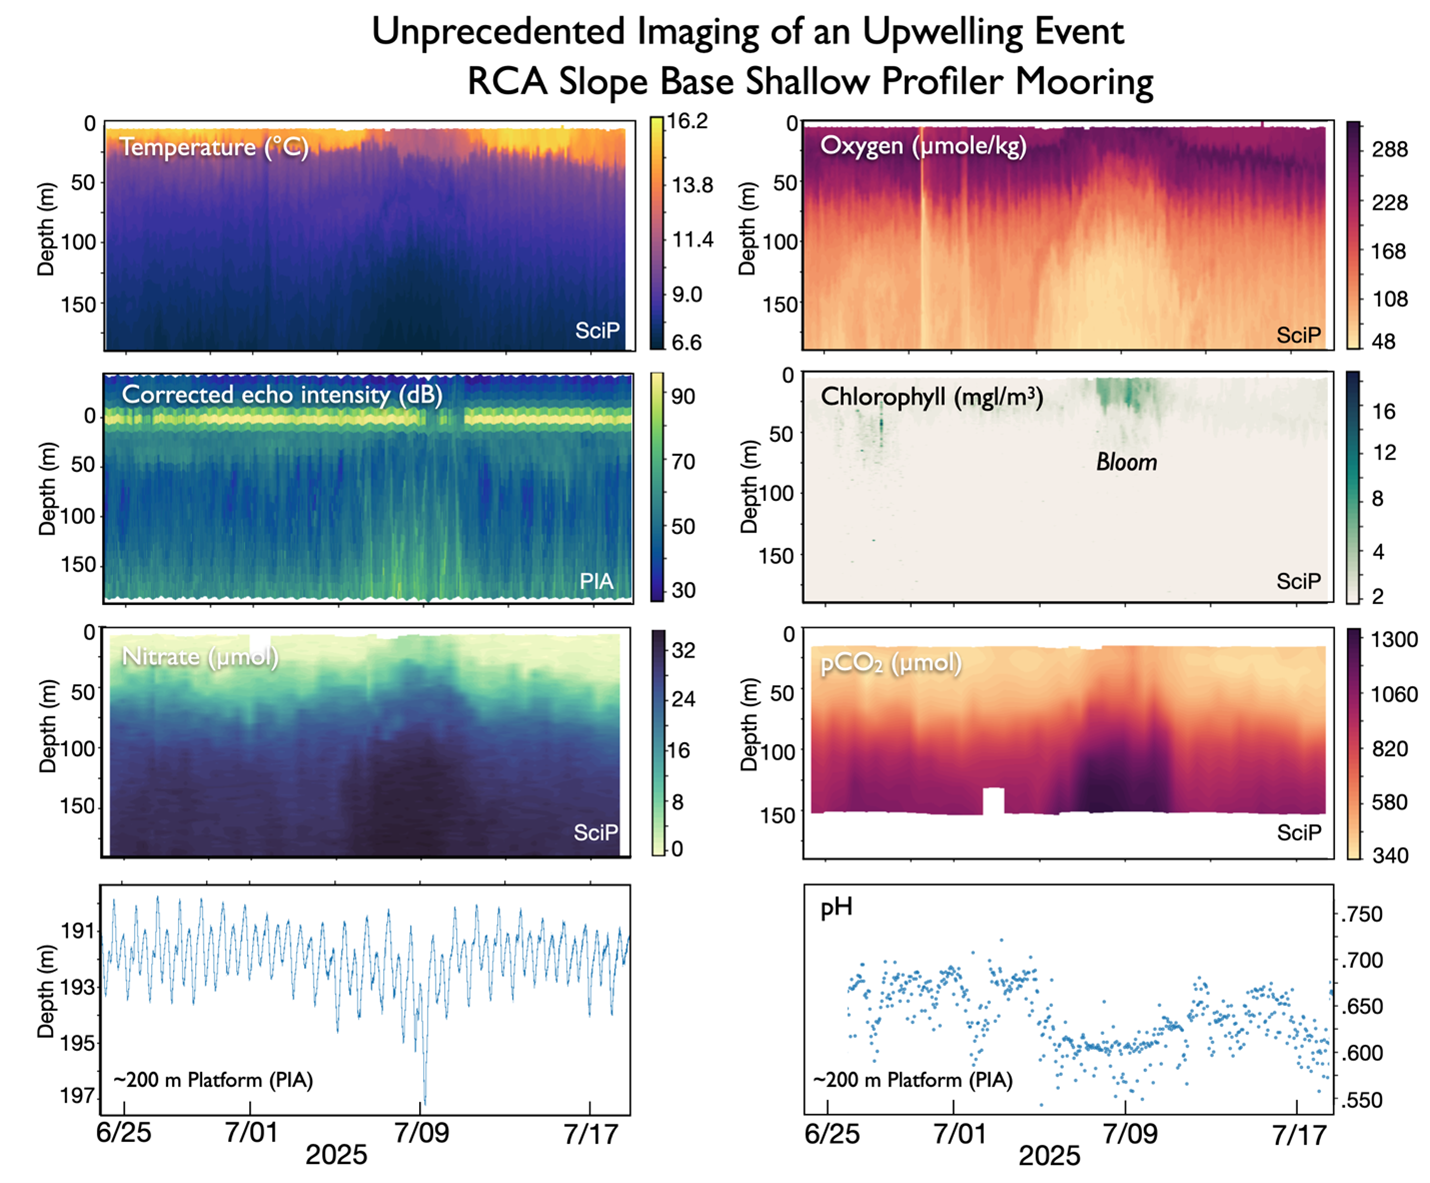
Unprecedented Imaging of an Upwelling Event: RCA Slope Base Shallow Profiler Mooring
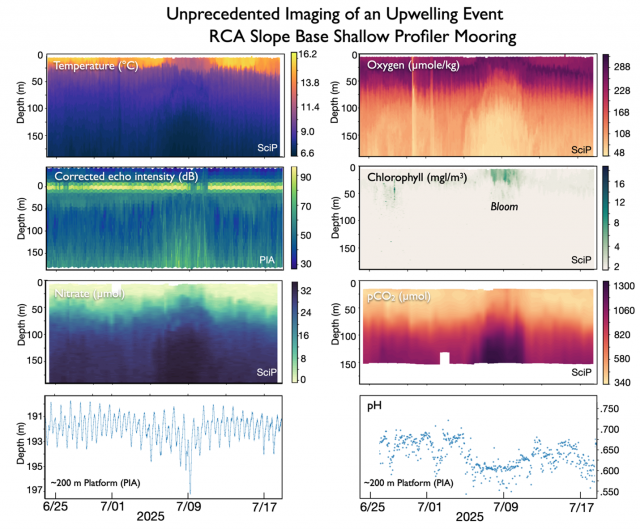
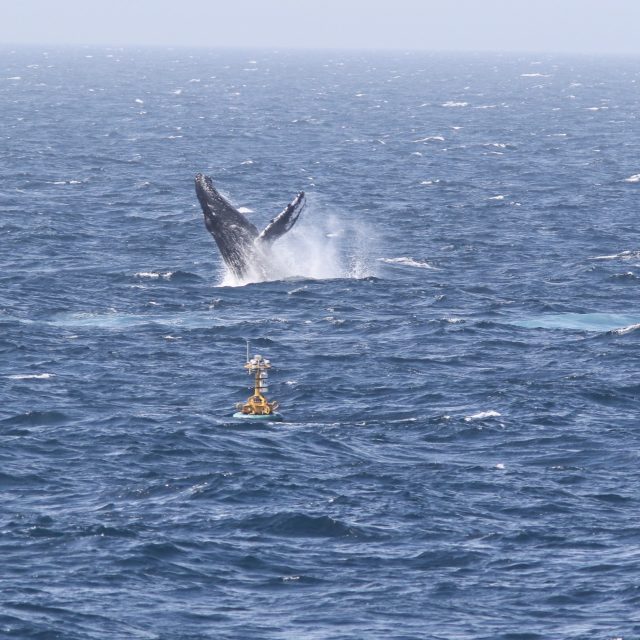
Co-registered instruments on the Slope Base Shallow Profiler Mooring, located 108 km offshore Newport, Oregon, yield unprecedented high resolution imagery of a possible short-lived upwelling event and resultant bloom, ~July 5-13, 2025. The above plots from live streaming data from sensors on the stationary platform interface assembly (PIA) located at ~ 200 m water depth (150 kHz ADCP, CTD-O2, and pH), and on an instrumented winched science pod (SciP)(CTD-O2, nitrate, pCO2, 3 wavelength fluorometer), which traverses 9 times a day from ~ 200 m to ~ 5 m beneath the ocean’s surface, highlight the arrival of cold, nutrient-rich water to the surface layers, coinciding with elevated chlorophyll-A concentrations and increased echo intensity in the ADCP data, as well as increased pCO2 and decreased dissolved oxygen concentrations at depth. These trends are coincident with a decrease in temperature, conductivity, dissolved oxygen concentrations, and pH on the PIA. In contrast to the SciP chlorophyll profile, which indicate a bloom in the surface waters above 50 meters, the PIA chlorophyll-A concentrations show no active blooms in the deeper waters. Interestingly, this event coincides with an increase of sea water pressure as measured at the 200 platform, indicating possible current forcing from the NE (and eddy?) acting to “blow down” the platform by ~ 6 m. Several other blow down events have occurred at the Slope Base and Oregon Offshore sites, the largest of which in the summer of 2019 blew the Slope Base platform nearly 50 m deeper and ~350 m to the west.
Categorizing Science Highlights by OOI Themes

The OOI supports a broad and diverse range of ocean research, covering topics from ocean-atmosphere exchange to coastal ecosystem dynamics to the sub-seafloor biosphere To make this science more accessible and to better communicate the scope of work being conducted, we’ve launched an effort to categorize our Science Highlights using the six core science themes outlined in the Vision for OOI:
These themes are:
- Climate variability, ocean food webs, and biogeochemical cycles
- Ocean-atmosphere exchange
- Coastal ocean dynamics and ecosystems
- Global and plate-scale geodynamics
- Turbulent mixing and biophysical interactions
- Fluid-rock interactions and the sub-seafloor biosphere
We’ve begun tagging Science Highlights with one or more of these themes, laying the groundwork for users to more easily search and browse the collection. This approach not only aligns our science communication with the program’s long-term goals but also highlights how individual studies span multiple themes and contribute to broader scientific questions.
Looking ahead, we plan to extend this thematic tagging structure to peer-reviewed publications that use OOI data. Tagging publications by both their associated array(s) (e.g., Endurance Array, Pioneer Array, Regional Cabled Array) and science theme(s) will enable more flexible and targeted exploration of the literature. Users will be able to filter outputs by geographic location and thematic focus, making it easier to discover relevant work.
This effort is part of a broader initiative to enhance the organization, accessibility, and impact of OOI-supported research. Our goal is to make it easier for all users – scientists, educators, students, and policymakers to find the information most relevant to their work and to understand how OOI data contributes to answering major questions in ocean science.
As we continue this work, we welcome community feedback on how these tools and categories can be refined to best serve the needs of our users.
Read More
OOIFB Focus Group Highlights the Power of the Imaging FlowCytobot
Back in 2021, a series of community-driven Innovations Labs helped shape the scientific priorities for the relocation of the OOI Pioneer Array from the New England Shelf to the Mid-Atlantic Bight (MAB). One high-priority request that emerged was phytoplankton imaging, essential for advancing our understanding of biogeochemical cycling and ecosystem responses.
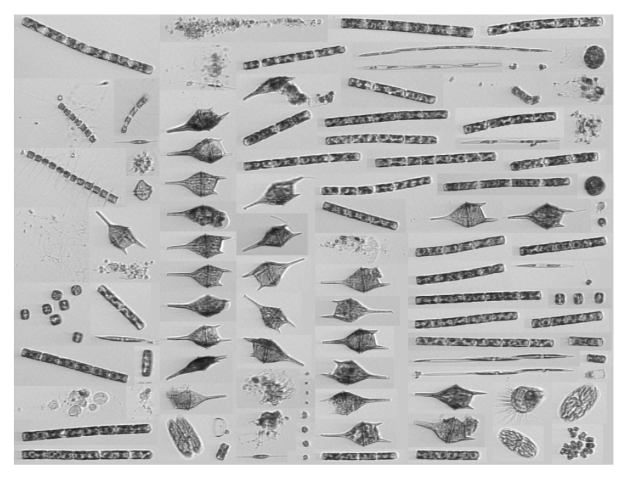
To meet that need, the OOI deployed a state-of-the-art Imaging FlowCytobot (IFCB) on the Pioneer MAB Central Surface Mooring in April 2024. This oceanographic sensor merges flow cytometry and video imaging to capture high-resolution images of microscopic aquatic life (mainly phytoplankton) while also recording key properties like chlorophyll fluorescence and light scattering. After running for a full year, the instrument was recovered in April 2025, and its data are now publicly available to researchers and educators alike.
Goals and Activities of the 2025 Focus Group
To engage the research community with this unique data collection tool, the U.S. National Science Foundation OOI Facility Board (OOIFB) hosted a 2.5-day Focus Group from June 18–20, 2025, at the University of North Carolina Wilmington’s Center for Marine Science. The goal was to build a community of practice around the new IFCB deployment, showcasing its potential and offering hands-on opportunities for the ocean science community to engage with this cutting-edge technology.
Roughly 30 participants gathered for a deep dive into all things IFCB. The event kicked off with an introduction to the technology itself and its integration with OOI infrastructure. Participants then explored real-world research applications of IFCB data, followed by tutorials on how to access, download, and work with these datasets using the IFCB dashboard interface.
Attendees used Python, MATLAB, and R coding environments to visualize and analyze IFCB data, tackling a range of scenarios that revealed both the strengths and limitations of these data products. The format allowed users to compare workflows and troubleshoot in real time, promoting collective problem-solving and peer learning.
Roundtable discussions between participants and OOI Program Managers helped clarify what the IFCB community needs from the data and the associated tools. From those conversations, ideas emerged for future resources like shared GitHub repositories, use-case-driven tutorials for students, and dedicated forums to continue building community momentum.
Community Engagement
This focus group showcases how OOI actively fosters community engagement, especially when introducing new scientific capabilities. By building meaningful “on-ramps” for users to access data, apply new methods, and contribute to shared tools, OOI is cultivating a collaborative research environment. These events bring people together across disciplines and career stages, helping to democratize access to oceanographic data. They foster shared ownership, letting researchers shape how OOI data is used and understood.
By fostering a culture of open access and technical sharing, the focus group strengthened the foundation of a growing IFCB user community, one capable of advancing our understanding of marine ecosystems at the microbial level. The IFCB is a catalyst for connection, discovery, and long-term scientific collaboration.
[gallery size="large" ids="36719,36720,36721,36722,36723"] Read MoreOcean Observatories Initiative: Budget Information and Impacts (FY26)
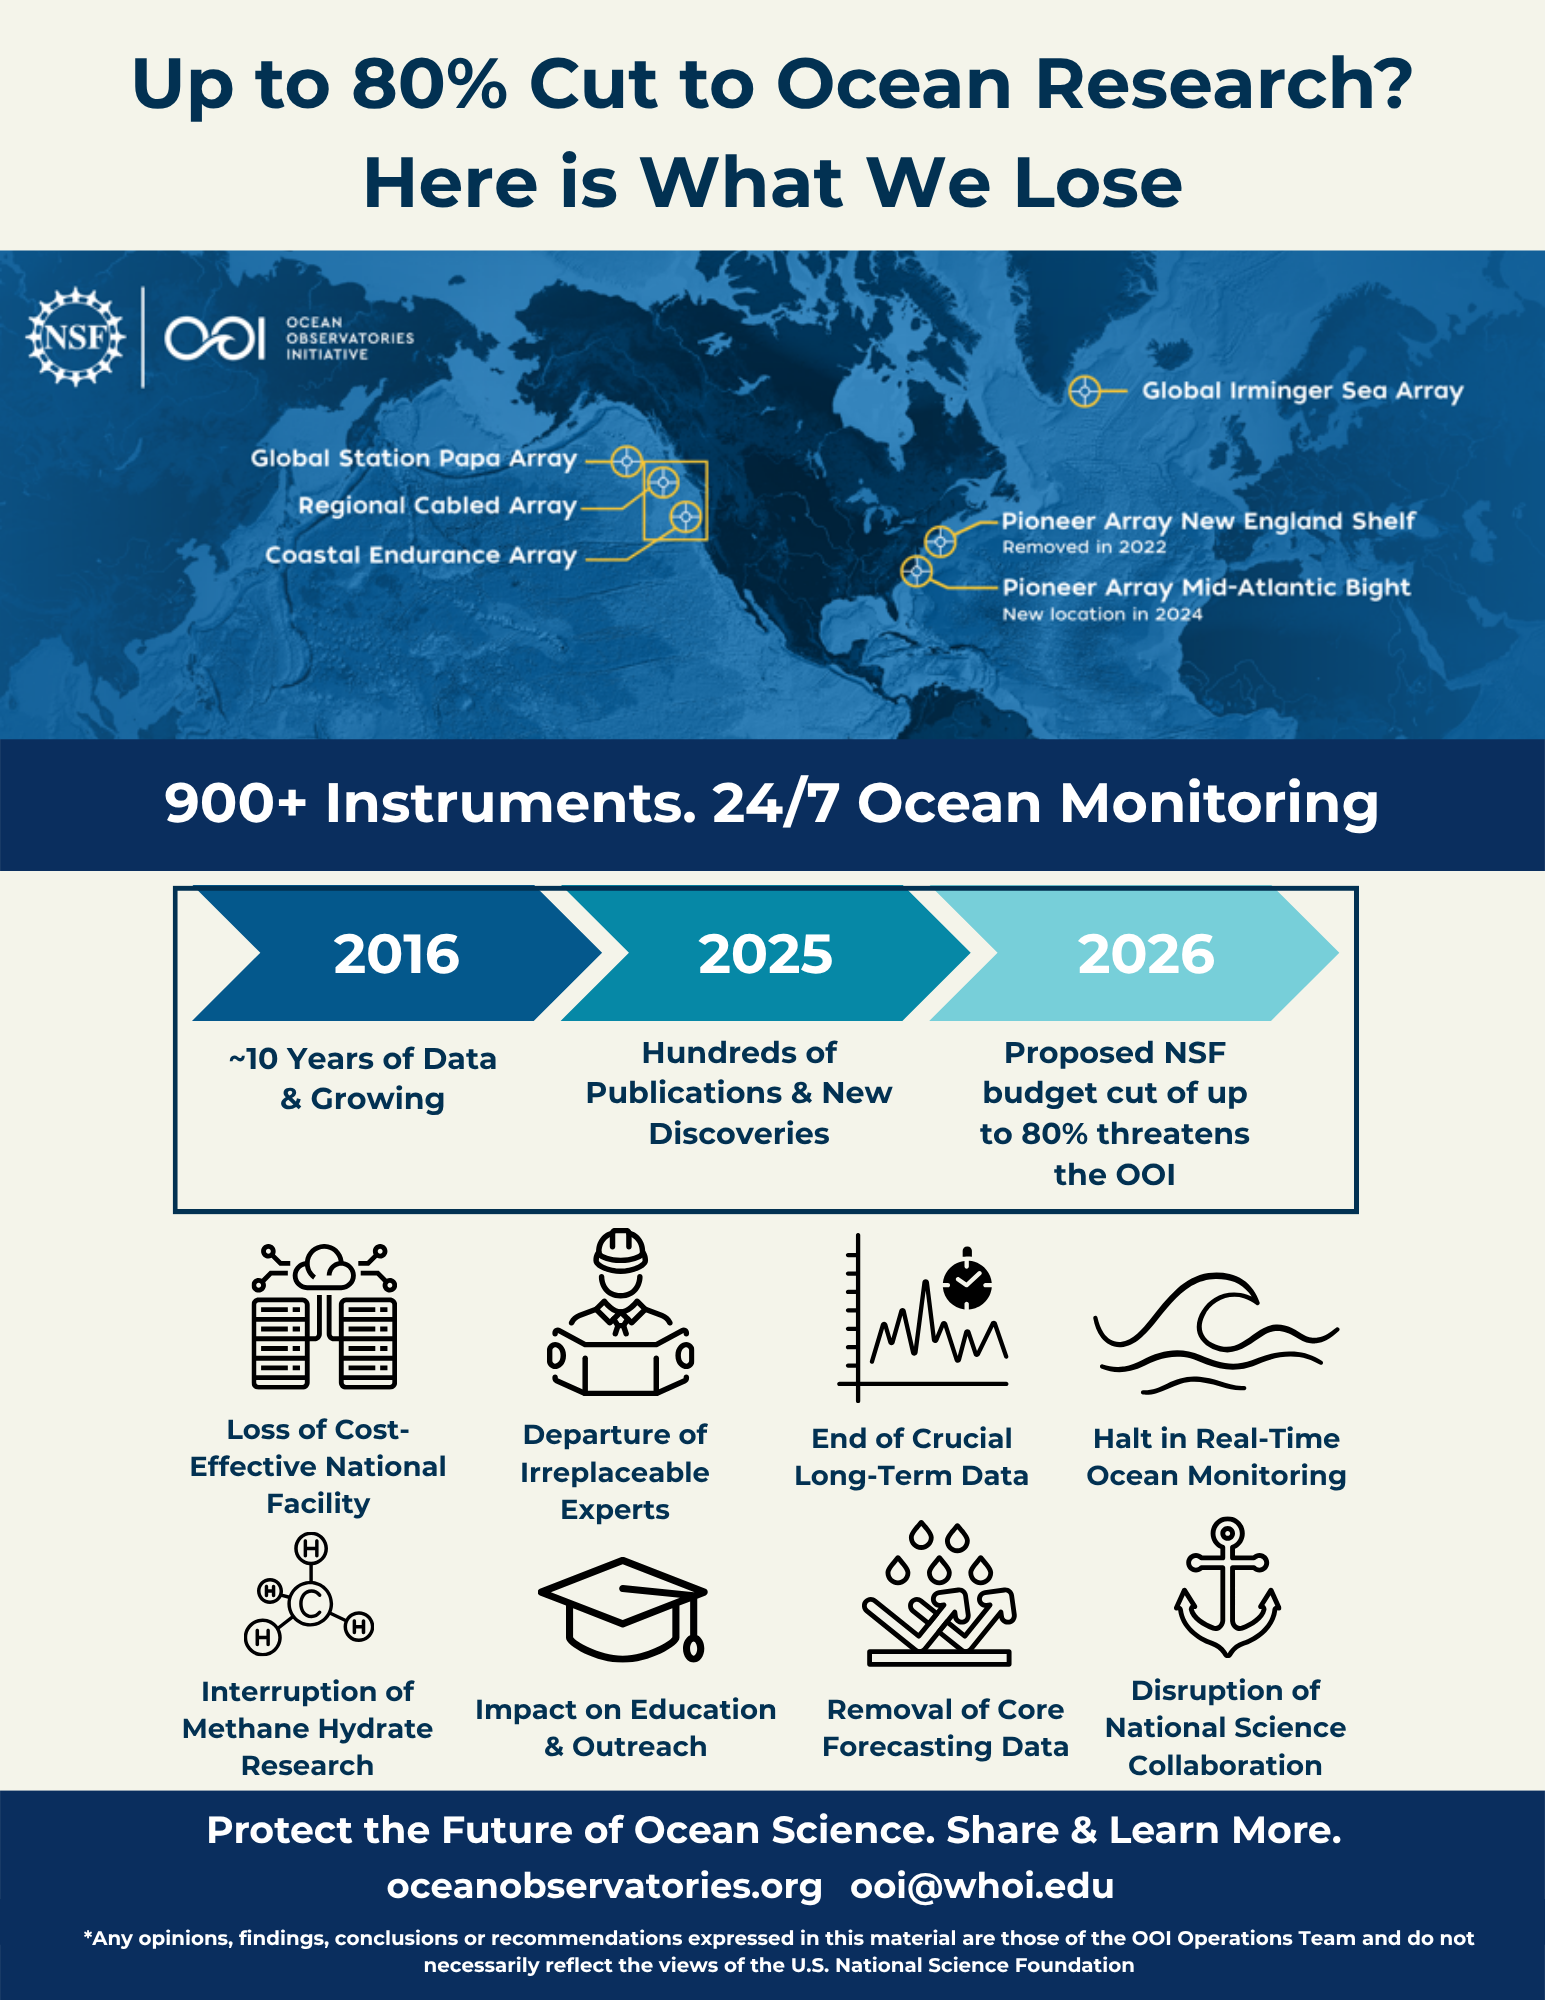
The U.S. National Science Foundation Ocean Observatories Initiative (OOI) coastal and blue water arrays comprise the most technologically-advanced observational networks in the oceans, with a planned 30-year operational lifespan. A decade of successful operation has resulted in hundreds of scientific publications and myriad new discoveries about our oceans and the life that they host. In 2016, the National Science Foundation (NSF) opened the doors for outside researchers and industry to add instrumentation to the arrays, resulting in over $70M of external funding from NSF, the Office of Naval Research, NASA, Europe and tens of millions of dollars for additional field campaigns placed within the rich environmental data the arrays provide. The unique long-term and high-density data sets form the foundation for advanced data mining and generation of new AI models advancing our understanding of dynamic ocean processes.
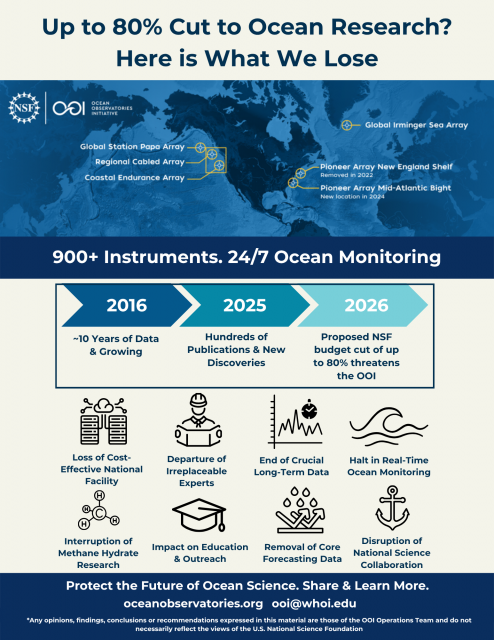
The NSF’s Fiscal Year 2026 (FY26) budget request reduces funding for OOI by 80% in its tenth year. The OOI consists of five ocean-based observatories located off the coast of North Carolina, in the Gulf of Alaska, off the coast of Greenland, the Cascadia Margin and Juan de Fuca Ridge off Oregon, and coastal Washington. Together, they deliver continuous, real-time meteorological, biological, oceanographic, and geophysical data from more than 900 instruments. This infrastructure is deployed, operated, and maintained by expert teams of researchers managing cabled, moored, and mobile systems, including underwater gliders, remotely operated vehicles (ROVs), autonomous vehicles, and a sophisticated cyberinfrastructure platform for data delivery. The scientific and research impacts of losing OOI would include:
- Eliminating a cost-effective national facility designed and managed to deliver high-quality geological, ocean, and atmosphere data to a broad community of stakeholders.
- Significant loss of world-class engineers and subject matter experts whose skills and knowledge will not be recoverable for years.
- Terminating long-term time series essential for detecting atmospheric, biological, and oceanographic trends that inform policy, risk assessments, and decision-making.
- Ceasing real-time environmental monitoring of ocean temperature, salinity, and circulation events critical to commercial fisheries; ecosystem changes and their impact on ocean biology.
- Suspension of measurements critical to quantify process linkages in methane hydrate environments forming immense energy reservoirs and designated as essential fish habitats.
- Removal of core data used to update and verify ocean and meteorological models forecasting weather, predicting ocean circulation, and supporting coastal planning and ecosystem management.
- Disruption of support for validation of NASA satellite systems (PACE, SWOT) and oceanographic characterization for Navy maritime domain awareness, research, and modeling.
- Ending OOI’s outreach activities focused on responding to scientific and academic priorities as defined by the community.
- Suspension of the source of critical data sets used by undergraduate and graduate programs developing the next generation of ocean scientists and engineers.
The proposed 80% reduction within the FY26 budget not only represents the loss of $800 million supporting the next 20 years of OOI publicly available data, but also the associated funding of the marine industries and institutions that support it. The loss of OOI would have cascading effects across the research, academic, and maritime sectors:
- Approximately 100 professionals at the Woods Hole Oceanographic Institution in Massachusetts, Oregon State University, and the University of Washington support core OOI operations.
- Roughly half of the OOI budget supports vendors, suppliers, and services in many states including Massachusetts, Rhode Island, Oregon, Washington, Montana, South Carolina, California, and Texas.
- The potential abandonment of ~$205 million of taxpayer-funded specialized infrastructure, sensors, and vehicles
- OOI serves as a national test bed for technical advancements in sensors, vehicles, power generation, and communications, including collaborations with industry and other governmental agencies such as the ONR, Department of Energy and the Bureau of Ocean Energy Management.
- OOI drives over 150 days of vessel operations each year on research, fishing, and commercial charter vessels from Massachusetts, Rhode Island, Virginia, North Carolina, Oregon, Washington, California, and Alaska.
Sincerely,
The OOI Operations Team
For information about the observatory and the ongoing work, please visit: https://oceanobservatories.org/
For further information or questions, please contact OOI using one of the following methods: https://oceanobservatories.org/contact-us/ or ooiprogram@whoi.edu
Disclaimer: Any opinions, findings, and conclusions or recommendations expressed in this material are those of the authors and do not necessarily reflect the views of the U.S. National Science Foundation.
CC-CREW Students Tour OOI’s LOSOS Facility at WHOI
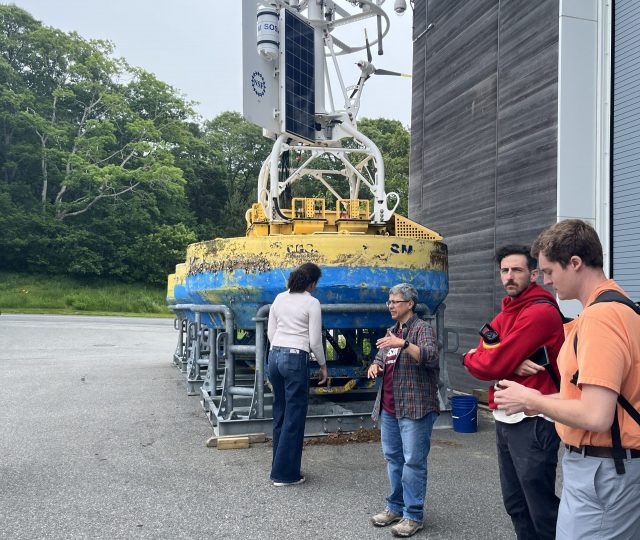
Last week, OOI hosted a group of students from the Community College Comprehensive Research Experience at WHOI (CC-CREW) for a tour of the Lab for Ocean Sensors and Observing Systems (LOSOS). The visit provided students with an up-close look at OOI equipment, including oceanographic sensors and mooring components, and included discussions about career paths in ocean science and technology.
CC-CREW is a 9-week paid summer program designed to introduce local community college students to STEM pathways (particularly in ocean science and geoscience) through immersive research experiences and facility tours at WHOI. The program also supports students in planning their transition from community college to four-year institutions and how to navigate educational opportunities that lead to careers in STEM and related fields.
Originally created to broaden participation in the geosciences, CC-CREW also serves a critical role in strengthening the local workforce. Many students in the program are passionate about pursuing careers that keep them rooted in the region, and tours like this one at OOI highlight the kinds of impactful, local career paths available in marine science and engineering.
[caption id="attachment_36707" align="alignnone" width="640"] WHOI Principal Engineer Sheri White (center) describes the design and purpose of the instrumented surface buoys (background) used in the OOI Program. Photo courtesy of CC-CREW[/caption]
[caption id="attachment_36708" align="alignnone" width="480"] WHOI Senior Engineering Assistant Diana Wickman (right) describes the capabilities of OOI ocean gliders. Photo courtesy of CC-CREW[/caption]
For more information on OOI ocean gliders click here.
Read MoreEnhancing Infrastructure Usability: Updates to the OOI Platforms and Nodes Page
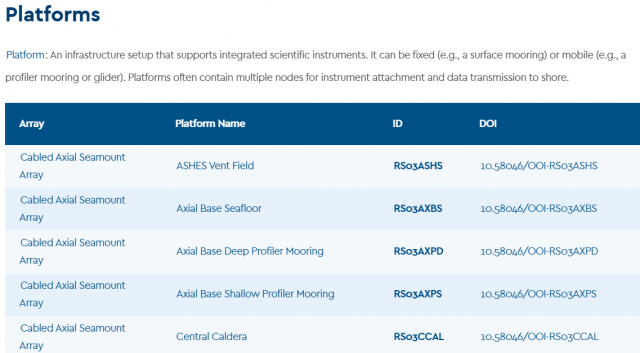
OOI has implemented a series of significant updates to its Platforms and Nodes webpage, aimed at improving sensor usage traceability, infrastructure identification, and research reproducibility. These enhancements directly support the scientific community’s need for clear, accessible metadata and a more streamline connection between OOI platforms and the data they produce.
The updated Platforms and Nodes List provides a complete and structured inventory of all deployed infrastructure across the OOI’s Coastal, Global, and Cabled arrays. Each array name links to a comprehensive description of its design, geographic focus, and research themes. Individual platforms are now associated with dedicated landing pages that correspond to their official Digital Object Identifiers (DOIs) which establishes a clear and citable connection between physical infrastructure and the data it generates.
These platform-specific landing pages serve as centralized reference hub for each infrastructure component. They include standardized citation guidance to support accurate attribution, direct access to relevant datasets and data portals, and detailed descriptions that place each platform in scientific and operational context. Each page also features a complete list of associated instruments, with links directing users to either the OOI Data Explorer or the appropriate data access interface, facilitating efficient navigation to raw and derived data streams.
These updates provide researchers with a more cohesive and transparent framework for data discovery and usage. By enabling precise cross-referencing of platforms, instruments, and datasets, the new infrastructure makes it easier to do many types of scientific research, including tracking changes over time, checking models against in situ data, studying specific ocean processes across platforms, and combining data from different platforms for more in-depth analysis.
The improvements reflect OOI’s ongoing commitment to making its data and infrastructure more FAIR (Findable, Accessible, Interoperable, and Reusable). By reinforcing the connection between deployed equipment and accessible data products, this update enhances reproducibility and strengthens the integrity of research conducted using OOI assets.
Researchers are encouraged to explore the updated Platforms and Nodes page and incorporate these resources into their data workflows, citation practices, and project planning. These tools aim to simplify the process of finding data while also enabling more detailed and meaningful research using OOI’s distributed network of ocean observing systems.
Read MoreNSF CI Compass: OOI Data Delivery User Experience
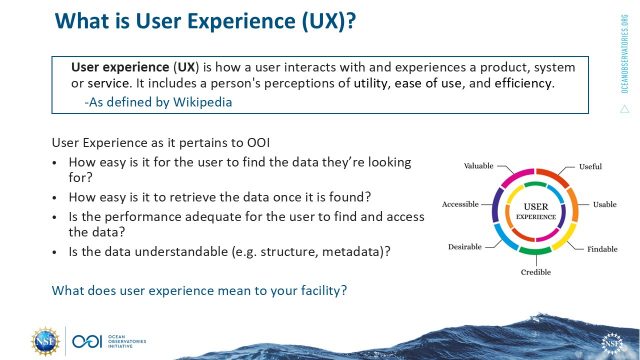
During a recent NSF CI Compass webinar, Jeffrey Glatstein, OOI Senior Manager of Cyberinfrastructure at WHOI, gave an inside look at how OOI has been rethinking and improving its approach to data delivery. His talk, “Data Delivery User Experience: Is it important to your facility?”, explored how the team has been working to make OOI’s massive data sets more accessible and usable for researchers and stakeholders.
Jeff oversees data systems that handle real-time streams from 900 instruments spread across 80 platforms. Altogether, OOI manages over 175 billion rows of data, 2.8 petabytes of raw data, and more than 13,000 hours of video. Jeff’s team is responsible for ensuring it remains readily accessible and usable by the research community.
Before the overhaul, users relied on a legacy portal called OOINET. While it provided basic functionality, it wasn’t always user-friendly. Users frequently cited long wait times, confusing interfaces, and difficulty locating specific data. These challenges sparked a full-scale effort, beginning in 2018, to improve the user experience from the ground up.
The approach placed strong emphasis on the user experience. Jeff and his team conducted interviews, reviewed previous feedback, and dug into system analytics to identify areas needing improvement. They looked at a range of technical solutions before ultimately partnering with Axiom Data Science to implement a new data access platform – what we now know as the OOI Data Explorer.
The webinar highlighted some of the major tech upgrades involved: Kafka for better message streaming, JupyterHub for advanced data access, Grafana for monitoring, and ERDDAP to improve data delivery. But what really set the project apart was its focus on making things easier and faster for users. Instead of relying only on on-demand plots, the new Data Explorer offers pre-generated visualizations and quicker access to datasets. Search tools were also upgraded, making it easier for users to find exactly what they’re looking for.
Scientists are now able to submit more precise queries, navigate the system with greater confidence, and achieve more effective search results. Jeff noted that the team remains focused on further enhancing the interface, broadening search capabilities, and streamlining the data download process to ensure an even better user experience.
Although Data Explorer has already delivered significant improvements, Jeff emphasized that OOI remains committed to continually enhancing overall functionality. These ongoing efforts reflect a broader mission: ensuring that the vast and valuable data collected from the ocean is not only accessible but also readily usable by the scientific community.
[caption id="attachment_36634" align="alignnone" width="640"] Credit: Jeffrey Glatstein[/caption]
[caption id="attachment_36637" align="alignnone" width="640"] Credit: Jeffrey Glatstein[/caption]
Read More
Credit: Jeffrey Glatstein[/caption]
Read More Why OOI Matters on World Oceans Day
Dear OOI Community,
Today, on World Oceans Day, we join scientists, educators, policymakers, and citizens around the globe to recognize the ocean’s critical role in sustaining life on Earth. From regulating climate to supporting biodiversity, the ocean is at the heart of our planet’s health and understanding it has never been more urgent.
That’s where the Ocean Observatories Initiative (OOI) comes into play.
For over a decade, OOI has enabled transformative ocean science by delivering open, continuous, research-quality data from some of the most dynamic and remote marine environments. Our coastal, global, and cabled arrays provide essential data that fuels research on everything from climate variability to marine heatwaves, earthquakes, ocean acidification, and more. OOI data supports students in classrooms, early-career researchers, seasoned scientists, and international partners.
But this World Oceans Day arrives with a tremendous amount of uncertainty.
As you may know, the President’s FY2026 budget request for the National Science Foundation (NSF) proposes severe cuts to OOI funding, up to 80%, along with language signaling possible decommissioning. These cuts would effectively end our ability to deploy sensors, maintain arrays, and collect new data. It would mark a significant loss for the ocean science community, especially at a time when sustained ocean observations are more important than ever.
Despite these challenges, our mission remains clear: support ocean discovery, empower data-driven research, and serve the broader public good. We continue to carry out fieldwork and deliver data that advances science every day.
On this World Oceans Day, we invite you to explore OOI data, share your stories of how you use it, and help us raise awareness by using #OOIDataMatters on social media. Let’s reaffirm why long-term ocean observation is a public investment that’s worth protecting.
Thank you for being part of this community. We will share updates as new information becomes available.
With appreciation,
Jim Edson
Read MoreAdvancing Mooring Technology for Long-Term Ocean Observation
Advances in oceanographic mooring technology are critical to sustaining long-term, high-quality observations in some of the planet’s harshest environments. Moorings must now operate reliably over extended deployments, support increasingly sophisticated instrumentation, and withstand the growing impacts of extreme weather. To better understand recent progress and ongoing challenges in this field, we spoke with Alex Franks, Research Engineer at Woods Hole Oceanographic Institution (WHOI) and a key contributor to the Ocean Observatories Initiative (OOI).
Over the past three years, Franks and his team have introduced significant upgrades to OOI infrastructure – most notably enhancements in satellite telemetry, power generation and management systems, and the structural resilience of both surface and subsurface moorings. These improvements aim not only to extend deployment lifetimes and reduce maintenance needs but also to expand the scientific capabilities of moorings by accommodating higher-bandwidth data streams and more energy-intensive instruments.
This Q&A offers a detailed look at the evolving strategies behind mooring system engineering and the practical steps being taken to meet both scientific demands and environmental challenges.
- In the last 3 years, what have been the most notable improvements in remotely diagnosing and fixing mooring issues?
The biggest upgrade we’ve implemented recently is a new satellite telemetry module called the “Stream +” (Stream Plus). This allows us to communicate with the buoys in a faster and more streamlined manner. I would compare the upgrade being the difference between dialup and high-speed internet. This unit was originally tested on the Irminger Sea Surface Mooring deployed in 2024 and has now been deployed at the Pioneer Array on the Central Surface Mooring and one of the Profiler Moorings. With this increased ability to troubleshoot and interact, we are able to support high bandwidth instrumentation like the Mclane IFCB (Imaging Flow Cytobot) which takes pictures of phytoplankton in real time. We are able to download a subset of the images and adjust camera focus remotely now. OOI can now also accommodate proposals for more high bandwidth instrumentation on the buoy systems.
- What new features are you currently developing to further improve mooring system reliability?
The OOI Electrical Engineering group is currently focusing on reducing power consumption and increasing reliability of power generation systems on the Surface Moorings. Several systems are being optimized including individual instrument power supplies and Surface Mooring seabed-located multifunction node (MFN) power transmission. We are also upgrading the solar panels to harvest even more energy from the sun during long deployments. Lastly, the wind turbines on the Surface Moorings have been further ruggedized to help withstand the 20-meter waves and hurricane force winds that we observe at our global sites. A test of that redesign is underway at the Pioneer Array. All of these optimizations and upgrades will result in a mooring that can accommodate new power-hungry instrumentation, exceed our current sampling scheme, and withstand doldrums or high latitude winter with little to no solar generation.
At OOI we are also starting to think about more onboard computing power, more data storage, and more expandability in terms of available ports for new instrumentation. We always have our eye on streamlining our current electronics.
- Looking ahead, what do you see as the next major breakthrough in mooring technology?
I’m looking forward to testing solid state batteries as they are developed for use on mooring systems. The benefits of lithium with less safety concerns are very interesting to me. Losing battery weight and gaining more usable energy storage is a very attractive prospect.
- Are there any upcoming field tests or deployments that you’re particularly excited about?
OOI is partnering with Sandia Labs and the Department of Energy to develop and deploy a prototype of a wave energy converter on the Central Surface Mooring in fall of 2025. This device will be situated inside the buoy and convert wave motion into mooring power as proof of concept. This project has been going on for a few years now and it’s very rewarding to see it coming to fruition.
Advancements in mooring technology are directly improving data quality, reliability, and access for long-term ocean observations.
To explore available datasets and learn more about current system capabilities, visit oceanobservatories.org.
[caption id="attachment_36486" align="alignnone" width="320"] Compass characterization procedure at the LOSOS building. Pictured: Alex Franks, WHOI[/caption]
Read More
Compass characterization procedure at the LOSOS building. Pictured: Alex Franks, WHOI[/caption]
Read More Open Access, Open Ocean: Marking 75 Years of NSF Through Sustained Ocean Observation
This week, the OOI joins the scientific community in celebrating the 75th anniversary of the U.S. National Science Foundation (NSF). This milestone marks decades of national investment in science, innovation, and public benefit.
OOI exists because of NSF’s vision and support. Our mission, delivering long-term, openly accessible ocean data, reflects a shared commitment to expanding scientific knowledge and ensuring that access to that knowledge is equitable, inclusive, and available to all.
Open Access Data: A Shared Commitment
The NSF’s mission is rooted in the belief that the progress of science should benefit all and be free from barriers to participation. OOI carries this forward through its core function: providing open access to high-resolution oceanographic data collected from some of the most remote and dynamic regions of the ocean.
OOI’s infrastructure, which spans cabled, coastal, and global sites, captures continuous, multi-dimensional data on key ocean processes. This data, ranging from temperature and salinity to seafloor seismic activity, is made freely available in near real time to anyone: scientists, educators, students, and the public.
For both OOI and NSF, access to data isn’t just a technical feature, it’s a fundamental value. Transparency, inclusivity, and public benefit are central to how we operate.
Investing in Infrastructure
NSF invests in strengthening the nation’s ability to conduct research and turn scientific insights into benefits for society. OOI supports this by maintaining a robust, continuously operating network of ocean sensors and platforms. This infrastructure enables:
- Collaborative research across institutions and disciplines
- Technology testing and innovation in extreme marine environments
- Educational engagement using real-world datasets
- Data-driven decision-making on ocean and climate issues
OOI’s open access model makes it possible for anyone, from seasoned scientists to high school students, to use ocean data to ask questions and find answers.
A Model for Public Science
In a time when access to credible, timely data is more important than ever, OOI’s approach serves as a model for how federally funded science can empower public knowledge and innovation. By making data easier to access and use, we help to ensure that science reaches more people and that the benefits of NSF-funded research are shared more broadly.
Looking Ahead: Sustaining Discovery
As the NSF celebrates 75 years, we acknowledge its enduring contributions to scientific advancement and public understanding. Its support for open, collaborative research continues to play a crucial role in driving discovery and responding to the evolving questions shaping science today.
With the continued support of the NSF, OOI is honored to play a role in this shared mission. We remain committed to advancing ocean science, making ocean data widely accessible, and deepening understanding of the ocean’s impact on our planet.
Read More