
Multi-span distributed fiber sensing on the Ocean Observatories Initiative Regional Cabled Array
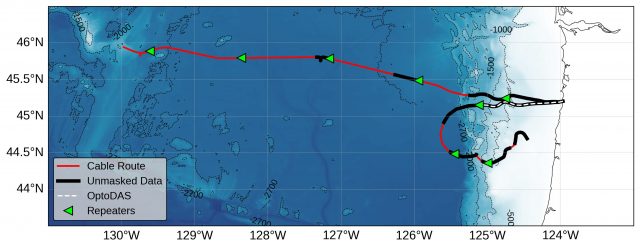
For 3 months beginning in November 2025, a team of scientists at the University of Washington comprising William Wilcock, Brad Lipovsky, Marine Denolle and Shima Abadi collaborated with Mikael Mazur and Nicolas Fontaine at Nokia Bell Labs to conduct a test of a novel multi-span distributed acoustic sensing (DAS) technique on the two submarine cables of the OOI Regional Cabled Array (RCA) extending off Pacific City, Oregon. DAS uses backscattered light to measure strain along a fiber with a spatial resolution of meters, creating a dataset that allows for diverse observations of submarine phenomena including earthquakes, ocean waves, and marine mammals. Previous DAS experiments on the OOI tested conventional DAS instruments to collect data over only the first portion of the cables before the first optical repeater, out to ~65 km on the northern cable and ~95 km on the southern cable. The DAS system tested in this experiment, provided by Nokia Bell Labs, uses the high-loss loopback couplers within optical repeaters to extend DAS measurements beyond repeaters to the entirety of a given seafloor cable (see Mazur et al., 2025). The northern OOI cable has a length of ~480 km and runs roughly perpendicular to shore, across the Juan de Fuca plate out to Axial Seamount. The southern RCA cable has a length of ~350 km and runs southward across the continental shelf, crossing onto the Juan de Fuca plate before looping eastward back towards shore.
On November 5 2025, the Nokia multispan DAS system was deployed on both the north and south cables of the RCA. Each of the RCA cables has two optical fibers, the transmit and receive fibers for the observatory data. The Nokia multispan DAS system sends light down the transmit fiber and receives backscattered light from each optical repeater via the receive fiber. The system was multiplexed such that data could be collected while the RCA continued operating. Data were collected continuously using this system until January 28 2026, with outages from November 12-18, December 8-9, and December 17-23. The spatial and temporal sampling rates were periodically varied, with channel spacing varying between 10-200 m.
Upon initial testing, it became clear that significant nonlinearities within the RCA fibers and an observatory-related synchronization signal on the fibers of both cables was distorting the data collection via strong crossphase modulation. These combined effects mean that significant portions of the cable did not record physically accurate data. Following investigation of these effects, starting on December 2, a spatial mask was applied to the data from both cables to limit the available data to only the portions that were minimally affected by the observatory noise. This spatial masking results in 165 km and 275 km of the northern and southern cable spans being saved, out to 300 km and 350 km maximum distance along the cable, respectively. These unmasked data includes portions beyond three repeaters on each cable. The spatially masked data still contains some non-physical noise, and should be treated with caution. Further investigation into the characteristics of this noise are ongoing and updates will be made to the documentation moving forward. Data post-processing also revealed that, due to latency in the processing chain, the absolute timestamps associated with the data are delayed (behind real-time) by several seconds. Details on this absolute timing delay can be found in the Github documentation.
To facilitate comparison between the Nokia multispan DAS system and conventional DAS interrogators, the first span of the southern cable (out to ~95 km) was also instrumented using an OptoDAS interrogator from Alcatel Subsea Networks. The system was multiplexed such that data could be collected while the observatory continued operating. OptoDAS data were collected continuously from November 12 2025 to January 28 2026, with an outage from November 27 to December 5. The spatial and temporal sampling rates were varied periodically. Please note that the OptoDAS interrogator experienced significant calibration problems during this experiment, and therefore did not always record data consistent with the 2024 OOI experiment. Data with 40 m gauge length appears to have the highest quality. More details can be found in the Github documentation.
Low sample rate (~8 Hz) data from the experiment is now available.The Nokia multispan DAS data for both cables is available as binary files that contain both data arrays and metadata, with a total dataset size of 3.9 TB. The OptoDAS data for the south cable is available as hdf5 files, with a total dataset size of 1.2 TB. Information on how to read the data, specific data availability times, changes in acquisition parameters, the spatial mask for the Nokia system, and timing offsets on the Nokia system can be found at Github.
DOI and Citation Guidance
The data has separate DOIs for the multi-span and OptoDAS data.
Please cite the multi-span data as:
Mazur, M., Fontaine, N., Krauss, Z., & Wilcock, W. (2026). Multi-span distributed acoustic sensing (DAS) on the Ocean Observatories Initiative Regional Cabled Array 2025-2026: Nokia Bell Labs Multi-span Data [Data set]. Zenodo. https://doi.org/10.5281/zenodo.19930402
Dienstfrey, W., Lipovsky, B., Wilcock, W., & Krauss, Z. (2026). Multi-span distributed acoustic sensing (DAS) on the Ocean Observatories Initiative Regional Cabled Array 2025-2026: OptoDAS data [Data set]. Zenodo. https://doi.org/10.5281/zenodo.19930457
Update on RCA Broadband Hydrophone Data Availability, File Formats, and Directory Structure
As part of continuing OOI data process improvements, the RCA Data and OOI Software Development Teams have been working closely to expand data availability and improve data file consistency for six Broadband Hydrophones (HYDBBs) located at Axial Base (2), Slope Base (2), and Oregon Offshore (1) and Shelf (1) sites. Additional details are available on these study sites and instruments at these links.
A system update will go live at 17:00 UTC June 7, 2023 and will affect all HYDBB data posted on the Raw Data Archive server after that date. In the near future, the updates will also be applied to historical HYDBB files previously posted on the Raw Data.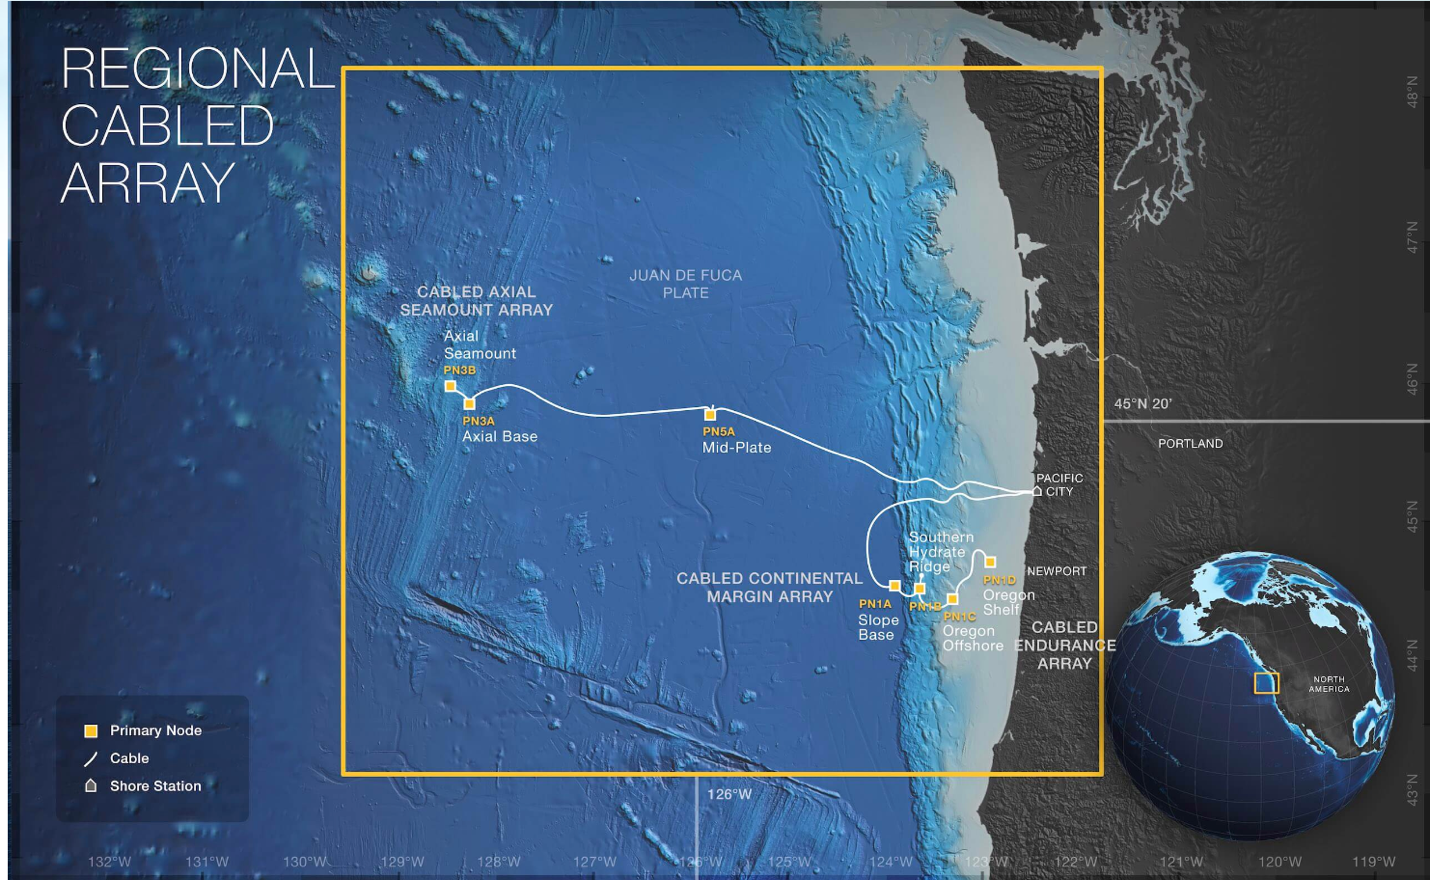
OOI HYDBB data are currently provided to the public on the OOI Raw Data Archive server as MiniSEED-formatted files (extension “.mseed”). This lossless, compressed format is a subset of the Standard for the Exchange of Earthquake Data (SEED) that is in extensive use for archiving and serving seismological data (see IRIS). The HYDBB MiniSEED files are served on the Raw Data Archive in daily subdirectories organized by year and month for each of the sites:
- Axial Seamount – Axial Base
- Continental Margin – Slope Base
- Continental Margin – Oregon Offshore
- Continental Margin – Oregon Shelf
Once the system update goes live on June 7, all HYDBB data posted on the Raw Data Archive server after this date will have the following enhancements:
- Currently, only HYDBB data arriving at the OOI data repository in near real-time are provided to the public in the daily subdirectories, updated at nominal 5-min intervals. After the system update, data arriving at the OOI repository after Navy review will also be made available on the Raw Data Archive. These delayed and previously publicly unavailable data will be provided as analogously named MiniSEED datafiles but in separate subdirectories named “addendum” under each daily directory.
- Each individual MiniSEED file will include HYDBB data over fixed 5 min timespans, starting at 00:00 UTC and repeated at subsequent 5 min intervals (beginning at 00:05, 00:10 UTC, etc.). If no data are available for a specific 5 min timespan, the datafile will not be created. Any gaps in the data stream during each 5 min timespan are accounted for by the use of the multi-trace extension of the MiniSEED file format construct, which allows multiple temporal segments within a single file. Previously, each HYDBB file on the Raw Data Archive contained only a single continuous trace of data. An example Python toolbox for accessing/processing such MiniSEED data is available, with additional information on the ObsPy open-source project here.
This change in file construction will allow for more efficient access and delivery of HYDBB data, particularly when there are small and frequent gaps in the data streams which can lead to excessive file fragmentation, as was often the case with these data before this system update.
If you have any questions, please contact the OOI HelpDesk or post your question on the public OOI Discourse Forum.
Read More
Improving Reliability and Availability of Dissolved Oxygen Glider Data
OOI’s Coastal Endurance Array Team is making great strides in ensuring the accuracy of glider dissolved oxygen measurements and making these data readily available to researchers. The team has compared glider oxygen data with independent transects and climatologies compiled by west coast colleagues. They are increasing the number of in situ comparisons of glider oxygen data with bottle samples taken in proximity to the gliders. They have built a benchtop system to do two-point calibrations for oxygen sensors to help ensure their accuracy when the gliders are in the water. And, working with OOI colleagues at WHOI, the team is helping to design and test improved sensor mounts to perform in situ air calibrations of glider oxygen measurements.
“A couple of years ago, Endurance Glider Lead Stuart Pearce developed code to put all of the oxygen data collected by our glider fleet into the DAC, the national central database for glider data,” said Ed Dever, Principal Investigator of the Coastal Endurance Array and Professor at Oregon State University. “Prior to doing this, Stuart examined the data and metadata for any gross errors and issues. That was the first of many steps we have taken to ensure OOI oxygen data are reliable and available so they can be trusted and used by researchers. Our effort is paying off. The glider data available on the DAC are identical to that now available on OOI’s Data Explorer. Endurance glider lines off Newport, OR and Grays Harbor, WA will be the backbone for the northern Californian Current part of the nascent Boundary Ocean Observing Network. The OOI glider lines map seasonal development of hypoxic areas off Oregon and Washington from the coast to the edge of the continental shelf.”
[media-caption path="/wp-content/uploads/2022/11/glider.png" link="#"]More than 137 glider missions have occurred along the Newport and Grays Harbor lines since 2014. Credit: Coastal Endurance Array at OSU.[/media-caption]
Collaborations
Enough oxygen data has been collected and shared in the northeast Pacific that is now possible to make high resolution regional climatologies of temperature, salinity and oxygen. Risien et al. (2022) compiled ~20 years of data taken by Jennifer Fisher (NOAA) and many others, to develop analysis ready transects of water property data off Newport, Oregon. These datasets include both climatologies and individual interpolated, quality-controlled, transect data. The Endurance Team compared glider dissolved oxygen with shipboard CTD samples collected by Fisher along the Newport transect in July 2021. Oxygen measurements from the gliders and CTDs samples compared well and provided confidence that glider and shipboard transects can map hypoxic conditions at comparable resolution and accuracy. Added Dever, “We were able to do a side-by-side comparison of the temperature, salinity, and oxygen data collected by the gliders over our Newport hydrographic line with the CTD data sampled by the Fisher’s team using the R/V Elakha. The comparison was quite good and served to validate the quality of the glider data that are an integral part of the Endurance Array.”
Engineering Solutions
A couple years ago, team member Jonathan Whitefield worked with Scripps Institution for Oceanography to build an oxygen Winkler titration rig so the team can titrate its own oxygen samples. The system can be used both in the lab and onboard to validate glider and moored oxygen data. The titration rig has been used to increase the number bottle samples taken during glider deployments and recoveries and to reduce the time between sample acquisition and analysis.
Building on this, Whitefield and others recently assembled in-house two-point calibration baths for pre- and post deployment of oxygen data collected by gliders and moorings. Calibrations are performed at anoxic and near-saturated conditions. The two-point calibration system is based on a similar one used at Scripps Institution for Oceanography (López-García, P., et al., 2022). A sodium sulfite solution is injected into bottle samples to get the low endpoint oxygen calibration point. The high endpoint oxygen calibration point is achieved using a stirred bath at 10°C to get to near saturation. The high endpoint oxygen is measured with replicate Winkler titrations. The calibration baths better ensure accuracy by making it possible to perform routine in-house checks of vendor calibrations on glider and moored sensors as well as identify calibration drift after deployment.
What’s ahead
Oxygen data are reviewed weekly by operators and annotated. Real-time automated quality control using QARTOD tests is in development. In-situ air calibration tests of oxygen optodes are planned for spring 2023. At the suggestion of outside investigators, OOI’s Coastal and Global Scale Node team at Woods Hole Oceanographic Institution modified Slocum glider optode mounts to allow in-situ air calibrations of dissolved oxygen on the Irminger Sea and Pioneer Arrays. The mount, however, affected the flow around gliders with radome fins and caused navigation problems. Modeling done at WHOI showed these problems may be due to vortices of the optode on the starboard side of the fin. The Endurance gliders will test a new mount placement during its upcoming bi-annual operations and maintenance cruise in March of 2023.
“We’re part of the community of practice for glider oxygen calibration and validation,” said Dever. “We engage with colleagues, adopt standard practices and widely share data. This community of users will help all of us get a better handle on ongoing changes in our ocean regions.”
References
Risien et al. (2022) Spatially gridded cross-shelf hydrographic sections and monthly climatologies from shipboard survey data collected along the Newport Hydrographic Line, 1997–2021, https://doi.org/10.1016/j.dib.2022.107922
López-García, et al. (2022) Ocean Gliders Oxygen SOP, Version 1.0.0. Ocean Gliders, 55pp. DOI: http://dx.doi.org/10.25607/OBP-1756. (GitHub Repository, Ocean Gliders Oxygen SOP.
Read More
OOI Launches QARTOD
WHAT IS QARTOD?
As part of the ongoing OOI effort to improve data quality, OOI is implementing the Quality Assurance of Real-Time Oceanographic Data (QARTOD) on an instrument-by-instrument basis. Led by the United States Integrated Ocean Observing System (U.S. IOOS), the QARTOD effort draws on the broad oceanographic observing community to provide manuals for different instrument classes (e.g. salinity, pH, or waves), which outline best practices and identify tests for evaluating data quality. A common code-base is available on GitHub and actively maintained by IOOS partner Axiom Data Science.
OOI has committed to implementing available QARTOD tests where appropriate. QARTOD is well-documented and actively maintained with an engaged user-base across multiple data collection and repository programs. It has a publicly available code-base with standardized tests and flag definitions that result in simplified, easy-to-interpret results. However, some instruments deployed by OOI, such as seismic sensors, hydrophones, and multispectral sensors, are not well-suited towards QARTOD. For instruments for which there is no existing QARTOD manual, such as seawater pCO2, OOI is implementing “QARTOD-like” quality control (QC).
HOW ARE QARTOD RESULTS COMMUNICATED?
QARTOD utilizes a standardized data-flagging scheme, where each data point for an evaluated variable (e.g. salinity) receives one of the following flags: 1 if the data point passed the test and is considered good; 2 if a test was not evaluated; 3 if the data point is either suspect or interesting/unusual; 4 if the data point fails the test; 9 if the data point is missing. Importantly, QARTOD only Flags data, it does not remove data. In fact, OOI is committed to delivering all available data, whether good or bad; the goal is to provide further information on the possible quality of the data. Furthermore, a flag of 3 does not necessarily mean a data point is bad – it could also mean something interesting or unusual occurred that resulted in the given data point being outside of the expected test threshold.
HOW IS QARTOD IMPLEMENTED BY OOI?
OOI is prioritizing implementation of QARTOD on instruments and variables which are shared across arrays and with broad or high scientific interest, such as CTDs, seawater pH and pCO2, dissolved oxygen, and chlorophyll/fluorescence. OOI is currently implementing the gross range and climatology tests (see this article for a more detailed description of the specific implementation). Note that the climatology test is a site-specific seasonally varying range test and not a World Ocean Atlas-like climatology. These two tests, in addition to other tests under development, utilize thresholds and ranges which are calculated from existing OOI datasets. The code used to calculate the thresholds is publicly available at the oceanobservatories ooi-data-explorations github repository and resulting threshold tables are available at the oceanobservatories qc-lookup github repository. The tests executed and results are added to the datasets as variables named _qartod_results and _qartod_executed, with the relevant tested data variable name prepended (e.g. practical_salinity would be practical_salinity_qartod_results and practical_salinity_qartod_executed). The _qartod_executed variable is a list of the individual results of each of the tests applied stored as a string. The tests applied and the order in which they were applied are stored in the variable metadata attributes. The _qartod_results provide a summary result of all the tests applied.
WHAT IS THE CURRENT OOI QARTOD STATUS?
The IOOS QARTOD manuals define the tests for each instrument class as “Required,” “Recommended,” and “Suggested”. The OOI priority will be the “Required” tests for each instrument class in use by OOI. “Recommended” and “Suggested” test development will be reviewed, with the support of subject matter experts, in the future. The IOOS QARTOD manuals can be found at Quality Assurance/Quality Control of Real Time Oceanographic Data – The U.S. Integrated Ocean Observing System (IOOS).
Current tests under development are gross range (GRT) and climatology (CT). The gap test (GT) will follow next. The syntax and location tests are considered operational checks and are handled within OOI operations and management systems. QARTOD test data will be available in specific locations where OOI supplies data, starting with M2M, and then propagated to THREDDS and Data Explorer. The current status of QARTOD test development and availability is shown in Table 1.
[media-caption path="/wp-content/uploads/2022/10/QARTOD-Table-1.png" link="#"]Table 1: Current Status of Development & Availability[/media-caption]
[media-caption path="/wp-content/uploads/2022/10/QARTOD-Figure-1.png" link="#"]Figure 1: QARTOD “Required” Test Development Timeline[/media-caption]
Read MoreData Stream Parameters Simplified to Ease Access

We are in the process of changing the values of data stream parameters to be more Climate and Forecast (CF) compliant and to make the data you are looking for easier to find. For example, the parameter “pressure_depth” has been renamed to simply “pressure.”
The value change process started with pressure_depth and will be ongoing in our attempt to improve access to OOI data for all users. This next round of changes is larger in scope, and changes are documented in file format (excel, .csv) and accessible on the Changes Affecting Data page. Note that the changed values will take effect immediately in the M2M interface while pre-processed staged files will take up to a week to refresh. These updates were released on August 25th at 1:00pm ET.
Should you have any questions about this process or others, please don’t hesitate to reach out to our HelpDesk.
Read MoreTwo Decades of Mooring and Ship-Based Observations from the Newport Hydrographic Line
C.M. Risien, M.R. Fewings, J.L. Fisher, B.T. Cervantes, C.A. Morgan, J.A. Barth, P.M. Kosro, J.O. Peterson, W.T. Peterson, and M.D. Levine
In the Northern California Current System (NCCS), during spring and summer months, equatorward winds drive the upwelling of cold, nutrient-rich, and oxygen-poor waters from depth onto the shelf, fueling a highly productive marine ecosystem that supports valuable commercial fisheries. Oceanographic conditions in the NCCS vary on temporal scales from hours to decades. In contrast, grant-funded research typically consists of shorter-term studies (3-5 years). While such studies resolve intra-annual and perhaps inter-annual variability, they do not capture decadal scale variability that is critical for climate studies.
Risien et al. (2022), present two new decadal-scale data products. The first is ~550 gridded, cross-shelf hydrographic sections of temperature, salinity, potential density, spiciness, and dissolved oxygen from data collected biweekly to monthly from March 1997 to present along the Newport Hydrographic Line (NHL; 44.6°N, 124.1–124.65°W) off Newport, Oregon, USA, mostly by NOAA programs. They also present monthly climatologies derived from these observations.
The second data product is 23 years (1999–2021) of mooring temperature, salinity and velocity data — collected by five programs (OSU-NOPP, GLOBEC, OrCOOS, NANOOS/CMOP, OOI) at NH-10 (44.6°N, 124.3°W), 10 nautical miles west of Newport, Oregon along the NHL — that they stitched together into one coherent, quality-controlled data set (see figure above).
Making available such multi-decadal data sets, which they plan to release via public repositories, is essential to enable scientists to characterize natural and anthropogenically-forced variability; resolve cause-and-effect relationships in Earth’s climate and marine ecosystems at intra-seasonal, seasonal, inter-annual and decadal time scales; and verify climate models. These new gridded and concatenated data products show that long-term ocean observing efforts require multi-generational teams with a wide range of skills and a shared vision that is motivated by science and ocean monitoring needs.
Read MoreEfforts to Standardize Data Continue
The OOI Data Teams have recently made great strides in ongoing efforts to standardize data, making it easier for users to understand what OOI data and metadata are available. Efforts have focused on improving labeling, descriptions, and correcting units to ensure consistency. A major improvement underway is matching variable naming conventions with those governed by Climate and Forecast (CF) metadata standards.
The first round of changes is expected to be completed by the end of June 2022. Once these changes are implemented, existing scripts used to download and process OOI data files could be impacted depending on how the code was written. The Data Teams will publish a list of affected streams and recommended code updates prior to the release of these changes, to highlight the improvements and to allow for processing script modifications.
Read MoreEndurance Array to Provide Hourly Meteorological Data
On 11 October 2021, the National Oceanic and Atmospheric Administration (NOAA)requested that OOI’s Coastal Endurance Array buoys provide hourly meteorological data to the National Data Buoy Center (NDBC) because a nearby NDBC buoy (46029, Columbia River bar) had gone offline. OOI buoy data are typically telemetered every two hours due to sampling schedule and bandwidth constraints (the actual sampling rate is higher).
Endurance Array team members examined sampling and telemetry schedules for the Endurance offshore coastal surface moorings to see if they could accommodate NOAA’s request. The team concluded that meteorological data from the moorings could be updated hourly while still meeting OOI sampling requirements.
“To help ensure continuity of data to the NDBC, we plan to distribute hourly meteorological data from the Endurance Array Oregon and Washington offshore sites for the duration of the outage at NBDC 46029,” said Edward Dever, lead of the Coastal Endurance Team. “We’re pleased to respond to NOAA’s request and hope these data prove useful to operational weather forecasts and marine safety.” The Oregon and Washington offshore sites have NDBC buoys designations of 46098 and 46100, respectively.
The Endurance Array team will continue to review the performance of the buoys and ensure the updated telemetry schedule does not impact OOI sampling. If data users do experience any impacts from this change in sampling frequency, please contact Jon Fram at Jonathan.Fram@oregonstate.edu.
Read MoreJupyter Notebook Produces Quality Flags for pH Data
OOI uses the SAMI2-pH sensor from Sunburst Sensors, LLC to measure seawater pH throughout the different arrays. Assessing the data quality from this instrument is an involved process as there are multiple parameters produced by the instrument that are then used to calculate the seawater pH. These measurements are subject to different sources of error, and those errors can propagate through the calculations to create an erroneous seawater pH value. Based upon the vendor documentation and MATLAB code Sunburst provides to convert the raw measurements, OOI data team members have created a set of rules from those different measurements to flag the pH data as either pass, suspect or fail.
The resulting flags can be used to remove failed data from further analysis. They can also be used to help generate annotations for further Human in the Loop (HITL) QC checks of the data to help refine quality metrics for the data. OOI team member, Chris Wingard (OSU), has written up the QC process as a Python Jupyter notebook. This notebook and other example notebooks are freely available to the scientific community via the OOI GitHub site (within the OOI Data Team Python toolbox accessed from https://oceanobservatories.org/community-tools/ ).
In this notebook, Wingard shows how the quality rules can be used to remove bad pH data from a time series, and how they can be used to then create annotations. The impact of using these flags is shown with a set of before and after plots of the seawater pH as a function of temperature. The quality controlled data can then be used to estimate the seasonal cycle of pH to set climatological quality control flags.
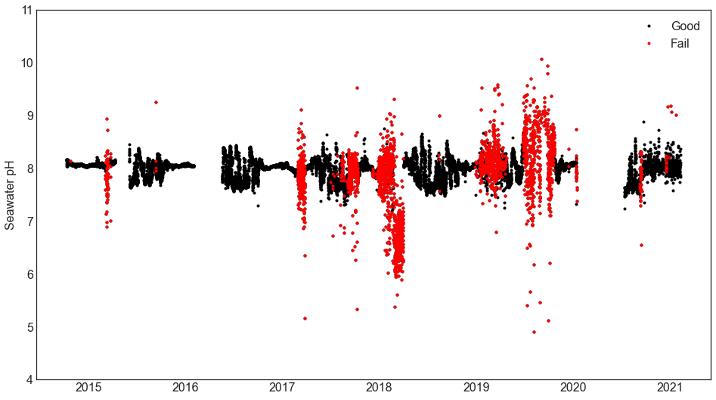
Here an example is shown using data from a pH sensor on the Oregon Inshore Surface Mooring (CE01ISSM) near surface instrument frame (NSIF), deployed at 7 m depth (site depth is 25 m).
[media-caption path="https://oceanobservatories.org/wp-content/uploads/2021/07/EA-Highlight.png" link="#"]Figure 25: pH data from the Oregon Inshore Surface Mooring (CE01ISSM) near surface instrument frame (NSIF). Good data are shown in black, failed data in red. Note that simple range tests on the final calculated pH are often not enough to distinguish good from failed data. The automated QC processing examines intermediate measurements and fails data if intermediate measurements are outside acceptable ranges and propagated to final measurements.[/media-caption] [media-caption path="https://oceanobservatories.org/wp-content/uploads/2021/07/EA-highlight-2.png" link="#"]Figure 26: Good data together with annual cycles (red) constructed with available good data from initial deployment through 2021. Data which falls outside three standard deviations of the climatology is flagged as suspect. The climatological tests are used to flag suspect data. Simple range tests for suspect (cyan) and failed (magenta) data are also shown. The annual cycle at this site is strongly influenced by annual summer upwelling and winter storms and river plumes. The summer decrease in pH is consistent with cold, relatively acidic upwelled water high in CO2 (see e.g., Evans et al., 2011)[/media-caption]
Evans, W., B. Hales, and P. G. Strutton (2011), Seasonal cycle of surface ocean pCO2on the Oregon shelf,J. Geophys. Res., 116, C05012, doi:10.1029/2010JC006625.
Read MoreProtocol for the Assessment and Correction of Surface Water and Air pCO2 Measurements

As part of the Endurance Array, surface buoy partial pressure CO2 (pCO2) measurements are made using the Pro-Oceanus CO2-Pro Atmosphere pCO2 sensor. This sensor measures the partial pressure of CO2 gas in both surface water and air, allowing for surface flux calculations. Both the air and water measurements, and the flux estimates, are available through the OOI Data Portal.
Wingard et al. (2020) reported on the surface water and air pCO2 data returned for the first four years of Endurance Array operations and described a protocol based on cross-comparisons to independent, shipboard (both CTD samples and underway flow-thru systems) pCO2 measurements, data available from the Lamont-Doherty Earth Observatory (LDEO) V2018 pCO2 database (Takahashi et al., 2019), data from the NOAA Earth System Research Laboratory (ESRL) Global Monitoring Division (GMD) Carbon Cycle Greenhouse Gases (CCGG) data repositories (NOAA ESRL Global Monitoring Division, 2016), and a high-resolution monthly pCO2 climatology for the coastal ocean (Laruelle et al., 2017).
Use of independent sources of pCO2 data, such as the discrete sample data and the LDEO V2018 database, are critical to validating the surface water pCO2 measurements. The overlapping deployment structure employed by OOI (newly refurbished and calibrated instruments deployed next to older instruments) provides an additional means to validate the surface water and air pCO2 measurements (see Fig xx).
The comparison shows overall quality of the surface water pCO2 measurements collected by the OOI Endurance Array is very high. Beyond a simple smoothing filter and application of human in the loop flags, no further corrections are required to the data. OOI Endurance Array data provide a novel source of high-resolution (hourly), near-continuous surface water pCO2 measurements in the coastal regions off the Oregon and Washington coasts. While there are multiple gaps in the air pCO2 measurements (greater than 33% of the total record), the potential exists for the creation of a common, combined daily averaged air pCO2 record that could help to address these gaps.
This assessment gives confidence to the data on the portal as well as the export of OOI Endurance Array data via the NANOOS Visualization System and the Global Ocean Acidification Observing System Data Portal (GOA-ON).
Read More