Posts Tagged ‘Amy Bower’
OOI Data Sonification
The assumption that quantitative data can be well represented not only in charts and graphs, but by increasingly sophisticated visual displays, is often taken for granted. However, researchers, instructors, and curators of museums and science centers also recognize that even the most sophisticated visual displays are inaccessible to those with low-vision or blindness. There is also the potential for alternative data presentation methods to improve understanding of complex data for sighted individuals. With these considerations in mind, a team led by Dr. Bower (WHOI) has pursued the creation of auditory displays or “data sonifications” using multi-disciplinary U.S. National Science Foundation Ocean Observatories Initiative (OOI) data sets as the basis. The results to date from the NSF-funded data sonification project are reported in a recent publication by Smith et al. (2024).
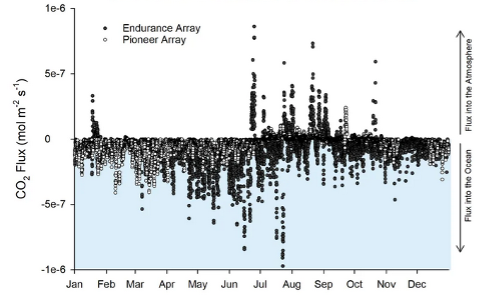
[media-caption path="https://oceanobservatories.org/wp-content/uploads/2024/05/Data-Sonification-figure.png" link="#"]Figure 1. Time series data from two data nuggets created by Ocean Data Labs that were used for sonification. Surface meteorology during the passage of hurricane Hermine over the Pioneer Array in 2016 (upper). The CO2 flux between ocean and atmosphere for both Pioneer (open circles) and Endurance Arrays during 2017 (lower).[/media-caption]Data sonification involves the mapping of quantitative data from its original form to audio signals in order to communicate complex information content. The project team was interested in using actual ocean data spanning a variety of oceanographic disciplines. Time series data produced by OOI sensors provide an excellent starting point. In particular, the Ocean Data Labs group at Rutgers has reviewed OOI data and created a set of “data nuggets” that are appropriate for sonification (Greengrove et al., 2020). The data nuggets comprise a broad range of oceanographic phenomena observed by OOI sensors, including response to a storm, the diurnal migration of zooplankton, a volcanic eruption, and the flux of CO2 between ocean and atmosphere.
The project team used a rigorous approach to developing and refining the auditory presentations. Starting with a set of learning objectives for each data nugget, a multi-step process was used to create the sonification. First, oceanographers were interviewed to establish the important points to be conveyed for a given data nugget. Next, classroom instructors were interviewed to get feedback on the most effective approaches to using sound to explain data properties. A sound designer then created an initial mapping of the data to sound, which was reviewed by a representative group of researchers, instructors, and blind and visually impaired listeners. After additional rounds of refinement and feedback, the prototype sonifications are now available. Two auditory displays utilizing Pioneer Array data (Fig. 1) are available at https://doi.org/10.5281/zenodo.8162769 and https://doi.org/10.5281/zenodo.8173880 for CO2 flux and storm response, respectively. Other examples can be found in Smith et al. (2024). The sonifications will be evaluated broadly using an on-line survey and by a “live audience” at museums and science centers.
This project is unique in exploiting the rich OOI data set and making ocean science highlights available to a broad community of students and the general public. A significant aspect of the work, as pointed out by the authors, is the systematic and inclusive approach used to develop the data sonifications. Results of the museum testing phase in 2024 will be awaited with great anticipation.
___________________
References:
Greengrove, C., S. Lichtenwalner, H.I. Palevsky, A. Pfeiffer-Herbert, S. Severmann, D. Soule, S. Murphy, L.M. Smith and K. Yarincik, 2020. Using authenticated data from NSF’s Ocean Observatories Initiative in undergraduate teaching, Oceanography, 33(1), 62-73.
Smith, L.M., A. Bower, J. Roberts, J. Bellona and J. Li, 2024. Expanding access to ocean science through inclusively designed data sonifications, Oceanography, 36(4), 96-101.
Read More
Using Sound to Create Accessible Ocean Data

Mindy Todd of WCAI Radio interviewed Amy Bower, Woods Hole Oceanographic Institution physical oceanographer and senior scientist, and Jon Bellona, sound artist with Harmonic Laboratory and senior instructor of audio production at the University of Oregon about their “Accessible Ocean” project, which uses sound to portray OOI data. The team is applying a “sonification” process that maps numbers into sound to OOI data nuggets, created by the Ocean Data Labs for use in the classroom. Their goal is to inclusively design and pilot auditory displays of real ocean data that can ultimately be included in museum displays to reach broad audiences.
Listen in here.
Learn more about the Accessible Ocean project here.
[caption id="attachment_33007" align="aligncenter" width="1760"] Data sonification. ©WHOI.[/caption]
Read More
Data sonification. ©WHOI.[/caption]
Read More Making the Ocean Accessible Through Sound
“Scientists are finding that people can sometimes pick up more information from their ears than the eyes can see. And ears can perceive patterns in the data that the eyes can’t see,” said Amy Bower, a Senior Scientist at Woods Hole Oceanographic Institution and Principal Investigator for the Accessible Oceans project. “Adding sound to science allows more people to experience science, follow their curiosity, and make science more accessible to all. “
Bower joined forces with a multidisciplinary team to explore ways sound could be used to visualize data. Funded by the National Science Foundation’s Advancing Informal STEM Learning Program, Bower and her team have been working for nearly two years on Accessible Oceans: Exploring Ocean Data through Sound. Their goal is to inclusively design and pilot auditory displays of real ocean data. They are implementing a process called sonification, assigning sound to data points. Each member brings expertise to the task at hand. Principal Investigator Bower is an oceanographer. Dr. Jon Bellona is a sound designer with specialization in data sonification at the University of Oregon. Dr. Jessica Roberts and graduate student Huaigu Li, both at Georgia Tech, are Learning Sciences and human-computer interaction experts. Dr. Leslie Smith, an oceanographer and specialist in ocean science education and communication at Your Ocean Consulting, Inc., rounds out the team. Bower is a blind scientist, who lends a crucial perspective in the research and overall execution of the project.
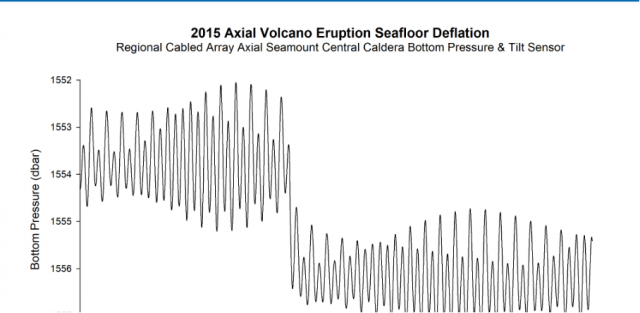
To begin, the team chose to use datasets collected by the Ocean Observatories Initiative (OOI) that had previously been transformed into classroom-ready use by Smith and the Ocean Data Labs. The team is working first on three of these curated datasets: the 2015 eruption of Axial Seamount, the vertical migration of zooplankton during an eclipse event, and carbon dioxide exchange between the ocean and the atmosphere.
“Data is made of numbers. Sonification is basically just translating numbers into sound,” Bower explained. “So instead of seeing numbers go up and down on a graph, for example, you can hear them go up and down.”
To ensure an inclusive final product, the team has undertaken a co-design process in which a variety of stakeholders have been engaged for input throughout the process. The team interviewed both subject matter experts and teachers of the blind and visually impaired to ensure that both scientific and pedagogical needs were being met. They then explored the integration of various auditory display techniques and ended up with a mix of data sonification, narration, and environmental sounds. The team put together a sample of five to six sonification examples for each data set, then surveyed a group of blind, visually impaired and sighted adults and students with science and non-science backgrounds. The survey’s purpose was to ask which sounds and which approaches might work best for both sighted and visually impaired listeners.
“We asked, for example, which of these sounds do you think best represents gases coming in and out of the ocean. The feedback was overwhelmingly in favor of a breathing sound,” said Bower. “As listeners will hear in the first example below that deals with carbon dioxide exchange between the ocean and the atmosphere, the breathing sound, with narration explaining what to expect, really brings the data to life.”
Accessible Oceans is a pilot and feasibility study for a museum exhibit that would introduce the broader public to what it’s like to experience ocean data through sound. At the end of this two-year project, the team intends to submit another proposal to design and build an exhibit that make ocean data come alive in a new and accessible way.
“As we’ve been working on this project, we’ve come to realize that to engage more people in science, technology, engineering and math, we can appeal to their ears as well as their eyes,” added Bower. “And I’m determined to help make science as accessible as possible for everyone.”
________________________________________________________________________
To hear more about Amy Bower’s work as an oceanographer and her exploration of sonification, tune into this episode of The Science of Ocean Sounds, Tumble Science Podcast for Kids.
Read More
Accessible Ocean Reported in LA Times
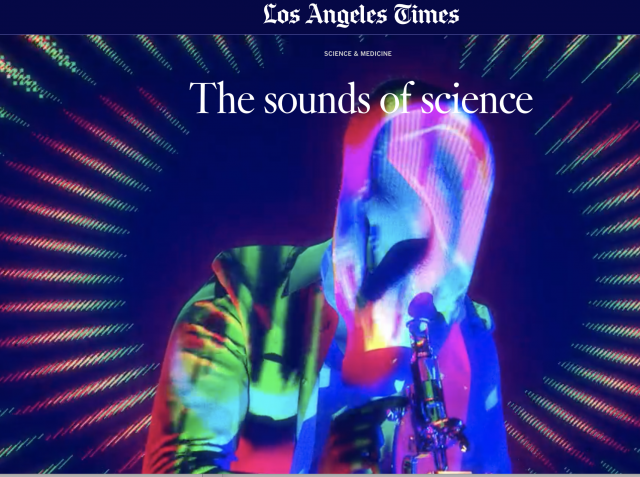

On February 3, 2023, the Los Angeles Times reported on the work of Woods Hole Oceanographic Researcher Amy Bower and her colleagues on the Accessible Oceans Project. The team uses OOI and other auditory data to explore ways sound can be used to help visualize ocean science for the visually impaired. It’s cutting-edge, fascinating, and inclusive work.
Read the LA Times report on this important initiative.
Read MoreOcean Data Lab Nuggets Providing Foundation for Accessible Oceans