
Posts Tagged ‘Coastal Pioneer Array’
Scoping the New Pioneer Array in the Southern Mid-Atlantic Bight
A very engaged group of participants spent the week of June 21st thinking about how to optimize the Pioneer Array for its relocation to the southern Mid-Atlantic Bight (MAB) in 2024. The five-day Innovations Lab, sponsored by the National Science Foundation (NSF) was led by the OOIFB (Ocean Observatories Initiative Facilities Board), a talented team of “Sparks”, Knowinnovation, Inc. (KI), and expertly supported by the OOI Facility. The group identified a range of representative interdisciplinary science questions that can be addressed using the Pioneer Array within the MAB and proposed optimum locations and potential configurations for the array.
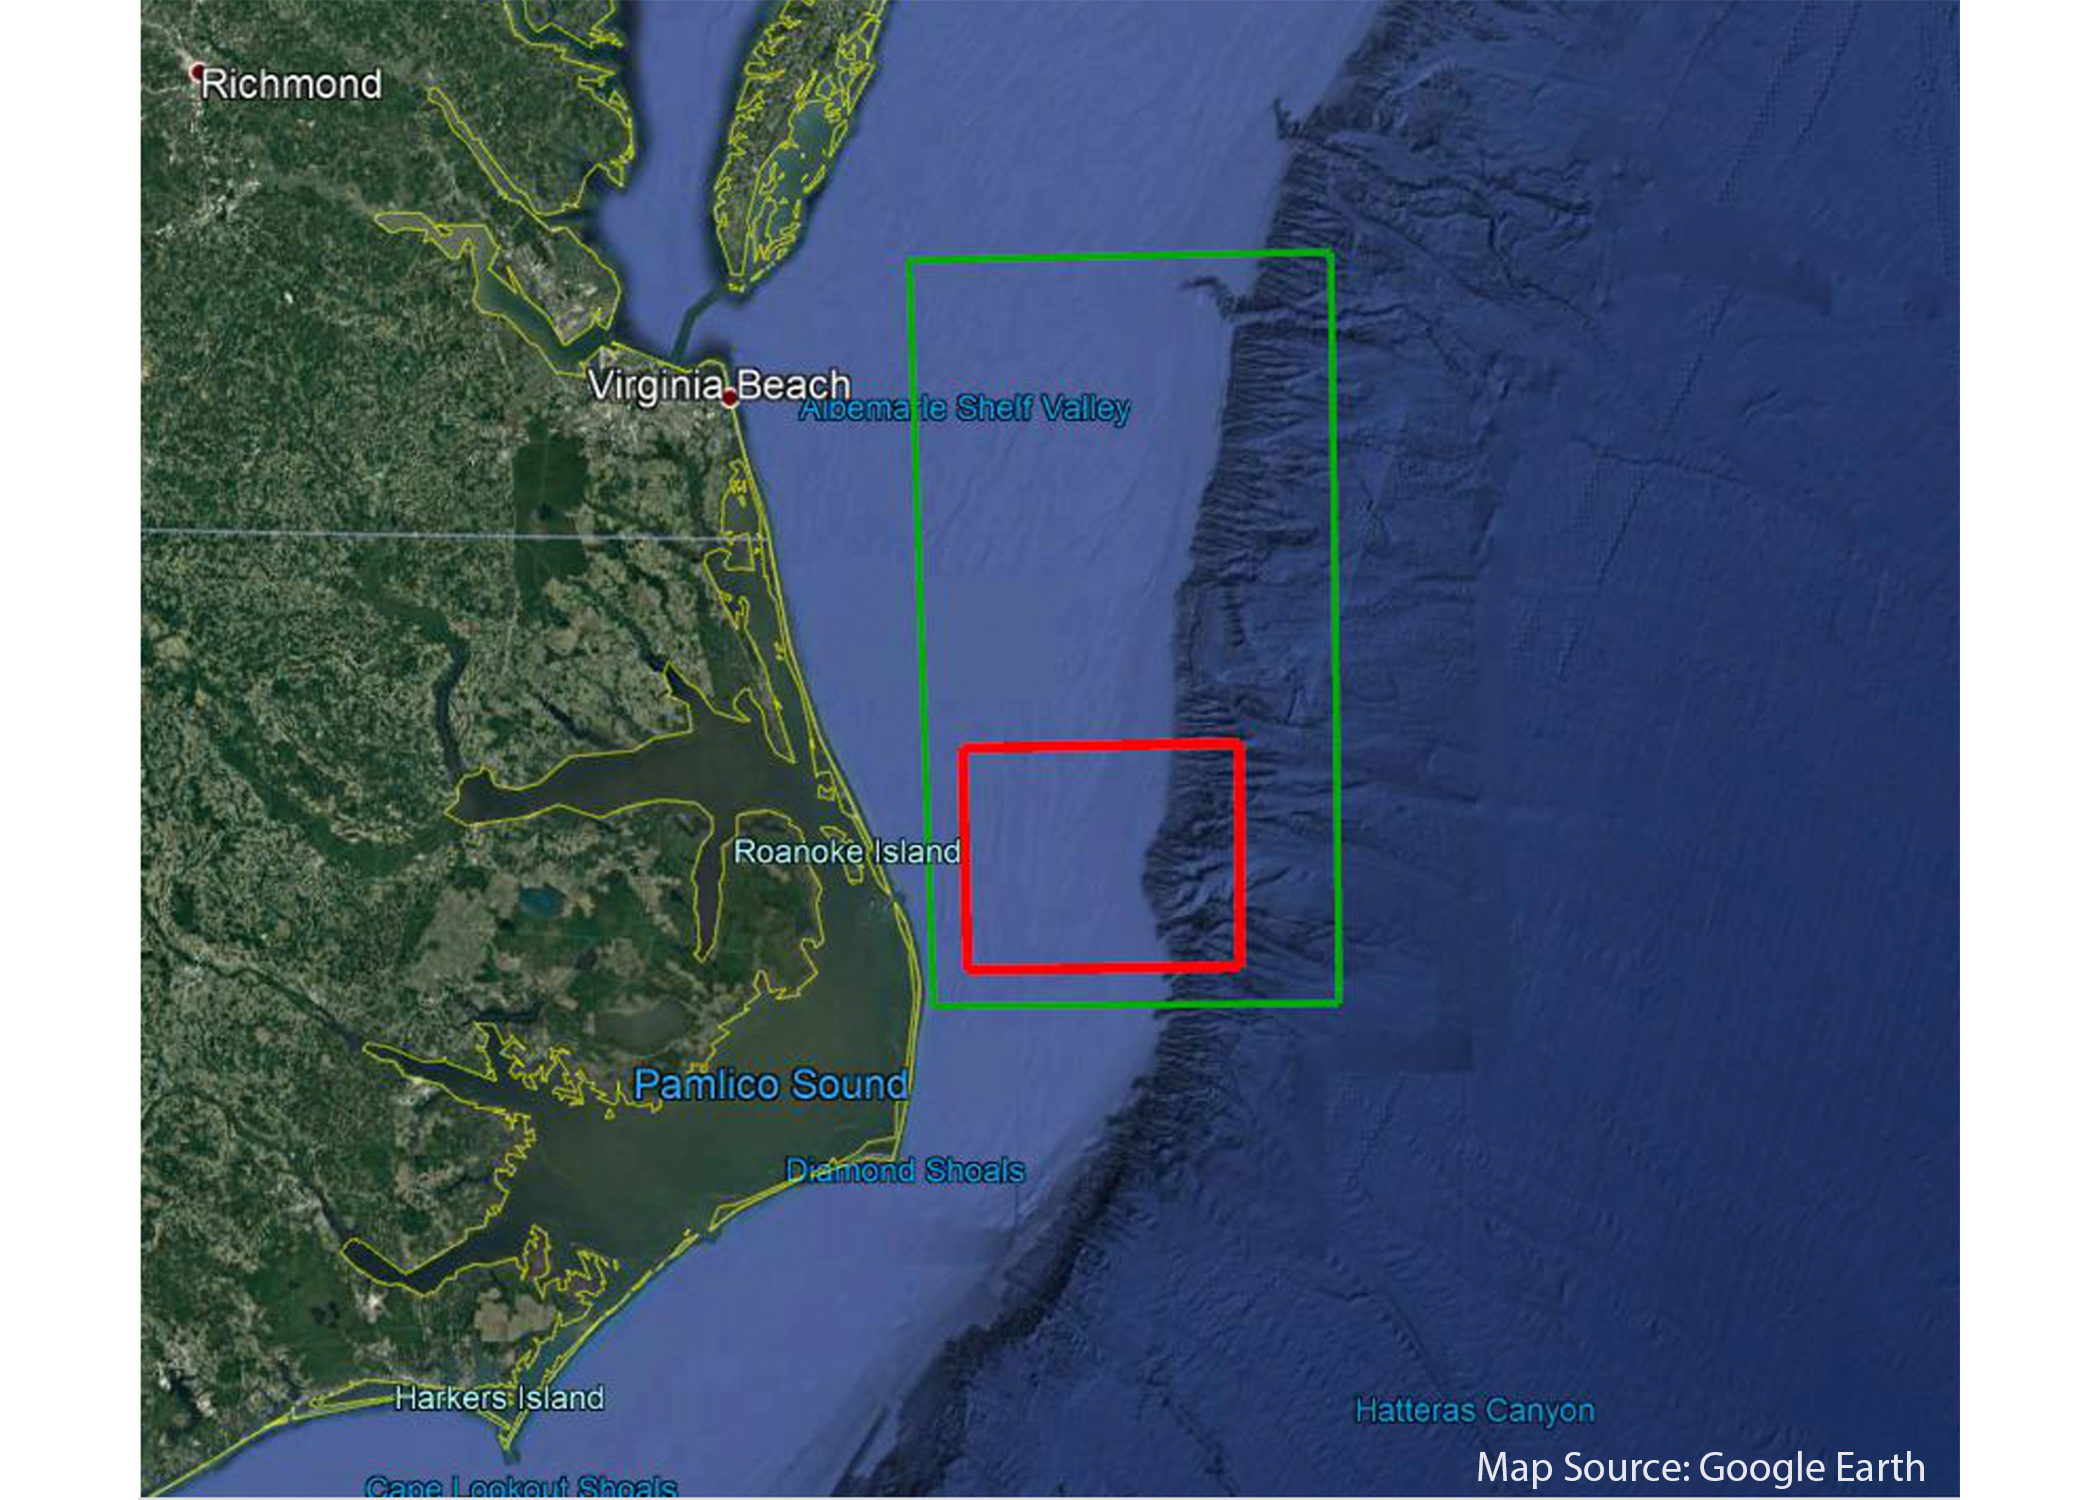
Science question topics included air-sea interactions; the influence of estuarine plumes and the Gulf Stream on cross-shelf and shelf-slope exchanges and their impacts on ocean chemistry and biology; benthic-pelagic coupling; and canyon processes. Participants converged on a general region (see boxes in Figure 1 below) that would best address the science questions.
[media-caption path="https://oceanobservatories.org/wp-content/uploads/2021/06/Google-earth-map.png" link="#"]Figure 1. Southern MAB Pioneer Array regions. The red box indicates the region where moorings would be located and the larger green box indicates the region where mobile assets (gliders and AUVs) would operate.[/media-caption]
“The Innovations Lab was very successful, and we really appreciate the community sharing their innovative ideas with us in this essential first step,” said Kendra Daly, chair of the OOIFB. “The Innovations Lab provides an excellent start to a long process of fleshing out the details to ensure that the array provides data to investigate a broad range of interdisciplinary science questions, while also being robust enough to weather the challenging environmental conditions in the Mid-Atlantic Bight.”
The OOIFB will continue to engage with the OOI community to refine the array’s design for implementation over the next two years. The Innovations Lab showed that there is strong community interest in coastal science, the potential for new partnerships, and excitement about implementing the Pioneer Array in its new location.
Read More
Pioneer Data Sheds Light on Massive Plankton Blooms
“The big mystery about plankton is what controls its distribution and abundance, and what conditions lead to big plankton blooms,” said Dennis McGillicuddy, Senior Scientist and Department Chair in Applied Ocean Physics and Engineering at the Woods Hole Oceanographic Institution (WHOI).
Two new papers explore this question and provide examples of conditions that lead to massive plankton blooms with vastly different potential impacts on the ecosystem, according to McGillicuddy, co-author of both papers. Both papers also point to importance of using advanced technology—including video plankton recorders, autonomous underwater vehicles, and the Ocean Observatories Initiative’s Coastal Pioneer Array—to find and monitor these blooms.
In one paper, Diatom Hotspots Driven by Western Boundary Current Instability, published in Geophysical Research Letters (GRL), scientists found unexpectedly productive subsurface hotspot blooms of diatom phytoplankton.
In the GRL paper, researchers investigated the dynamics controlling primary productivity in a region of the Mid-Atlantic Bight (MAB), one of the world’s most productive marine ecosystems. In 2019, they observed unexpected diatom hotspots in the slope region of the bight’s euphotic zone, the ocean layer that receives enough light for photosynthesis to occur. Phytoplankton are photosynthetic microorganisms that are the foundation of the aquatic food web.
It was surprising to the researchers that the hotspots occurred in high-salinity water intruding from the Gulf Stream. “While these intrusions of low‐nutrient Gulf Stream water have been thought to potentially diminish biological productivity, we present evidence of an unexpectedly productive subsurface diatom bloom resulting from the direct intrusion of a Gulf Stream meander towards the continental shelf,” the authors note. They hypothesize that the hotspots were not fueled by Gulf Stream surface water, which is typically low in nutrients and chlorophyll, but rather that the hotspots were fueled by nutrients upwelled into the sunlight zone from deeper Gulf Stream water.
With changing stability of the Gulf Stream, intrusions from the Gulf Stream had become more frequent in recent decades, according to the researchers. “These results suggest that changing large‐scale circulation has consequences for regional productivity that are not detectable by satellites by virtue of their occurrence well below the surface,” the authors note.
“In this particular case, changing climate has led to an increase in productivity in this particular region, by virtue of a subtle and somewhat unexpected interaction between the physics and biology of the ocean. That same dynamic may not necessarily hold elsewhere in the ocean, and it’s quite likely that other areas of the ocean will become less productive over time. That’s of great concern,” said McGillicuddy. “There are going to be regional differences in the way the ocean responds to climate change. And society needs to be able to intelligently manage from a regional perspective, not just on a global perspective.”
The research finding demonstrated “a cool, counterintuitive biological impact of this changing large scale circulation,” said the GRL paper’s lead author, Hilde Oliver, a postdoctoral scholar in Applied Ocean Physics and Engineering at WHOI. She recalled watching the instrument data come in. With typical summertime values of about 1-1.5 micrograms of chlorophyll per liter of seawater, researchers recorded “unheard of concentrations for chlorophyll in this region in summer,” as high as 12 or 13 micrograms per liter, Oliver said.
Oliver, whose Ph.D. focused on modeling, said the cruise helped her to look at phytoplankton blooms from more than a theoretical sense. “To go out into the ocean and see how the physics of the ocean can manifest these blooms in the real world was eye opening to me,” she said.
Another paper published in the Journal of Geophysical Research: Oceans (JGR: Oceans), A Regional, Early Spring Bloom of Phaeocystis pouchetii on the New England Continental Shelf, also was eye opening. Researchers investigating the biological dynamics of the New England continental shelf in 2018 discovered a huge bloom of the haptophyte phytoplankton Phaeocystis pouchetii.
However, unlike the diatom hotspots described in the GRL paper, Phaeocystis is “unpalatable to a lot of different organisms and disrupts the entire food web,” said Walker Smith, retired professor at the Virginia Institute of Marine Science William and Mary, who is the lead author on the JGR: Oceans paper. The phytoplankton form gelatinous colonies that are millimeters in diameter.
When Phaeocystis blooms, it utilizes nutrients just like any other form of phytoplankton would. However, unlike the diatoms noted in the GRL paper, Phaeocystis converts biomass into something that doesn’t tend to get passed up the rest of the food chain, said McGillicuddy.
“Understanding the physical-biological interactions in the coastal system provides a basis for predicting these blooms of potentially harmful algae and may lead to a better prediction of their impacts on coastal systems,” the authors stated.
Massive blooms of the colonial stage of this and similar species have been reported in many systems in different parts of the world, which Smith has studied. These types of blooms probably occur about every three years in the New England continental shelf and probably have a fairly strong impact on New England waters, food webs, and fisheries, said Smith. Coastal managers need to know about these blooms because they can have economic impacts on aquaculture in coastal areas, he said.
“Despite the fact that the Mid-Atlantic Bight has been well-studied and extensively sampled, there are things that are going on that we still don’t really appreciate,” said Smith. “One example are these Phaeocystis blooms that are deep in the water and that you are never going to see unless you are there because satellites can’t show them. So, the more we look, the more we find out.”
Both of these studies were carried out as part of the National Science Foundation-funded Shelfbreak Productivity Interdisciplinary Research Operation at the Pioneer Array involving partners at WHOI, University of Massachusetts Dartmouth, Massachusetts Division of Marine Fisheries, Virginia Institute of Marine Science, Wellesley College, and Old Dominion University. Additional support has been provided by the Dalio Explorer Fund.
For more information, see the video “Life at the Edge: Plankton Growth at the Shelf Break Front,” produced by ScienceMedia.nl for WHOI.
Read MoreApplications for the Pioneer Array Innovations Lab 2 due May 31st
Applications to apply for the Pioneer Array Innovations Lab 2 are due on May 31st. The Lab will be held each day during the week of June 21-25 (about 5-6 hours each day). During this Lab, participants will work to identify the observatory opportunities that can be offered by the Pioneer Array at its new location at the Mid-Atlantic Bight. Details are provided below.
The application form for the Pioneer Array Innovations Lab 2 is available here.
To learn more or to apply, please visit here.
Read More
Expanding Reach of OOI Data
 Pioneer Array data is now available on NERACOOS’ new Mariner’s Dashboard. This is but one example of how OOI data are integrated into other data repositories to maximize their benefit and use.[/caption]
OOI shares data with partner repositories and institutions that host similar data but have different user bases. These partnerships expand the data available for forecasting models, help provide insight into current ocean conditions, and serve as important resources for many ranging from fishers and other maritime users to land-based researchers and students.
With the exception of the Station Papa Array, the OOI Coastal and Global Arrays maintain surface buoys. Instruments deployed on these buoys measure meteorological variables such as air temperature, barometric pressure, northward and eastward wind velocities, precipitation, solar radiation, and surface water properties of sea surface temperature and salinity. Other instruments on the moorings collect wave data, such as significant wave height, period, and direction. These data are then consumed by national and regional networks to improve accuracy of weather forecasting models.
The Regional Cabled Array (RCA) consists of fiber-optic cables off the Oregon coast that provide power, bandwidth, and communication to seafloor instrumentation and moorings with instrumented profiling capabilities. A diverse array of geophysical, chemical, and biological sensors, a high-definition camera, and digital still cameras on the seafloor and mooring platforms, provide real-time information on processes operating on and below the seafloor and throughout the water column, including recording of seafloor eruptions, methane plume emissions and climate change. These data are available for community use. Since 2015, the RCA has fed data into Incorporated Research Institutions for Seismology (IRIS), the primary source for data related to earthquakes and other seismic activity. In addition, data including zooplankton sonar data, are being utilized within the Pangeo ecosystem for community visualization and access and pressure data are incorporated into NOAA’s operational tsunami forecasting system.
Helping Improve Models and Forecasting
One of the recipients of OOI data is the National Data Buoy Center (NDBC), part of the National Oceanic and Atmospheric Administration’s (NOAA) National Weather Service. NDBC maintains a data repository and website, offering a range of standardized real-time and near real-time meteorological data. Data such as wind speed and direction, air and surface water temperature, and wave height and direction are made available to the broader oceanographic and meteorological community.
“Many researchers go to NDBC for their data, “said Craig Risien, a research associate with OOI’s Endurance Array and Cyberinfrastructure Teams, who helps researchers gain access to and use OOI data. “NBDC is a huge repository of data and it’s easy to access. So there’s a low barrier for researchers and students who are looking for information about wind speed, water temperature and a slew of other data. OOI contributing to this national repository significantly increases its data reach, allowing OOI data to be used by as many people as possible. “
OOI sea surface temperature data also make their way into the operational Global Real-Time Ocean Forecast System (RTOFS) at the National Centers for Environmental Prediction (NCEP), another part of NOAA’s National Weather Service. RTOFS ingests sea surface temperature and salinity data from all available buoys into the Global Telecommunications System (GTS). OOI glider data also are pushed in near real-time to the US Integrated Ocean Observing System Glider Data Assembly Center (DAC). From there, the data goes to the GTS where it can be used by the operational modeling centers such as NCEP and the European Centre for Medium-Range Weather Forecasts.
The GTS is like a giant vacuum sucking up near real-time observations from all sorts of different platforms deployed all over the world. On a typical day, the GTS ingests more than 7,600 data points from fixed buoys alone. As a result of this vast input, researchers can go to the GTS, pull available data, and assimilate that information into any model to improve its prediction accuracy.
Advancing Forecasting of Submarine Eruptions
As the first U.S. ocean observatory to span a tectonic plate, RCA’s data are an invaluable contributor to IRIS’s collection. Since 2015, the user community has downloaded >20 Terabytes of RCA seismometer data from the IRIS repository. Fourteen different sampling locations include key sites at Axial Seamount on the Juan de Fuca mid-ocean ridge spreading center, near the toe of the Cascadia Margin and Southern Hydrate Ridge. RCA data are catalogued and available on the IRIS site, using the identifier “OO.”
[caption id="attachment_21046" align="alignleft" width="300"]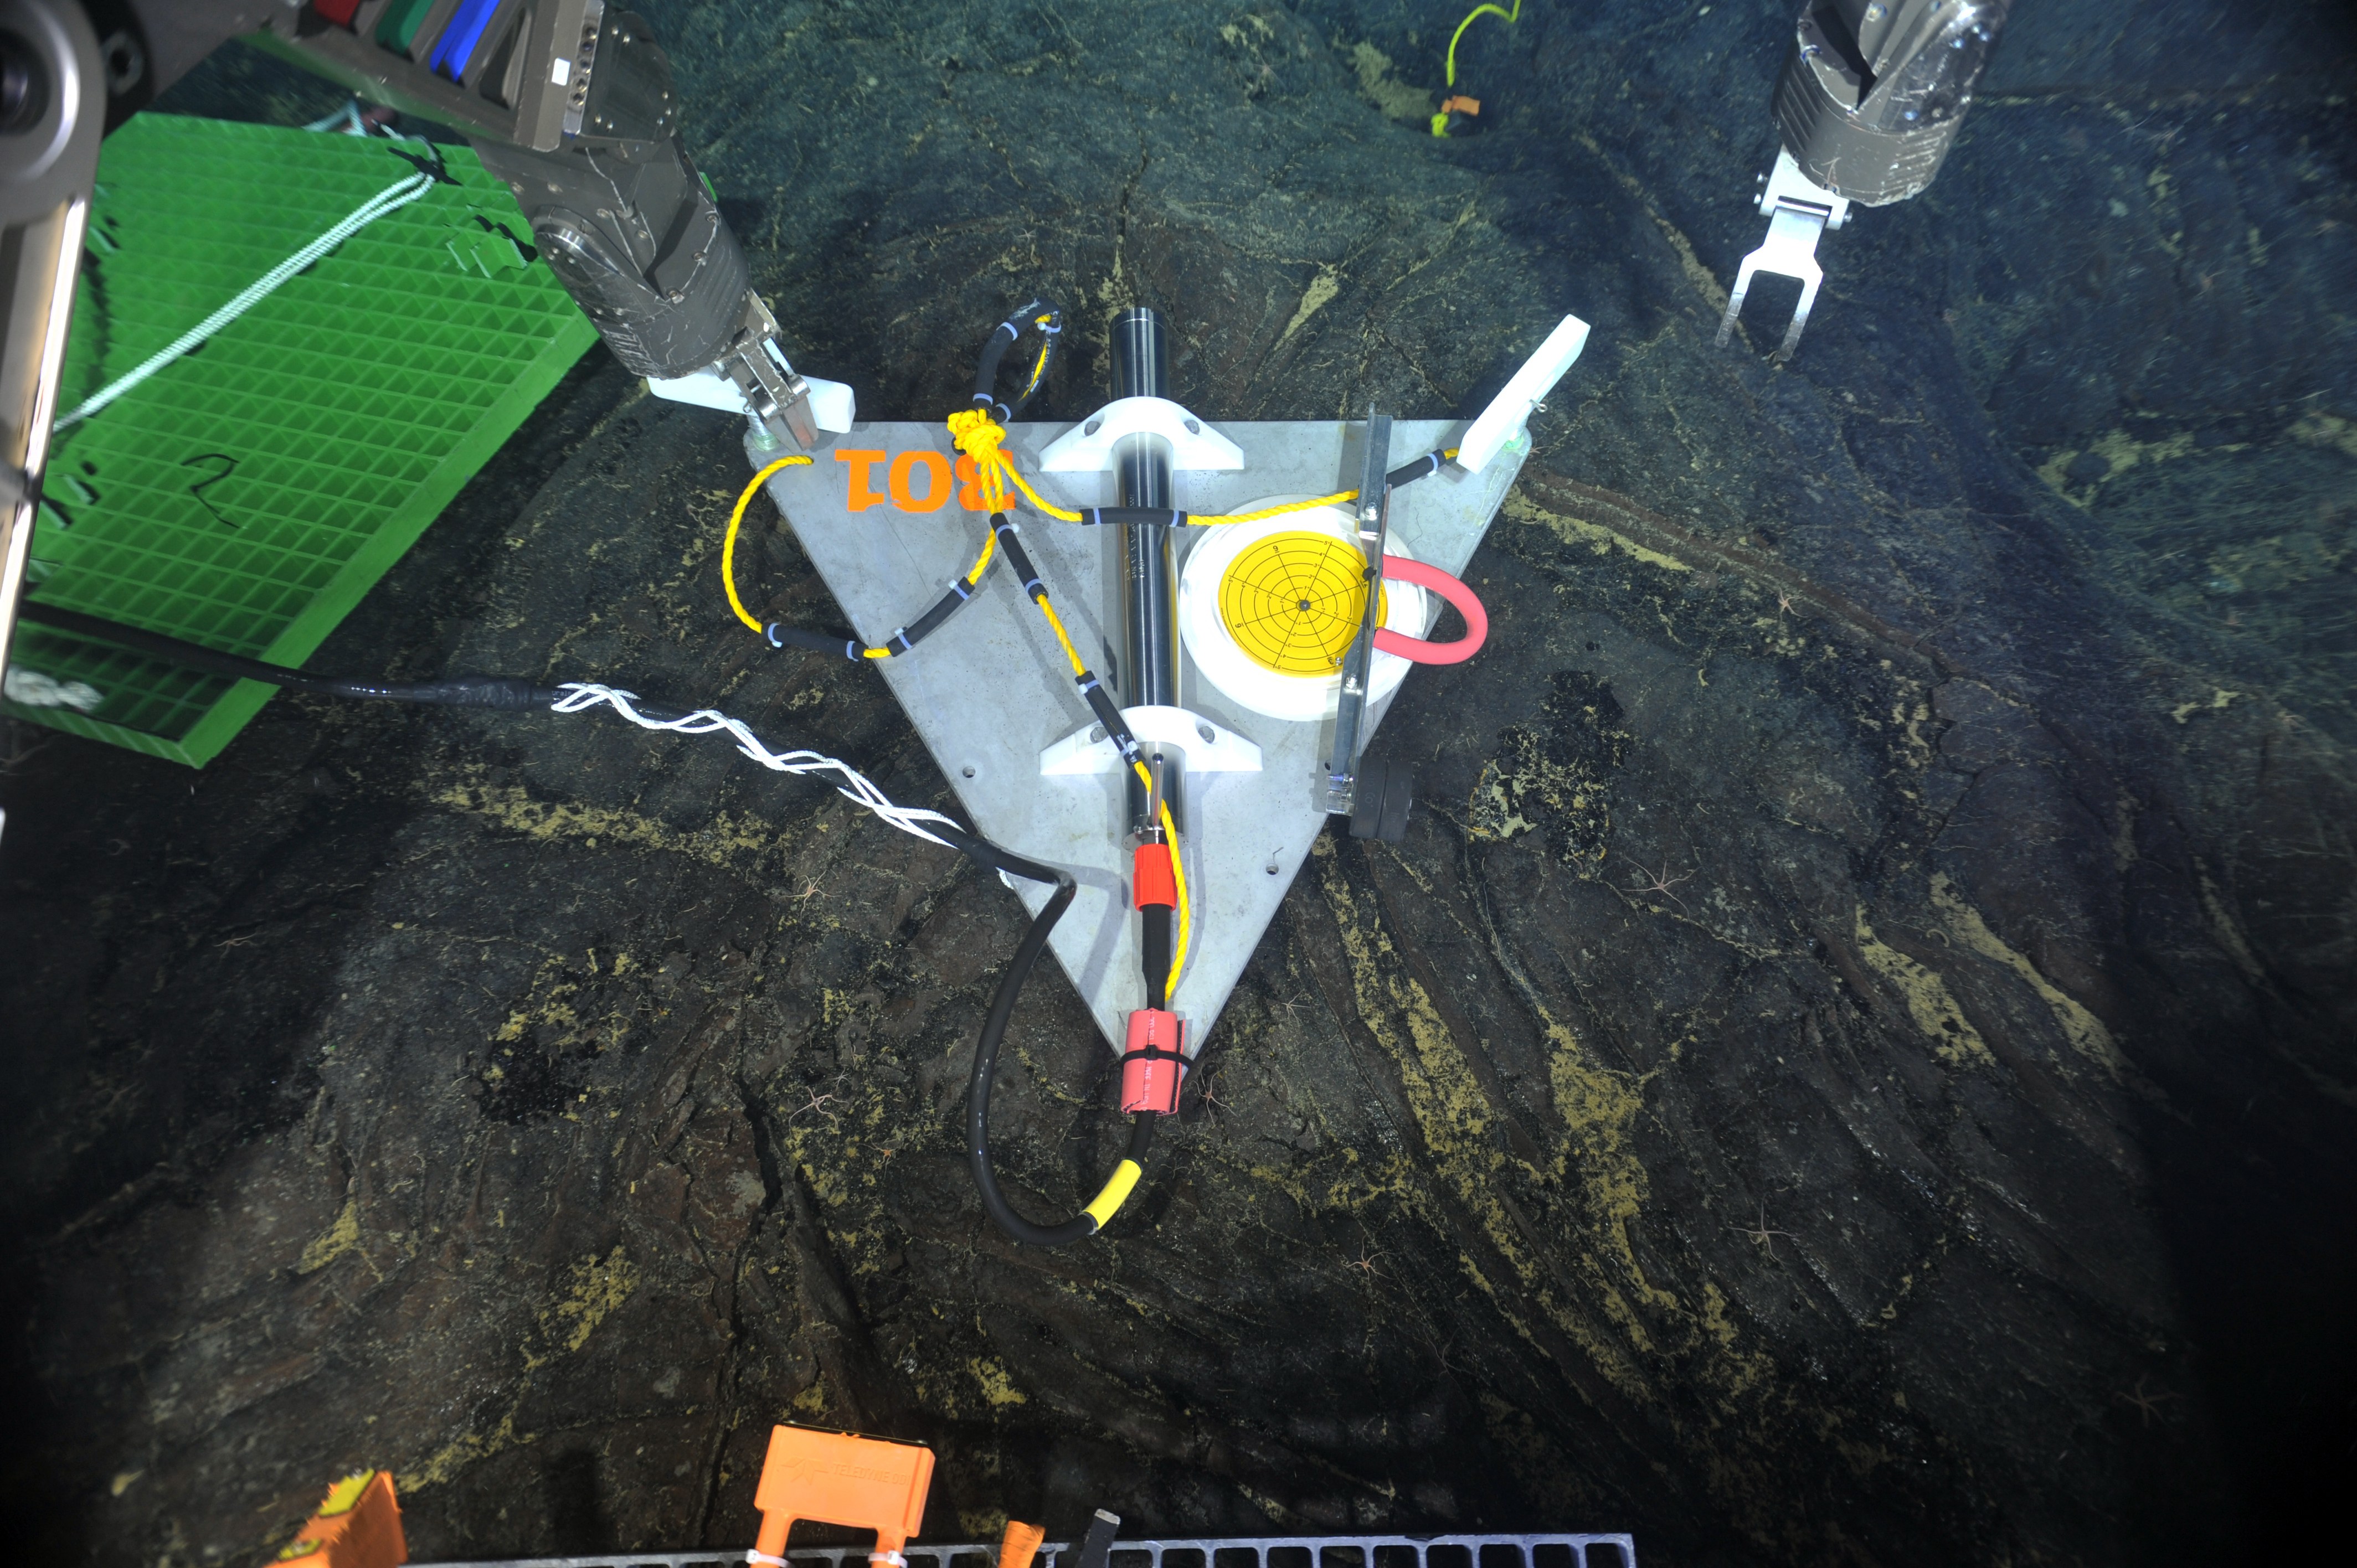 Data from short period seismometers installed at RCA’s Axial Seamount and Southern Hydrate Ridge sites are streamed live to IRIS. Credit: UW/NSF-OOI/Canadian Scientific Submersible Facility, V13.[/caption]
“RCA is a critical community resource for seismic data. Axial Seamount, for example, which erupted in 1998, April 2011, was the site of more than 8,000 earthquakes over a 24-hour period April 24, 2015 marking the start of large eruption,” explained Deb Kelley, PI of the RCA. “Being able to witness and measure seismic activity in real time is providing scientists with invaluable insights into eruption process, which along with co-registered pressure measurements is making forecasting possible of when the next eruption may occur. We are pleased to share data from this volcanically and hydrothermally active seamount so researchers the world over can use it to better understand processes happening at mid ocean ridges and advance forecasting capabilities for the first time of when a submarine eruption may occur.”
Providing Data with Regional Implications
[caption id="attachment_21047" align="alignright" width="203"]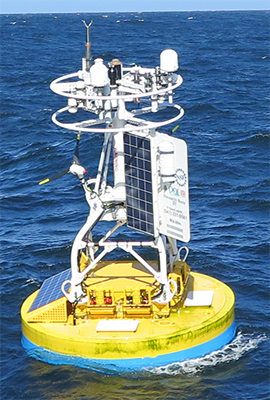 Data from Endurance Array buoy 46100 are fed into WCOFS, where they are accessible to maritime users. Credit: OSU[/caption]
OOI also provides data to regional ocean observing partners. Data from two Endurance Array buoys (46099 and 46100), for example, are fed into a four-dimensional U.S. West Coast Operational Forecast System (WCOFS), which serves the maritime user community. WCOFS generates water level, current, temperature and salinity nowcast and forecast fields four times per day. The Coastal Pioneer Array is within the future Northeastern Coast Operational Forecast System (NECOFS). Once operational, Pioneer’s observations will potentially be used for WCOFS data assimilation scenario experiments.
Coastal Endurance Array data are shared with the Northwest Association of Networked Ocean Observing Systems (NANOOS), which is part of IOOS, and the Global Ocean Acidification Observing Network (GOA-ON). Endurance data are ingested by the NANOOS Visualization System, which provides easy access to observations, forecasts, and data visualizations. Likewise, for GOA-ON, the Endurance Array provides observations useful for measuring ocean acidification.
Data from three of the Pioneer Array buoys also are part of the Mariners’ Dashboard, a new ocean information interface at the Northeastern Regional Association of Coastal Ocean Observing Systems (NERACOOS). Visitors can use the Dashboard to explore the latest conditions and forecasts from the Pioneer Inshore (44075), Central (44076), and Offshore (44077) mooring platforms, in addition to 30+ other observing platforms throughout the Northeast.
“We are working hard to distribute the OOI data widely through engagement with multiple partners, which together are helping inform science, improve weather and climate forecasts, and increase understanding of the ocean,” added Al Plueddemann, PI of the Coastal and Global Scale Nodes, which include the Pioneer, Station Papa, and Irminger Sea Arrays.
Read More
Sweet 16: Pioneer Array Successfully Turned
Twenty days at sea. Forty different at-sea operations. Nine moorings recovered. Eight moorings, two coastal profiling gliders and two global test gliders deployed. Completion of more than 25 objectives during the 16th turn of the Coastal Pioneer Array.
By all counts, the Pioneer Array 16 expedition was a huge success. The scientific team was able to accomplish a full mooring service cruise in spite of COVID-imposed restrictions that restricted building occupancy for pre-cruise preparation, limited personnel onboard to accomplish the work and imposed a two-week quarantine period prior to boarding the ship.
“It’s always takes a focused effort from many people for a successful cruise, but COVID has made it harder.” said Al Plueddemann, chief scientist for Pioneer Array and principal investigator for the Ocean Observatory Initiative’s (OOI) Coastal and Global Scale Nodes. “The OOI team, the captain and crew of the Armstrong, and the shore-side support all put in a great effort to see this through to completion, while still operating at reduced efficiency under ongoing COVID-19 restrictions.”
A variety of atmospheric and oceanographic measurements are made prior to deployments and following recoveries for validation of mooring, glider, and AUV (autonomous underwater vehicle) observations. The team also conducted cross-shelf and along-shelf CTD surveys and collected water samples adjacent to all the moorings. The team also surveyed the array’s region using shipboard sensors (ADCP, EK-80, and thermosalinograph).
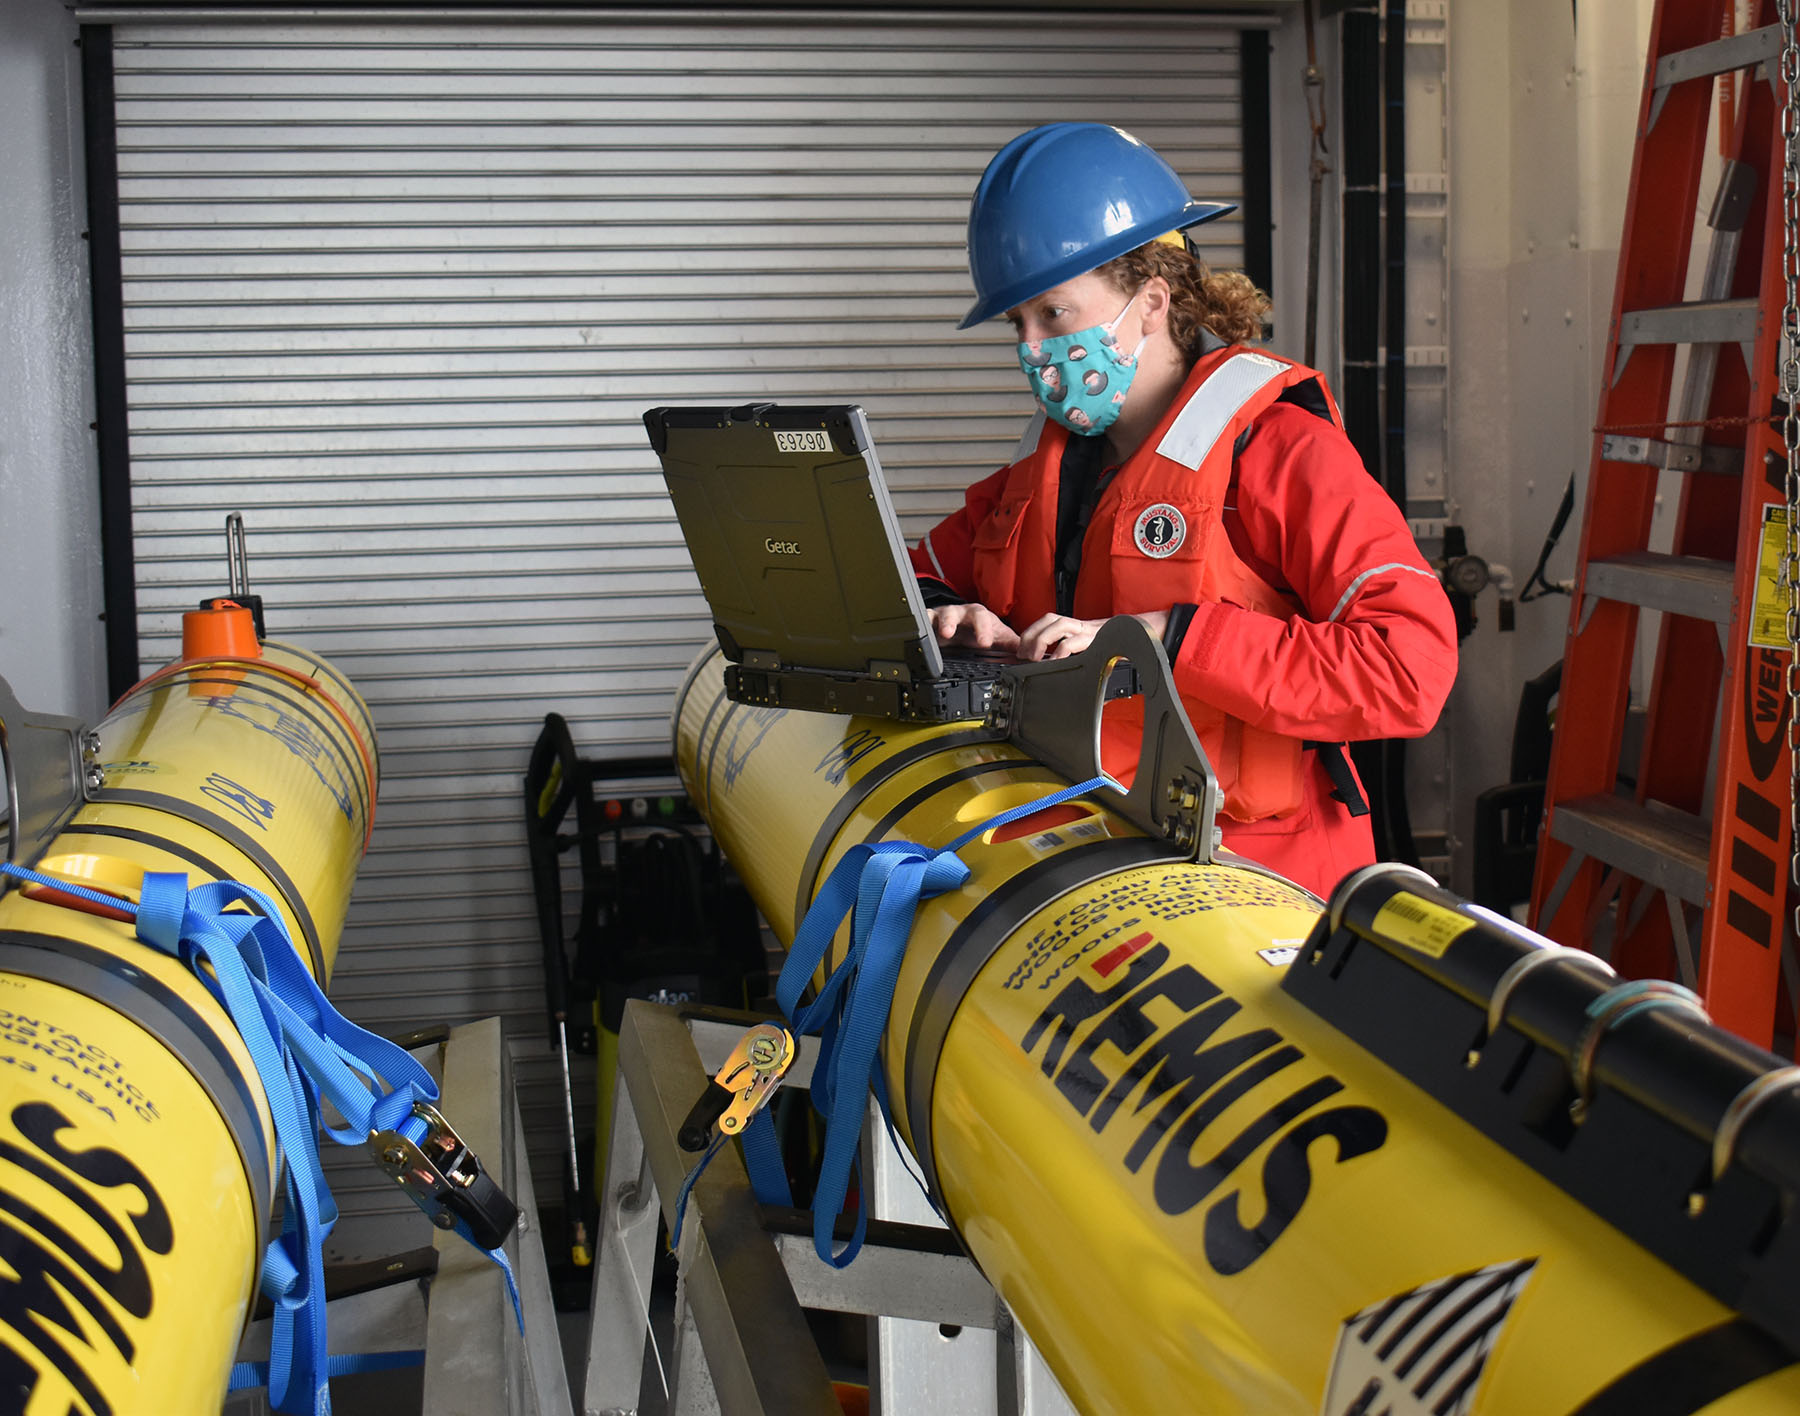
In addition to the successful mooring operations, the Pioneer 16 team completed several mobile platform objectives as well. For the spring and summer time period, two coastal profiling gliders were deployed to replace winter profiler moorings. Two global test gliders were also put through their paces to ensure safe operation and reliable data delivery prior to operations at a global array. Two AUVs were launched and traveled pre-determined paths around the array before being recovered and having their data downloaded. While the team was following the AUVs to ensure the missions were progressing as planned, they encountered a pod of about 40 pilot whales that included both young and adult whales. The team and the pod of whales were equally fascinated by each other. Both groups stopped to observe the other’s behaviors.
[caption id="attachment_20931" align="alignleft" width="300"]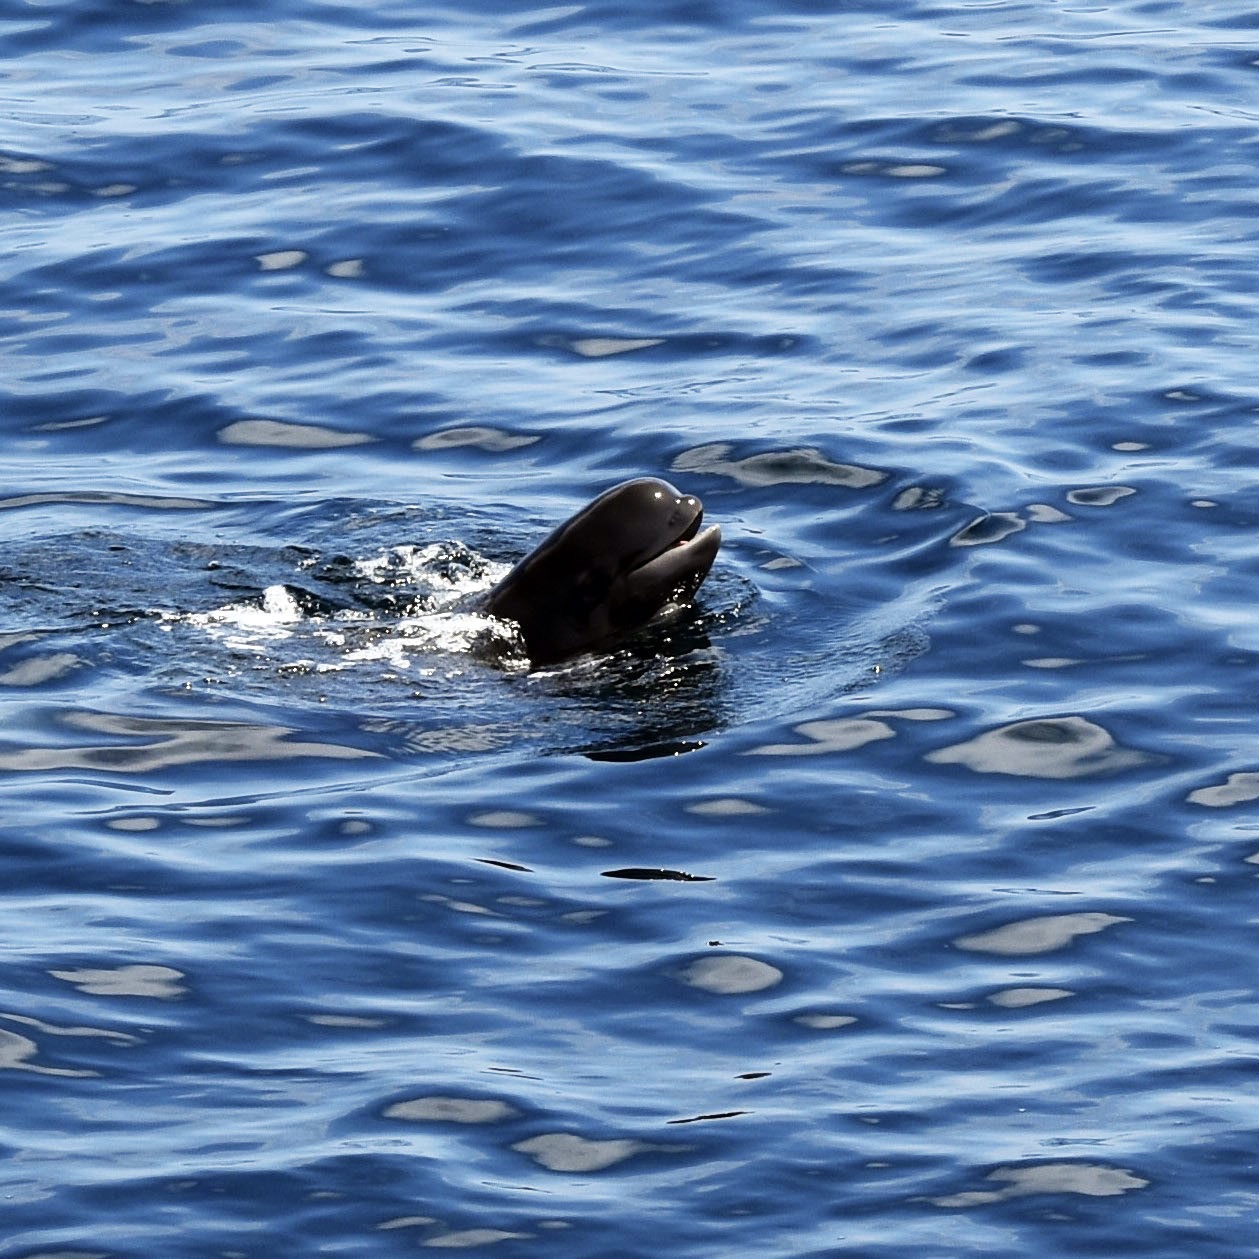 Photo: Rebecca Travis©WHOI.[/caption]
“The data we collect are helping scientists better understand the ocean environment and how it is changing. Seeing the pilot whales reminded us of the importance of these observations, and the research they enable, to the marine ecosystem.” added Plueddemann.
Read More
Assimilative Model Assessment of Pioneer Array Data
Adapted and condensed by OOI from Levin et al., 2020, doi:/10.1016/j.ocemod.2020.101721.
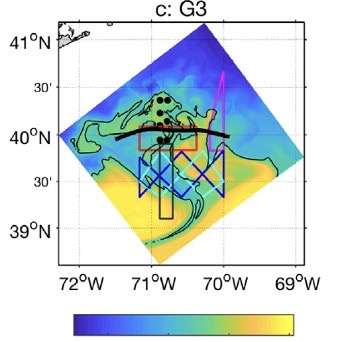
[caption id="attachment_21009" align="alignnone" width="974"]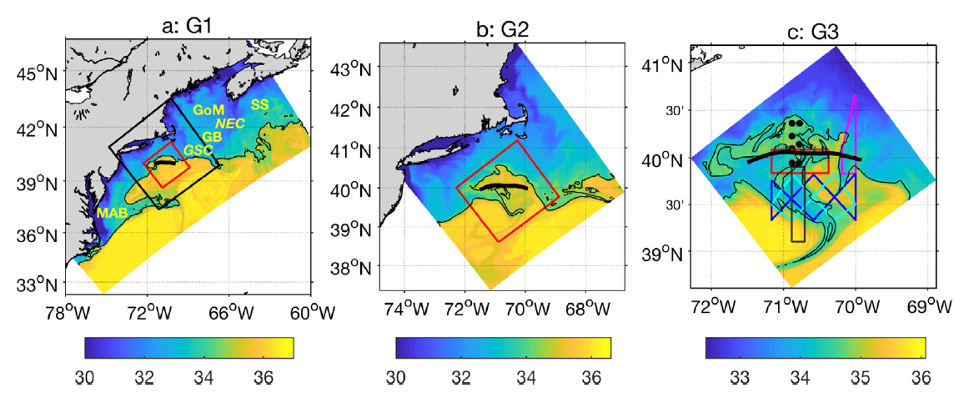 Fig. 1. Color contours of sea surface salinity from the model for three nested grids denoted a) G1, b) G2 (black square in (a)) and c) G3 (red square in (a), (b)). An indicator of frontal position (the 34.5 isohaline) is shown as a black contour. Cross-shelf exchange parameters are computed for an along-shelf section (thick black line). The Pioneer Array assets are shown in the G3 figure.[/caption]
Among the detailed analyses undertaken in this two-part study was quantification of the impact of observations on the reduction of RMS error for estimates of the volume transport across an along-front transect (Fig. 1). Temperature and salinity data from moorings and gliders were impactful for the larger grids (G1, G2). As the grid resolution was increased (G3), submesoscale motions were resolved and velocity data from the moorings became more important for reduction of error variance. An analysis of the sensitivity of shelf-slope exchange indices (e.g. volume transport) to removal of an observation, compared to the direct impact of the observation, showed that the majority of observed variables (e.g., SST, SSH, T, S, U, V) were “synergistic” – providing value to the assimilation through their connection with other variables as represented in the model dynamics. For the highest resolution estimates (G3 grid), the Pioneer Array observing assets were more impactful than other observations (e.g., remote sensing, NDBC and IOOS buoys) in reducing uncertainty, with velocity data being the major contributor. This is not a complete surprise, since the Pioneer Array was “tuned” to these scales. Still, it is gratifying to see that the impact on model fidelity is quantifiable.
The two-part study undertaken by Levin et al. provides a wealth of additional information about the performance of assimilative models as well as the utility of in-situ observations for modeling and prediction. As the authors state, they have “just begun to scratch the surface” of approaches that can be applied to the assessment of model performance as well as the management of observing systems.
Levin J., H.G. Arango, B. Laughlin, E. Hunter, J. Wilkin, and A.M. Moore, 2020. Observation impacts on the Mid-Atlantic Bight front and cross-shelf transport in 4D-Var ocean state estimates: Part I – Multiplatform analysis,Ocean Modeling, 156, 101721, 1-17, doi 10.1016/j.ocemod.2020.101721.
Read More
Pioneer Data Now on New Mariners’ Dashboard
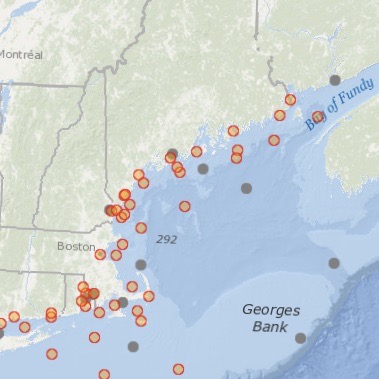
Data from three of the Ocean Observing Initiative’s (OOI) Pioneer Array buoys are now part of the Mariners’ Dashboard, a new ocean information interface launched by our partners at NERACOOS (Northeastern Regional Association of Coastal Ocean Observing Systems). Visitors can use the Dashboard to explore the latest conditions and forecasts from the Pioneer Inshore, Central, and Offshore mooring platforms, in addition to 30+ other observing platforms throughout the Northeast.
The Mariner Dashboard delivers high-quality, timely data from a growing network of buoys and sensors into the hands of mariners heading to sea. The data provided by the Pioneer moorings are particularly valuable because there are few other observing platforms in the highly traveled and productive shelf break region.
Observations provided range from air pressure and temperature, sea surface temperature, wave height, direction, velocity, and duration to salinity. Check out the Pioneer Array’s contributions to the wealth of information on the new Mariners’ Dashboard here:
[caption id="attachment_20963" align="alignleft" width="113"]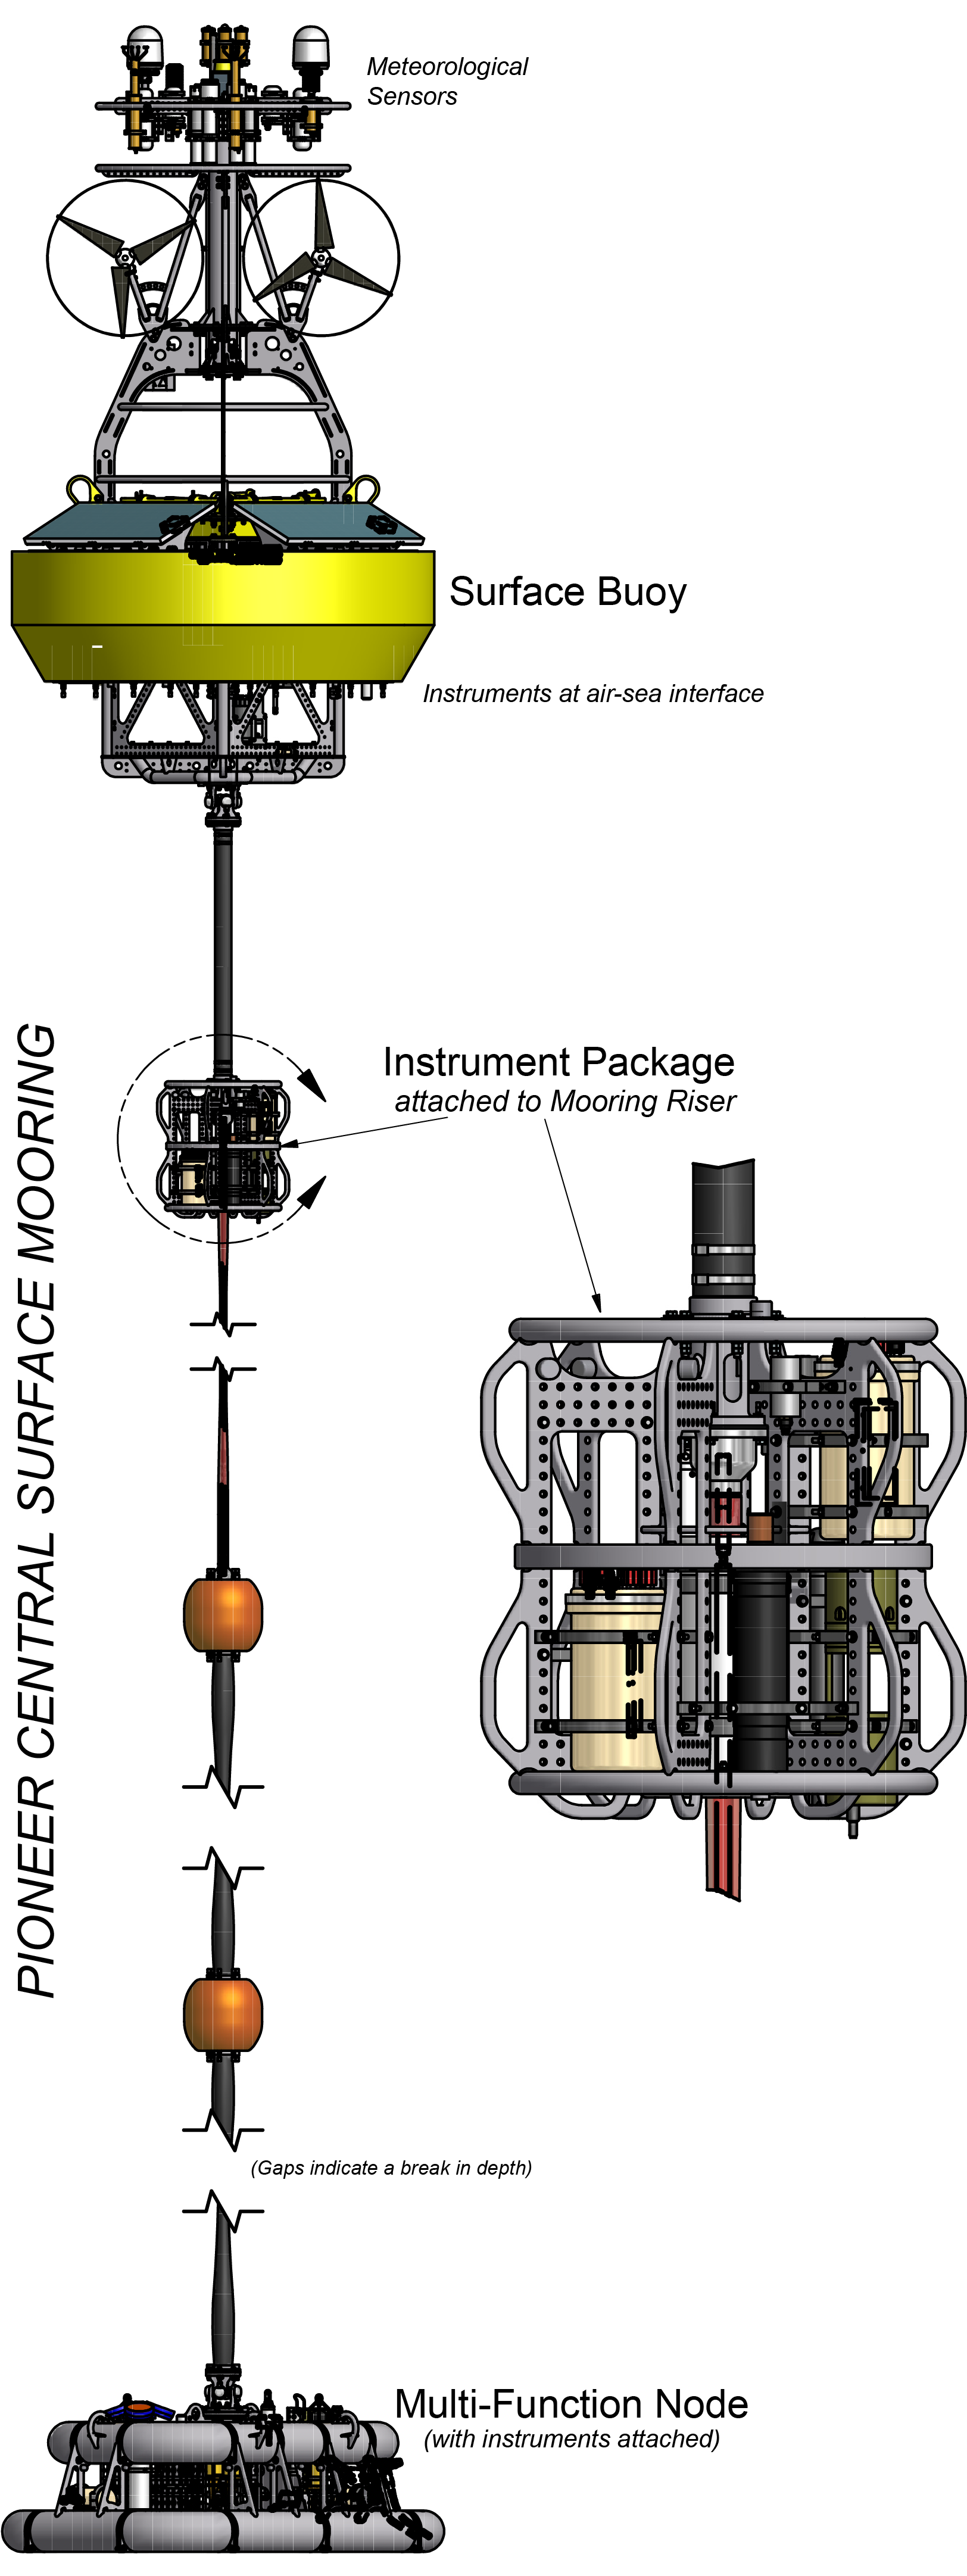 Components used to collect and transmit ocean observations to shore.[/caption]
Pioneer offshore https://mariners.neracoos.org/platform/44077
Pioneer central: https://mariners.neracoos.org/platform/44076
Pioneer inshore: https://mariners.neracoos.org/platform/44075
“We are pleased to see the Pioneer Array data being made more widely available through the Mariners’ Dashboard to help provide information about current ocean conditions,” said Al Plueddemann, head of the Ocean Observatories Initiative Coastal and Global Surface Nodes team, which includes the Pioneer Array. “This is just one example of how OOI data, which are freely available to anyone with an Internet connection, are being put to good use.”
Read More
Spring Expeditions: Keeping OOI Arrays Fully Operational
OOI teams were in the water on opposite coasts in late March to service the Pioneer and Endurance Arrays. The teams will “turn” the moorings (recover old and deploy new) to keep the arrays continually collecting and reporting data back to shore. This is the 14th turn of the Endurance Array; the 16th for the Pioneer Array.
The Endurance 14 Team set sail from Newport Oregon aboard the R/V Sikuliaq on 24 March for a 15-day expedition. The Pioneer 16 Team departed from Woods Hole, MA, a few days later on 29 March aboard the R/V Armstrong for a 21-day mission. Both expeditions will require two legs because of the need to transport a huge amount of equipment. The equipment for the Pioneer Array weighs more than 129 tons. The Endurance equipment tops the scale at 95 tons.
Departures for both teams occurred after arranging for reduced occupancy on site and social distancing during preparation, followed by 14 days of quarantine to meet COVID-19 restrictions. And while onboard, COVID has necessitated other changes ranging from smaller science parties to scheduled meal times to allow for social distancing.
“It is very impressive that the OOI team has been able to continue to service these arrays in spite of the challenges presented by COVID,” said Al Plueddemann, Chief Scientist of the Pioneer 16 Expedition. “The ocean is a tough environment in which to keep equipment operational, even in normal times. This year, in particular, has required both our shore-based staff and those onboard to be adaptable, flexible, and innovative to get the job done.”
[media-caption path="https://oceanobservatories.org/wp-content/uploads/2021/03/burnin_Travis.jpg" link="#"]The full cycle of preparation for an OOI mooring service cruise takes many months. The “burn-in” period for Pioneer-16, during which equipment is assembled and tested, began in January 2021 with snow on the ground outside of the LOSOS building on the WHOI campus. Credit:Rebecca Travis © WHOI.[/media-caption]In addition to the mooring and deployment recoveries, both teams are deploying and recovering gliders that collect additional data within the water column and the area between the moorings. They also are conducting CTD casts and water sampling at the mooring sites, and doing meteorological comparisons between ship and buoys. The Pioneer Team will be operating autonomous underwater vehicles (AUVs), while the Endurance Team will have its inaugural use of OOI’s own remotely operated vehicle (ROV) to recover anchors at the Oregon shelf site.
“In normal times, we would invite external students and scientists along to conduct ancillary experiments on the cruise,” said Edward Dever, Chief Scientist for Endurance 14. “But given the limited science party allowed onboard due to COVID-19, the OOI team will be conducting some of this additional work to ensure the continuity of these experiments.”
For Endurance 14, this work includes collection of organisms that grow on panels attached to Endurance buoys for invasive species research, collection of settling organisms on devices attached to Multi-Function Nodes, which power near bottom data instruments, and test deployments of tagged fish acoustic monitors on near surface instrument frames on three moorings.
Likewise, the Pioneer 16 Team is helping ensure ongoing science investigations installing and operating unattended underway sampling for the Northeast U.S. Shelf Long-Term Ecological Research (LTER) project and conducting CTD casts at LTER sites during the cruise. They will also conduct communication tests at the Offshore mooring site in support of the Keck-funded 3-D Acoustic Telescope project.
Science teams of 9-10 people on each cruise are sharing the multitude of tasks needed for the moored array service.
[media-caption path="https://oceanobservatories.org/wp-content/uploads//2021/03/Screen-Shot-2021-04-01-at-9.19.20-AM.png" link="#"]OOI’s remotely operated vehicle will be used for the first-time during Endurance 14. Credit: Seaview Systems.[/media-caption]
Read More
Potential Pioneer Relocation Innovations Lab on March 15-19
In 2021, the Ocean Observatories Initiative Facilities Board (OOIFB) and the National Science Foundation (NSF) launched a process to consider whether to move the Pioneer Array from its current location, on the New England shelf and slope south of Martha’s Vineyard, to a new site. Selection of the next OOI Pioneer Array location, or decision to maintain the Array at its current location, will be driven by community input on the important science questions that can be addressed by the Pioneer Array.
The OOI community has been invited to weigh in on this important decision during a two-phase sequential lab approach that is bringing together scientists, educators, and other stakeholders together virtually to evaluate 1) future location options for the Pioneer Array and 2) new design considerations that can enable exciting research endeavors at the chosen location.
The Phase 1 Innovations Lab will be held on March 15-19 to explore possible locations for the Pioneer Array based on multiple factors, driven by scientific questions that require an ocean observatory to advance knowledge. At the Lab, interdisciplinary teams will work together to ideate and develop a roadmap of possible locations including exploring new scientific, educational, and partnership opportunities. Participation was open to the all, and 32 applicants were selected to participate in this important decision.
The Phase 2 Innovations Lab, in late spring/early summer, will come up with a plan to maximize the science gains and broader impacts of the potential new site. If a new site is recommended, the Array would be moved in 2023. The OOI Coastal and Global Scale Nodes (CGSN) Team at Woods Hole Oceanographic Institution would continue the operation and maintenance of the array, regardless of its location.
The Lab’s findings will be considered by an NSF review panel, which will report to NSF in early fall on the new Pioneer Array location and how it can be optimized for science and education. The findings of both Innovations Lab will be shared with the OOI community.
Read MorePotential Pioneer Relocation Innovations Lab Phase 1
The Pioneer Array was designed as a moveable array. The OOI community has been invited to participate in the decision regarding the Pioneer Array’s future location. Selection of a new OOI Pioneer Array location will be driven by community input on the important science questions that can be addressed with observations from a new Array location or maintaining it in its current location. The first of a two-phase Innovations Lab will bring together scientists, educators, and stakeholders to explore possible locations for the Pioneer Array. During the week of March 15-19, interdisciplinary teams will work together to ideate and develop a roadmap of possible locations including exploring new scientific, educational, and partnership opportunities.
Read More