Posts Tagged ‘data explorer’
Live Data Demos at OOI Booth#210
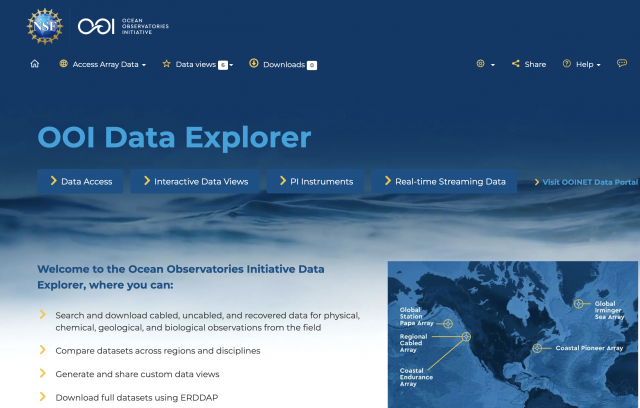
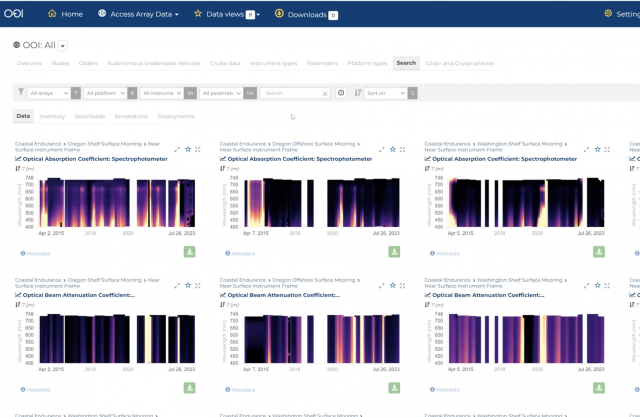
Join OOI data expert Stace Beaulieu at the Ocean Sciences Meeting as she demonstrates how to use Data Explorer to find, compare, and share OOI data. During each session, Stace will use data from a different OOI array to demonstrate the breadth and depth of data available and how easy it is to access, download, and use. She will demo Data Explorer, followed by plenty of time to answer your questions and use this tool to explore data relevant to your research. On Wednesday morning, she’ll demo JupyterHub so you will have another tool to use OOI data in your research.
Mark your calendar, as follows, and come visit Stace at OOI’s booth #210 at the Ocean Sciences Meeting February 19-22, 2024.
Find, compare, and share OOI data
- Monday Feb 19
3:30-4:00 pm
Global Irminger Sea Array - Tuesday Feb 20
10:00-10:30 am
Coastal Endurance Array
3:30-4:00 pm
Coastal Pioneer New England Shelf Array - Wednesday Feb 21
10:00-10:30 am
JupyterHub demo for AUV data from Coastal Pioneer New England Shelf Array
3:30-4:00 pm
Global Southern Ocean Array - Thursday Feb 22
10:00-10:30 am
Regional Cabled Array
A complete list of OOI-related events at the Ocean Sciences Meeting 2024 can be found here.
Read More
Demo of Data Explorer New Features Video Available
In case you missed the latest demonstration of the newest features of Data Explorer, you can watch it here. Axiom Data Science Senior Software Engineer Brian Stone and OOI’s Senior Manager of Cyberinfrastructure Jeffrey Glatstein explain the latest additions to Data Explorer include a beta display of high-definition video streams, additional differentiation between the Axial Seamount and Oregon Margin Regional Cabled Array Assets, human-in-the-loop quality control flag display, and two ADCP instruments that were previously not visualized.
[embed]https://youtu.be/BcMi3lHSUB0[/embed] Read MoreOOI Virtual Town Hall: Demo of Data Explorer Latest Features
Join Axiom Data Science Senior Software Engineer Brian Stone and OOI’s Senior Manager of Cyberinfrastructure Jeffrey Glatstein as they demonstrate the latest features of Data Explorer and answer your questions about how you might use their features in your research. Advance registration needed. Please register here.
Read MoreFour-Part Series on Using Data Explorer
OOI Data Specialist Stace Beaulieu has put together a four part-series demonstrating how to use Data Explorer. In eight minutes or less per session, you can learn how to find and visualize time-series, glider, or profiler data and compare time-series data. The demos can be accessed below, on YouTube, and permanently under Tutorials on this website. Be sure to bookmark the site for future reference. A print version of the four-part series can be accessed and downloaded here.
[embed]https://youtu.be/9CA5GsGL2-0[/embed] [embed]https://youtu.be/SEwHMSyQFUg[/embed] [embed]https://youtu.be/smrSszcO4RY[/embed] [embed]https://youtu.be/ql8JvTGyrmI[/embed] Read MoreNew Features of Data Explorer Demo
In case you missed it, here is a video of the OOI Town Hall on July 26, 2023 during which the new features of Data Explorer were demonstrated and questions answered.
[embed]https://vimeo.com/849129117[/embed] Read MoreData Explorer Town Hall July 26 to Demo New Features
Mark your calendars for July 26, 2023 at 1 pm Eastern for an OOI Town Hall to demonstrate the new features of Data Explorer. Register for the Demo Town Hall here.
The latest Data Explorer, version 1.5, includes a significant expansion of data availability, updates to a viewer for underway still images, and introduces a beta version of real-time streaming for cabled instruments. Version 1.5 offers new scientific data for Autonomous Underwater Vehicles (AUV) and Bio-Acoustic Sonar (ZPLS) instruments and Principal Investigator-added instrument data are now available on the site. Visitors to the site will experience optimization and new viewing capabilities for still and animated images. Additionally, data are streamed in real-time by the second for cabled instruments in the Regional Cabled Array, giving users the most up-to-date information available.
Axiom Chief Operating Officer Stacey Buckelew and OOI Senior Manager of OOI Cyberinfrastructure and OOI Data Lead Jeffrey Glatstein will demo the new features and there will plenty of time for questions. For those unable to attend the live demonstration, the demo will be archived and available for viewing at a later date.
The new features were formally launched on May 30,2023. Further details about the new features and launch are available here.
Read More
.MOV Files to be Archived at Beginning of 2024
High resolution .MOV files from the Regional Cabled Array’s (RCA) high-definition video camera older than a year will be transferred to a deep archive beginning January 2024. More recent .MOV files up to a year old will remain available for immediate download from the raw data server, while the same files in the smaller .MP4 file format will always be available the raw data server. Once archived, the .MOV files will remain accessible via a request rather than a simple download.
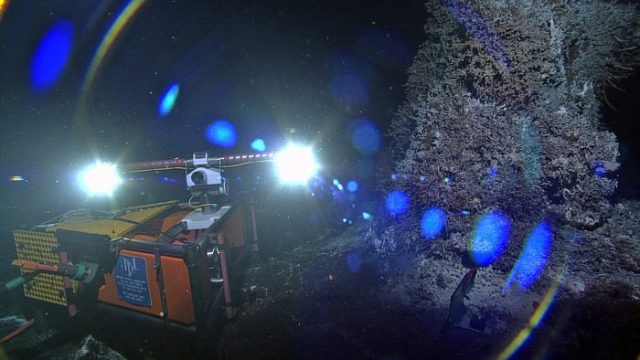
Daily live video streams from the RCA’s camera document the active hydrothermal vent called “Mushroom” in the ASHES hydrothermal field atop Axial Seamount. Scientists are using recordings of the HD video to examine the evolution of the chimney, concomitant changes in the rich biological community that it hosts, and the flow of fluids out of the chimney over time.
[media-caption path="https://oceanobservatories.org/wp-content/uploads/2023/05/J1262_20200806145917_CAMHD-copy.jpg" link="#"]The high definition camera lights up the Mushroom hydrothermal edifice. Credit: UW/NSF-OOI/WHOI. V20.[/media-caption]The .MOV archiving plan is part of an overall plan to store OOI data efficiently and securely to ensure that OOI data users have access to both near real-time and historical data. The plan is important as OOI will eventually need to store and distribute 30 years of data.
“This is really a behind-the-scenes housekeeping issue for most of our data users. But for those interested in having the historical .MOV files readily on hand, we are encouraging them to download footage over the next seven months” explained Craig Risien, Project Manager for the OOI Data Center. “The plan is to archive .MOV files older than one year on a rolling monthly basis. The .MP4 versions of the .MOV files will always be highly available so people will still be able to view and download the footage, they just won’t have instant access to archived high resolution .MOV files.”
For now, users can directly download the .MOV files. Once the archiving process is initiated at the beginning of 2024, a process will be in place to request the archived files.
“We want to give people a long lead time regarding this change so they have adequate time to download whatever .MOV footage they need,” added Risien. “We will have more information about the archiving process as the implementation date draws nearer.”
Read More
Latest Version of Data Explorer Launched May 30
OOI’s Data Science Team, working with Axiom Data Science, announced additional improvements to OOI’s data access and visualization tool, Data Explorer will publicly launch on May 30, 2023. The latest Data Explorer, version 1.5, includes a significant expansion of data availability, updates to a viewer for underway still images, and introduces a beta version of real-time streaming for cabled instruments. Version 1.5 offers new scientific data for Autonomous Underwater Vehicles (AUV) and Bio-Acoustic Sonar (ZPLS) instruments and Principal Investigator-added instrument data are now available on the site. Visitors to the site will experience optimization and new viewing capabilities for still and animated images. Additionally, data are streamed in real-time by the second for cabled instruments in the Regional Cabled Array, giving users the most up-to-date information available.
“A great deal of effort goes on behind-the-scenes to make Data Explorer be responsive to users’ needs and provide seamless, quick access to data,” explained Jeffrey Glatstein, Senior Manager of Cyberinfrastructure and OOI Data Delivery Lead at Woods Hole Oceanographic Institution. “We are grateful to our team and the developers at Axiom who continually make this already great tool, even better.”
Details about the new features are included in the following:
New Features
ZPLS instrument data will now be online for more locations, including the Coastal (Endurance) and Global Arrays (Argentine Basin). This is the first time this type of OOI bioacoustics sonar data have been available in an interactive visualization. This version addressed feedback received from subject matter experts to improve the data charts, including respecting time selections among sonar frequencies, changing variable names, and addresses frequency sorting. Other technical fixes have been made to the backend in response to users’ suggestions, which will help make these data more accessible.
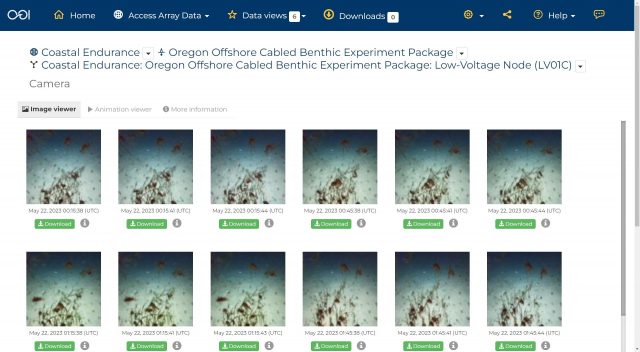
[media-caption path="https://oceanobservatories.org/wp-content/uploads/2023/05/1_1.5_zpls.jpg" link="#"]An example echogram from the bioacoustics sonar instrument on the Coastal Endurance array. The bio-acoustic sonar measures acoustic signals of plankton and zooplankton using sound waves which bounce off organisms back towards the sensor in a phenomenon known as “backscatter.”[/media-caption] [media-caption path="https://oceanobservatories.org/wp-content/uploads/2023/05/2_1.5_auv.jpg" link="#"]An example of interactive AUV data at the Coastal Pioneer Array in the Data Explorer. The travel trajectory of the AUV across the shelf-break is shown in the map. Data collected by the instrument as it dives from the sea surface to a maximum depth of 600m is shown in the chart on the right. Users can visualize data in 3-D across the water column in the lower interactive chart.[/media-caption]A media server will now be up and running on Data Explorer. In this version, updates have been made to improve the performance of the still image viewer. All image collections are shown in a Grid view which makes seeing what is available easier. Camera metadata is now available via a more information tab. Images will also be available on the pages included in time series. Images will also be available as a single image or in animation viewer. Full size images are presented with an image scale and available for download.
[media-caption path="https://oceanobservatories.org/wp-content/uploads/2023/05/3_1.5_image-viewer.jpg" link="#"]Cameras are attached to instruments on the cabled infrastructure of the OOI Regional Cabled Array. These long-term imagery records are now available in the Data Explorer for viewing and download to help understand life in deep water and coastal environments. The camera at Endurance Offshore is designed to look at the seafloor in general, observing animal activity, sediment transport, detritus falls, and bioturbation.[/media-caption] [media-caption path="https://oceanobservatories.org/wp-content/uploads/2023/05/4_1.5_image-viewer.jpg" link="#"]The media viewer in the Data Explorer allows users to pan and expand images, select images across a timeseries, view camera metadata, download images, and animate images across time.[/media-caption]Another added beta media feature is real-time streaming of Cabled Array instrument data. The design of this function is meant to be user-friendly. A Grid view shows available real-time streaming instruments. A Single view shows a real-time streaming chart, with data from the last 24 hours. These features are available from Data Explorer’s landing page with further explanations of what data are available and when.
Added Glatstein, “We invite all OOI data users to try out these new components and continue to provide us feedback. We are particularly eager to hear the community’s response to the beta version of the media server so we can tweak that as needed.”
[media-caption path="https://oceanobservatories.org/wp-content/uploads/2023/05/5_1.5_real-time.jpg" link="#"]An example of real-time streaming data now available for instruments on the Regional Cabled Array. This network of >100 cabled instruments and instrumented moorings transmit data to shore in real-time via fiber optic technology. Users can view and interact with new data every second as it is streamed from the deep ocean to shore.[/media-caption]
Read More
Data Explorer Receives Environmental Business Journal Award
The Environmental Business Journal (EBJ) recognized the Ocean Observatories Initiative’s (OOI) Data Explorer’s ability to manage and visualize data with one of its annual awards for Information Technology.
Tetra Tech will accept the award at the EBJ awards ceremony in March 2023 for its role in designing open-source software to support the management, accessibility, and visualization of ocean data. Axiom Data Science, a Tetra Tech company, worked with the OOI Cyberinfrastructure team to develop both front-end and back-end systems for data management and visualization of OOI data feeds.
The OOI, funded by the National Science Foundation, delivers real-time data from sensors in the Atlantic and Pacific Oceans to address critical questions regarding the world’s oceans. Axiom Data Science played a foundational role in designing and operationalizing the Data Explorer, the primary gateway for discovering, visualizing, and accessing OOI data. The Data Explorer makes it possible to search across data points, download full datasets, and compare datasets across regions and disciplines for more than 900 instruments in near real-time. In 2022, Axiom Data Science upgraded the OOI cyberinfrastructure to improve the OOI’s ability to serve ultra-high resolution data streams from next generation ocean instrumentation that span the ocean floor to the sea surface.
“We are honored to have worked with Axiom Data Science to make OOI’s vast amount of data accessible and useable and congratulate them on this recognition of their exceptional work,” said Jeffrey Glatstein, OOI’s Data Delivery Lead and Senior Manager of Cyberinfrastructure. “The capabilities of Data Explorer are only beginning to be realized and will serve the ocean community for years to come.”
Read More
Video Demo about Using QARTOD Flags for OOI data
Woods Hole Oceanographic Senior Research Specialist Stace Beaulieu presents a demonstration on how to explore and visualize data for the Ocean Observatories Initiative (OOI) in Data Explorer, with an emphasis on Quality Assurance of Real-Time Oceanographic Data (QARTOD) flags. In this example, we use QARTOD flags in Data Explorer to rapidly identify a time period of interest and then access those data from ERDDAP.
https://vimeo.com/user110037220/qartod
Read More


