
Posts Tagged ‘Data’
New Data Explorer Tool Coming Online in October
To help make OOI data more accessible, useable, and easily integrated into research and classrooms, the OOI data team has spent the last year developing a new tool that will allow users to discover the data required to meet their needs. The new “Data Explorer” has been undergoing user testing for the past three months and will be ready for broad distribution in early October.
Data Explorer will allow users to search and download cabled, uncabled, and recovered data, compare datasets across regions and disciplines, generate and share custom data views, and download full data sets using ERDDAP.
“We are really excited about the launch of Data Explorer version 1,” explained Jeffrey Glatstein, head of OOI’s cyberinfrastructure, who guided a team of data and visualization experts in developing the tool. “It is an excellent tool that offers a variety of ways for researchers, educators – and others interested in ocean observations—to use OOI data to answer their ocean observation data questions. What we’ve learned over the test period is that additional refinements will be needed, but we first want input from the community, to help identify and prioritize the most important ones. Subsequent versions will build upon this first release to make the Data Explorer the primary tool to explore OOI data.”
Data Explorer contains physical, chemical, geological, and biological ocean observation data collected in near real time. Glatstein and the OOI Data Team worked with Axiom Data Science to develop a system that is both powerful yet user friendly.
Stay tuned. The launch is set for the beginning of October 2020.
Read More
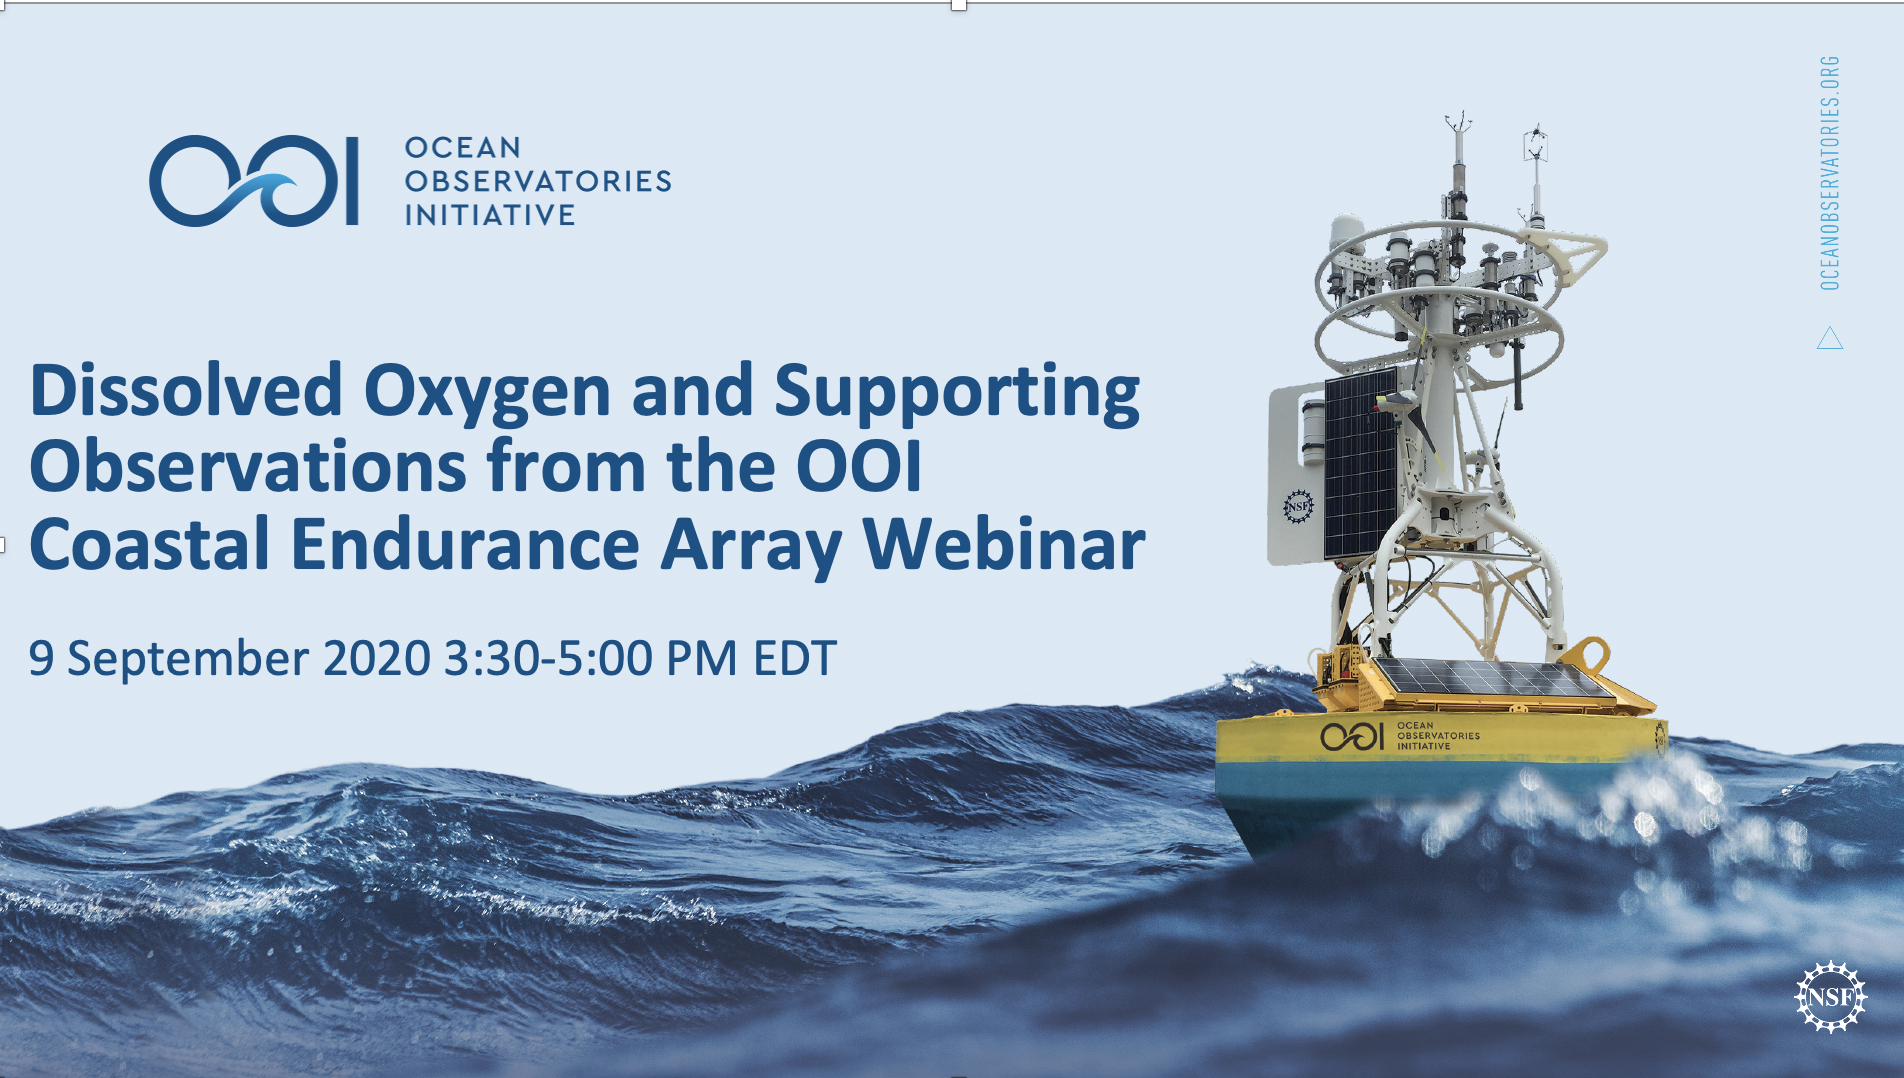
Mark Your Calendar: Dissolved Oxygen Webinar, 9 September 2020

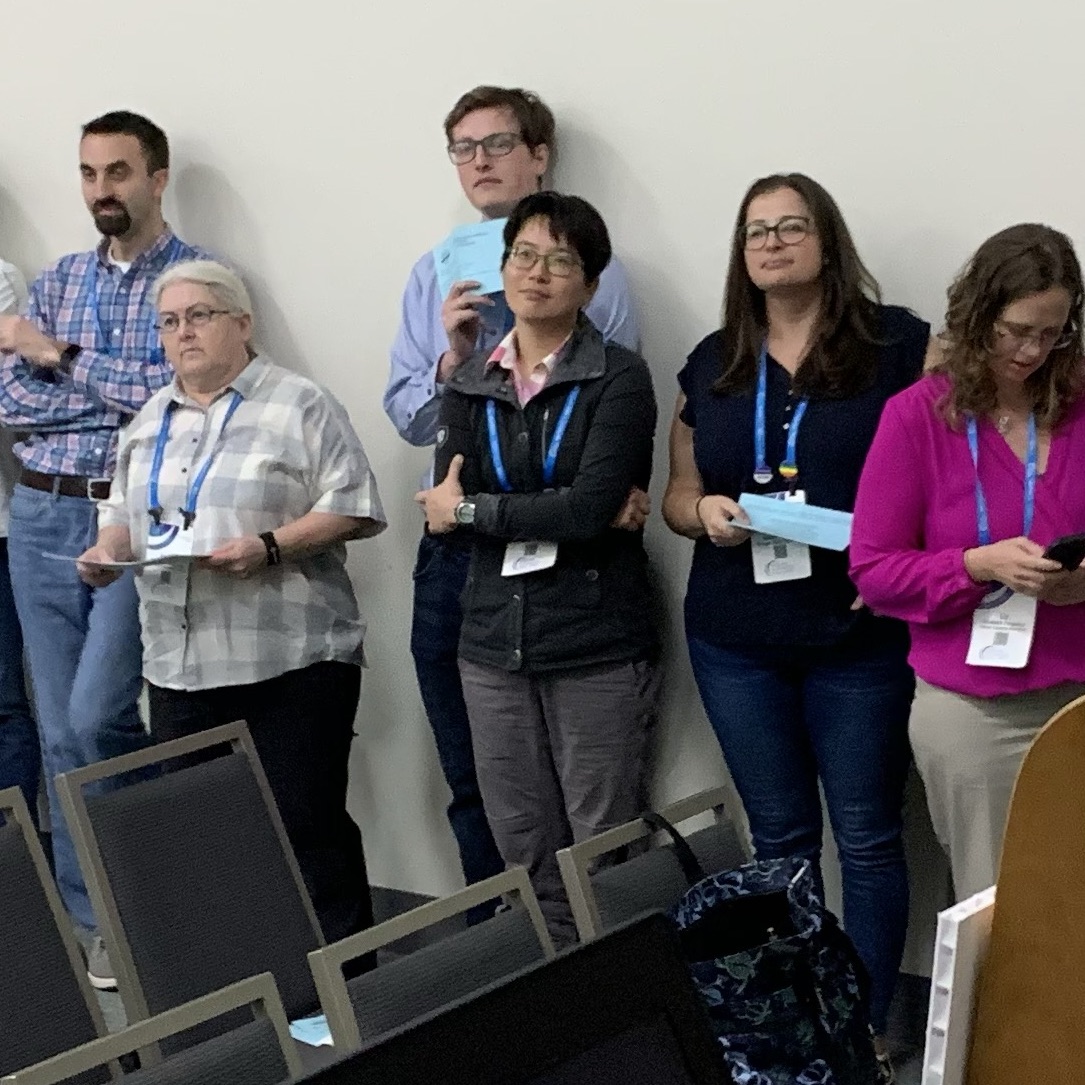
 Coastal Endurance Array webinar presenters: Ed Dever, Chris Wingard, Stuart Pearce, Craig Risien, Jonathan Whitefield, and Jon Fram[/caption]
In this webinar, we present dissolved oxygen (DO) data from the Ocean Observatories Initiative’s (OOI) Coastal Endurance Array off Oregon and Washington. DO is recorded on platforms across OOI. These measurements contribute directly to the OOI science goal of understanding ecosystem changes. The Endurance Array measurements contribute specifically to understanding the seasonal development and synoptic variability of hypoxia. DO measurement platforms on EA include moorings, gliders, and profilers.
The webinar will be presented in four pre-recorded sections with a live Q and A following each section. In part one, we will provide an overview of OOI DO measurements across OOI. The remaining three parts will cover surface mooring time series, glider measurements, and profiler measurements respectively. For each of these platforms, we will describe the sampling, review quality control procedures and issues, and present example plots. We will focus on recent data, including telemetered data collected since the latest Endurance cruise in July 2020. We will present the DO time series, along with related observations of wind velocity and ocean temperature.
Please register in advance for this webinar here. After registering, you will receive a confirmation email containing information about how to join the webinar.
The webinar sections will be posted to oceanobservatories.org. Pre-registered webinar participants can sign up for follow-up discussions on accessing these OOI data on 10 September. Individuals can also contact the OOI HelpDesk and set up similar discussions at a later date.
Read More
Invitation to Integrate OOI Data into Teaching
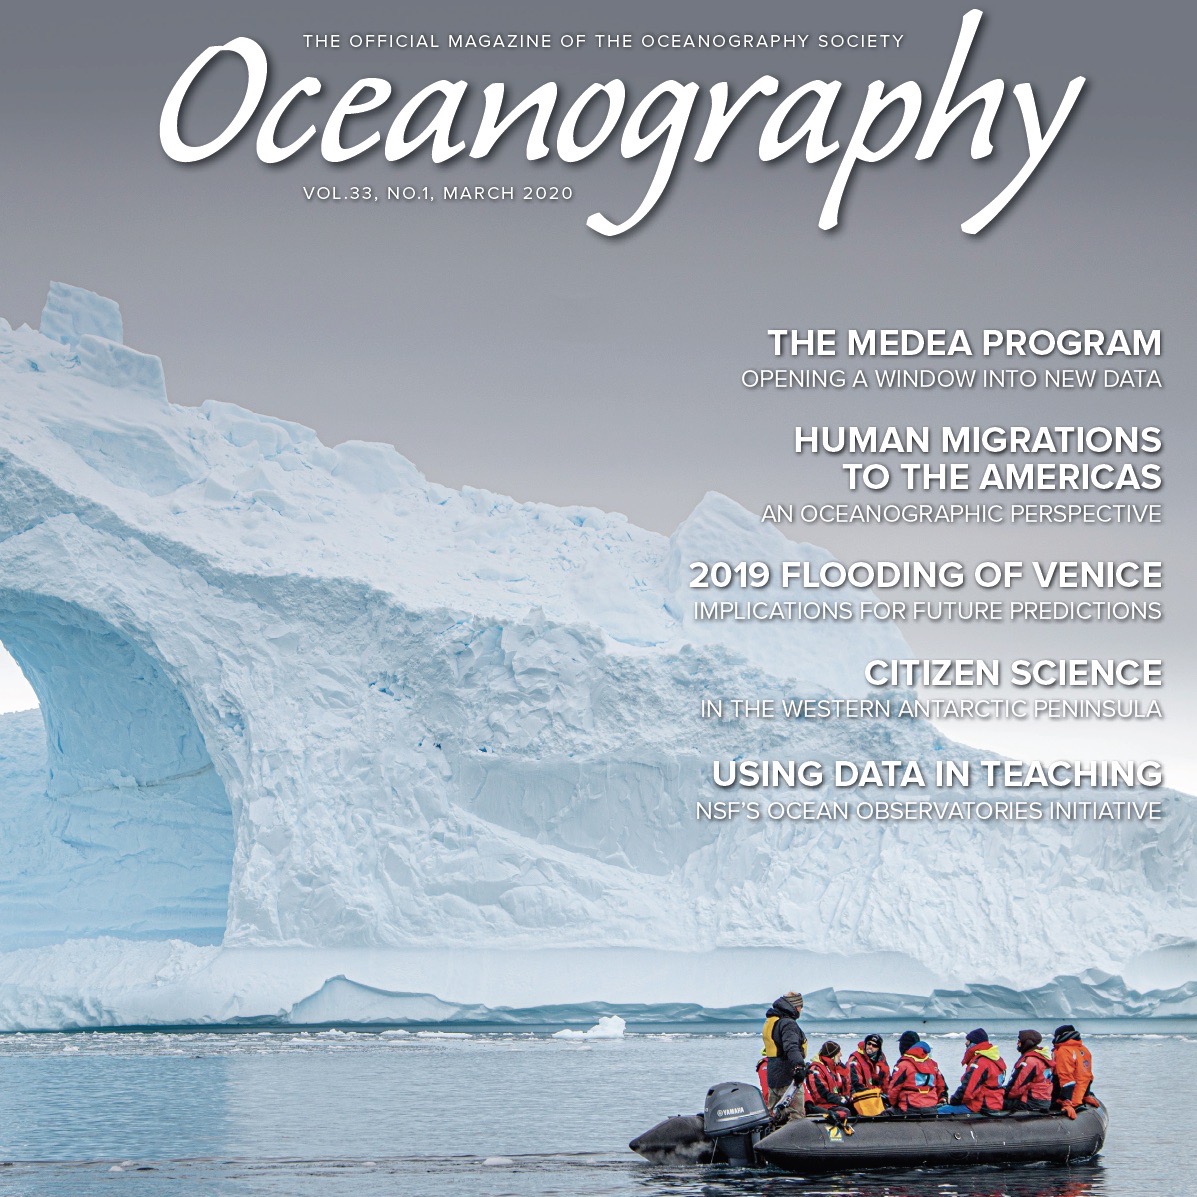
In the March 2020 issue of Oceanography, a group of authors issued an invitation to undergraduate classroom instructors to integrate OOI data into their classrooms.
Abstract
There are many benefits to using real data in undergraduate science education, including building analytical and problem-solving skills and visualizing concepts through real-world examples. The Ocean Observatories Initiative (OOI) provides a unique source of continuous, long-term oceanographic data from multiple locations in the world ocean. Each of these arrays hosts a suite of co-located instruments that measure physical, chemical, geological, and biological properties. Existing educational resources derived from OOI data can be leveraged for undergraduate teaching activities in and beyond the classroom. We provide example applications of the use of OOI resources in lesson plans and in research experiences for undergraduates. There are also abundant opportunities for new resources to be developed by the community. Our goal is to guide educators in determining appropriate OOI data sets and applications for their own needs.
Read the complete article Using Authentic Data from NSF’s Ocean Observatories Initiative in Undergraduate Teaching: An Invitation here.
Read MoreReady-to-use Educational Datasets Available
A new website of curated OOI datasets, called Data Nuggets, has launched. It contains valuable resources ready for integration into educational activities. The nuggets explore various concepts common in upper-level high school and introductory college courses and are designed and packaged to be readily accessible to educators to integrate into their existing curricula. Datasets were selected based on their quality and alignment with a broader OOI Science Theme.
 The nuggets were created as part of the National Science Foundation-funded OOI Synthesis & Education project, Ocean Data Lab, conducted by Rutgers University and led by the Consortium for Ocean Leadership.
For now, four data nuggets are available:
- 2015 Axial Seamount Eruption
- Seasonal Phytoplankton Blooms at High Latitudes
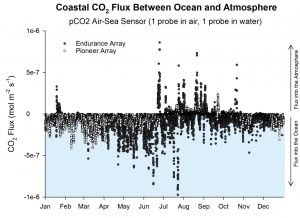
- Flux of CO2 Between Ocean and Atmosphere
- Seasonal Mixing of the Irminger Sea Water Column
The material provided in each nugget ranges from a description of scientific relevance to high resolution graphs to how use Python to pull and use OOI data in the classroom. The nuggets are designed to support educators as they design their own activities using OOI data.
More nuggets will be continually added so check the website often.
Read More
Altered Carbon: Improvement to CO2 Measurements Enhance OOI Data Quality
Global carbon dioxide (CO2) concentrations are increasing in the atmosphere, largely due to the use of fossil fuels. The oceans are absorbing about 25-30 percent of the atmospheric CO2, resulting in a shift in seawater acid-base chemistry and a decrease in ocean pH, making seawater more acidic. To help scientists assess this changing ocean chemistry, the Ocean Observatories Initiative (OOI) uses the Sunburst SAMI-CO2 instrument to measure the partial pressure of carbon dioxide (pCO2) from 150-700 microatmospheres (μatm) in the upper 200 meters of the water column.
The distribution of pCO2 in seawater is dependent on gas exchange with the atmosphere at the ocean surface, the breakdown of plant material by microbial processes, and removal by photosynthesis, calcium carbonate formation, and rising temperatures. Increases in pCO2 can also be caused by dissolution of calcium carbonate, which is of particular importance because calcium carbonate minerals are the building blocks for the skeletons and shells of many marine organisms, such as oysters.
Using the SAMI-CO2 instrument, OOI researchers determine the partial pressure of CO2 by equilibrating a pH sensitive indicator solution (Bromothymol Blue) to sampled seawater. Aqueous carbon dioxide in seawater diffuses across a permeable silicone membrane equilibrator within the instrument, which changes the color of the indicator solution from blue to yellow. The equilibrated indicator solution is then pumped through a chamber where light passes through the liquid and into a receptor that uses the wavelength to determine the amount of color change, and thus the amount of CO2 dissolved in the water.
“The OOI system parses the raw data from the instrument, applies a ‘blank’ value to correct for instrument drift, and then delivers calibrated pCO2 data to users on demand,” explained Michael Vardaro, OOI Research Scientist at the University of Washington. “We recently created a fix to apply the correct ’blank’ values to the pCO2 data to improve data accessibility and data quality.”
Blank values (e.g., optical absorbance ratios in the pco2w_b_sami_data_record_cal data stream) are used to calculate the data product “pCO2 Seawater (µatm)” at a specific timestamp. Blank values, however, are recorded intermittently to correct for drift of the electro-optical system, about once a week, which is a longer interval than the instrument sampling rate of one sample per hour.
The recent correction will ensure that any pCO2 data request will use a linearly interpolated value from the closest blanks if no blank value is found within the requested time range. This means that for an hourly pCO2 measurement that falls between weekly blank values the system will calculate the appropriate drift correction to apply based on the surrounding blank values, instead of trying to find a specific blank value that might be outside the date range of the requested data. In addition to improving data quality, this fix prevents the system from returning fill values or empty datasets. Additional restrictions were put on data delivery to prevent interpolation across deployments, which could pull blanks from different instrument serial numbers, potentially creating bad data. These fixes apply to all OOI pCO2 data. Users who have pCO2 data products generated prior to 4 February 2020 are encouraged to re-request their data to ensure that the correct interpolation code is applied.
Any questions about this data fix, or any other OOI data issues, should be directed to help@oceanobservatories.org.
Images
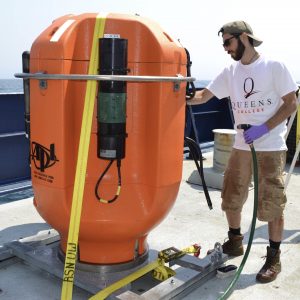
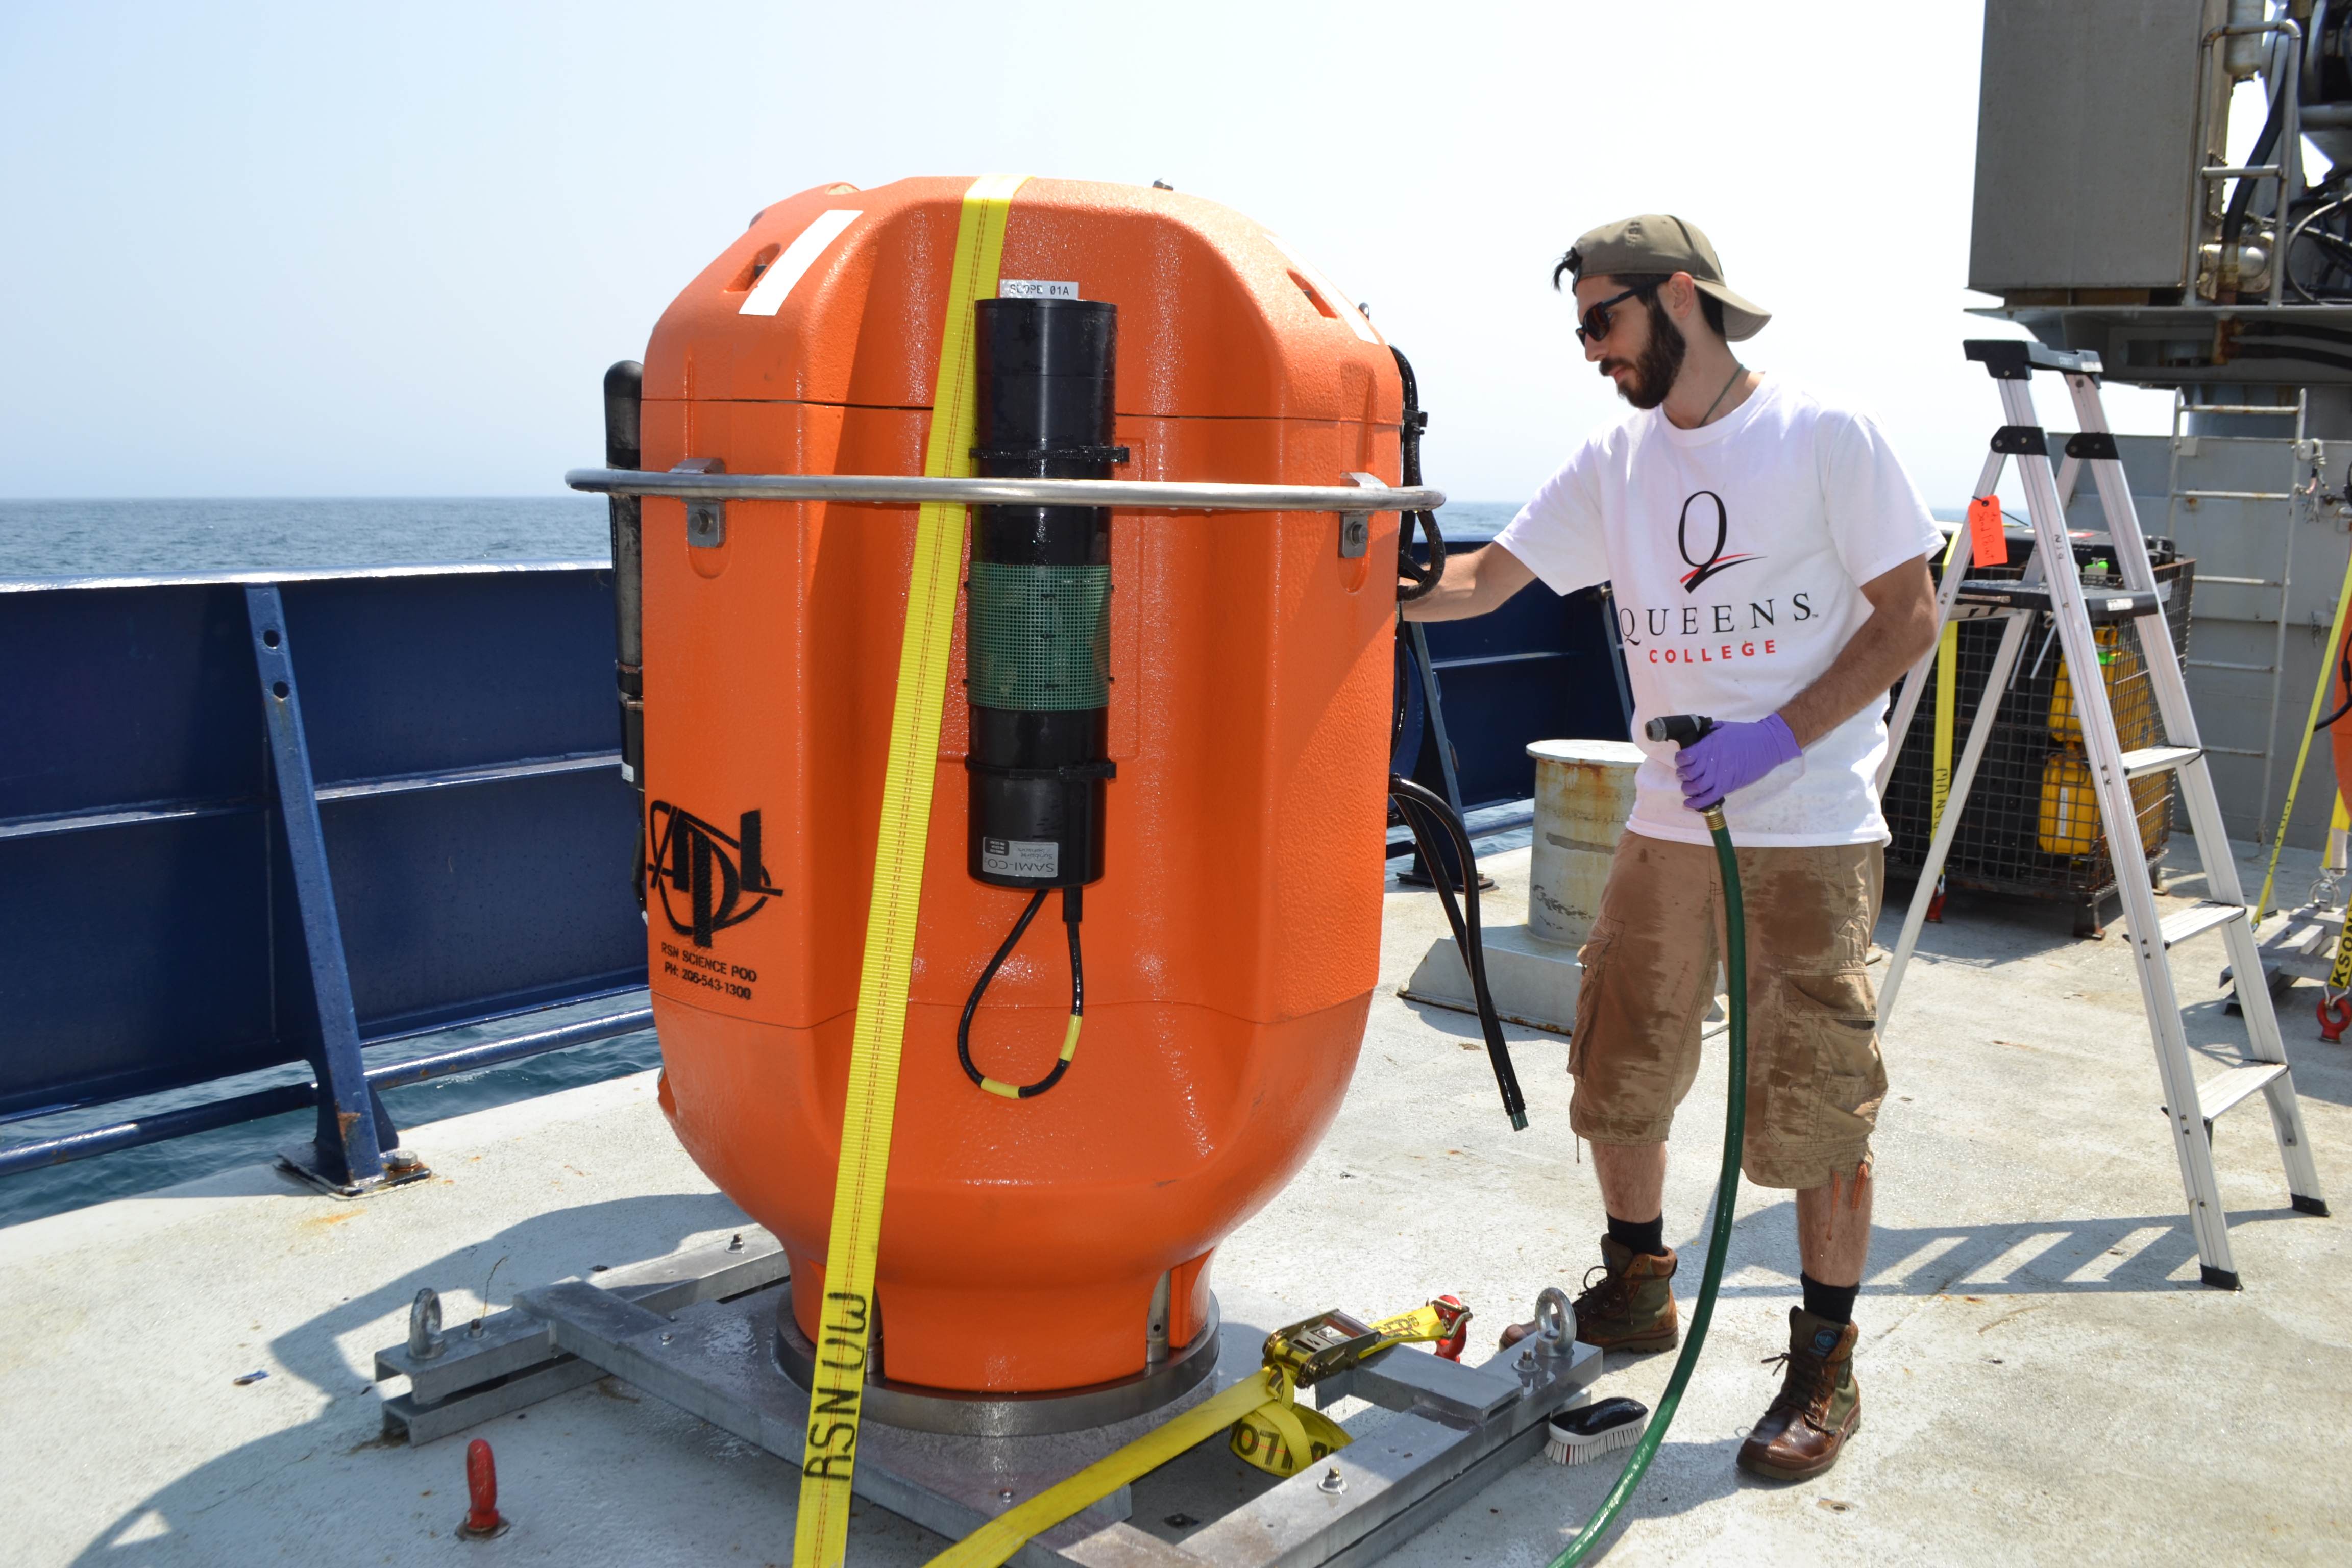
Top: Alex Andronikides, a VISIONS’17 student from Queens College, New York helps clean a Regional Cabled Observatory Shallow Profiler Mooring science pod that was installed off the Washington-Oregon coast. Credit: M. Elend, University of Washington, V17.
Bottom: Pre-deployment photo of a Sunburst SAMI-CO2 sensor attached to the Oregon Offshore Cabled Shallow Profiler pod, which moves up and down in the water column between 200 meters and near the surface off the coast of Newport, OR. Credit: M. Elend, University of Washington, V19.
Read MoreA Hat for a New Name
In July, OOI will launch the Beta version of our new and improved data discovery tool. We are asking for the community’s help in naming the tool, which will make it possible to:
- search and download data from cabled and moored arrays and recovered data from for in situ physical, chemical, geological, and biological observations
- compare datasets across regions and disciplines
- generate and share custom data views
- download full data sets using ERDDAP
Want to take a crack at coming up with a name? The selected winner will receive an OOI hat in recognition of his/her creativity. If there is more than one winner, each will receive an OOI hat.
The deadline for submission is 15 May 2020. Please submit your nominations to dtrewcrist@whoi.edu, with subject line: “I deserve a hat!
Read MoreEasy-to-use MATLAB Data Tools
OOI data team members have developed a new toolbox for downloading data from the Machine-to-Machine (M2M) interface using MATLAB, making data access as easy as 1, 2, 3. The work expands on the existing tools available on OOI. This new toolbox covers data from moorings, gliders, and profilers in the OOI Coastal Arrays and can easily be extended to other research platforms. A video tutorial on how to use this new tool is provided above. (A pdf of the tutorial is provided below).
In three short steps – define the mooring, node, and instrument – users can easily and quickly access relevant OOI data. “This new approach eliminates some steps and makes it easy for anyone to find and access data they are looking for, “said Jonathan Fram, OOI Endurance Array Project Manager at Oregon State University (OSU). “We found this new approach really streamlined data access using the M2M interface and we are certain other OOI data users will find it similarly helpful.”
Developed by OOI OSU team members, Craig Risien and Russ Desiderio, these new tools are part of our ongoing effort to simplify access to OOI data to encourage its broader integration into scientific research and classroom content. A tutorial showing how to use MATLAB to access OOI data can be viewed here.
Other members of the OOI OSU team, Chris Wingard and Ian Black, are testing Python and R tools to explore OOI data, as well. Once the tools have been tested and vetted, they will be available along with other community-generated tools here.
This new tutorial adds to others that have been developed to help users integrate OOI data into their science.
Read MoreFifteen Findings in 15 minutes
“Just like lightning,” in one-minute presentations, 15 scientists shared amazing ways they are using OOI data in scientific investigations and in the classroom. This round of lightning talks capped the Ocean Observatories Initiative Facility Board’s (OOIFB) Town Hall at the 2020 Ocean Sciences Meeting on 20 February, demonstrating the multiple and creative ways OOI data are being used to answer key science questions in a changing environment.
The presentations ranged from how students are using real-life and real-time OOI data to advance their understanding of scientific principles to how researchers are using OOI data to identify the presence of marine life by sound to how modelers are making OOI data more accessible and useable.
“We were simply thrilled by the depth, breadth, and range of applications of OOI data shown during this lightning round,” Kendra Daly, chair of the OOIFB. “We were pleased so many presenters were willing to accept the challenge. This enthusiastic response clearly shows that OOI data are being used to help answer important science questions.”
Brief summaries of the talks are presented below.
Advancing science
Isabela Le Bras, Scripps Institution of Oceanography, reported on a recent article in Geophysical Research Letters, where she and her colleagues describe how they used data from the Irminger Sea Array moorings (2014–2016) to identify two water masses formed by convection and showing that they have different rates of export in the western boundary current. Upper Irminger Sea Intermediate Water appears to form near the boundary current and is exported rapidly within three months of its formation. Deep Irminger Sea Intermediate Water forms in the basin interior and is exported on longer time scales. The subduction of these waters into the boundary current is consistent with an eddy transport mechanism. The eddy transport process is more effective for the waters cooled near the boundary current, implying that cooling near boundary currents may be more important for the climate than has been appreciated to date.
Since 2017, Clare Reimers and Kristen Fogaren, Oregon State University, have been working to assess seasonal variability in benthic oxygen consumption and the contribution of benthic respiration to the development of hypoxic conditions in the northern California Current, using time series data from the OOI Endurance Array. Reimers and Fogaren measured benthic oxygen consumption rates using in situ eddy covariation techniques and ex situ core incubations, during a series of ten cruises that allowed sampling near the Endurance Oregon Shelf and Inshore stations, in all seasons. During these cruises, the researchers used real-time data provided by the Endurance Array to optimize the settings for their eddy covariance deployments. They are now examining property-relationships in discrete bottom water samples collected during the cruises and using data from OOI assets to help separate influences of mixing and biochemical processes in the water column and sediments. The researchers are also synthesizing benthic flux measurements and placing these rates in the context of cross-shelf glider measurements and benthic node time series.
Adrienne Silver, University of Massachusetts Dartmouth provided details about how she is using Pioneer Array data to learn more about the influence of warm core rings on Shelf break circulation. Results from a 40-year Warm Core Ring census show a regime shift in warm core ring formation at 2000, with the number of rings doubling from an average of 18 rings per year (during 1980-1999) to 33 rings per year (during 2000-2019). This regime shift creates a large increase in the amount of warm salty water being transported northward toward the shelf from the Gulf Stream. The preferred pathway of these rings, or the Ring Corridor seem to indicate their proximity to the shelf break and the Pioneer array during their lifetime. The goal of Silver’s project is to understand how these warm core rings affect the shelf break exchange while traveling along the shelf. A large focus of the study will be on the salinity intrusion events which might be sourced from these warm core rings.
Liz Ferguson, CEO and founder of Ocean Science Analytics, is using data from OOI’s Coastal Endurance and Regional Cabled Arrays to determine the variables that are most useful for assessing the ecosystem of this region and obtaining baseline information on marine mammal acoustic presence for use in monitoring. Using long term physical and biological data provided by these arrays, Ferguson is assessing long-standing shifts in the ecology of this coastal and offshore environment by associating physical oceanographic variables with the vocal presence of marine mammals using the broadband hydrophone data. Temporal changes in the occurrence of marine mammal species such as killer whales, sperm whales and dolphins can be used as an indicator of ecosystem shifts over time. She is analyzing passive acoustic data provided by the OOI arrays to determine the presence of vocally active marine mammal species, identify their spatial and temporal use of these sites, and combining this information with the physical oceanographic variables to assess the ecological characteristics associated with marine mammal occurrence.
Sam Urmy of the Monterey Bay Aquarium Research Institute (MBARI) also is using OOI acoustical data in his research. Using an upward-looking echosounder and a high-frequency hydrophone at MBARI’s Monterey Accelerated Research System, Urmy showed how small animals in the epipelagic and mesopelagic altered their behavior in response to predators. These responses included abrupt dives during bouts of foraging by dolphins, changes in depth to avoid predatory fish schools, and dramatic alterations to daily vertical migratory behavior. Continual observations of the mesopelagic with active and passive acoustics are revealing several dynamic predator-prey interactions in an ecosystem that is typically thought of as relatively slow and static.
Veronica Tamsitt of the University of New South Wales used the OOI’s Southern Ocean mooring and the Southern Ocean Flux Site (SOFS, in the Southeast Indian) to study the Sub Antarctic Mode water (SAMW) formation. Tamsitt’s and her colleagues findings were reported in the Journal of Climate in March 2020. Using data from the two mooring locations, the researchers were able to compare and contrast characteristics and variability of air-sea heat fluxes, mixed-layer depths, and SAMW formation. The researchers found that inter mixed-layer depth anomalies tended to be intermittent at the two moorings, where anomalously deep mixed layers were associated with anomalous advection of cold air from the south, and conversely shallow mixed layers correspond to warm air from the north. Both the winter heat flux and mixed-layer depth anomalies, however, showed a complex spatial pattern, with both positive and negative anomalies in both the Indian and Pacific basins that Tasmitt and colleagues relate to the leading modes of climate variability in the Southern Ocean.
Editor’s note: The Southern Ocean Array was decommissioned in January 2020. Its data, however, are still available for use by researchers, students, and the public.
Bringing OOI data into the classroom
Sage Lichtenwalner, Department of Marine and Coastal Sciences at Rutgers, The State University of New Jersey reported on the progress of the Ocean Data Labs Project. This project is a Rutgers-led effort to build a “Community of Practice” to tap into the firehose of OOI ocean data to support undergraduate education. To date, the project has hosted four “development” workshops that introduced participants to the OOI, conducted data processing with Python notebooks, and shared effective teaching strategies, in addition to a series of introductory workshops and webinars. As part of the development workshops, 56 university, college, and community college faculty designed 19 new “Data Explorations,” featuring web-based interactive “widgets” that allow students to interact with pre-selected data from the OOI. The project also sponsors a series of webinars, a fellowship program, and is compiling a library of resources (including coding notebooks, datasets, and case studies in teaching) to help the community.
Cheryl Greengrove, University of Washington Tacoma, summarized an article in the March issue of Oceanography that she and colleagues from across the United States wrote detailing ways to integrate OOI data into the undergraduate curriculum. The wealth of freely-accessible data provided by OOI platforms, many of which can be viewed in real or near-real time, provides an opportunity to bring these authentic data into undergraduate classrooms. The TOS article highlights existing educational resources derived from OOI data that are ready for other educators to incorporate into their own classrooms, as well as presents opportunities for new resources to be developed by the community. Examples of undergraduate introductory oceanography OOI data-based lessons using existing interactive online data widgets with curated OOI data on primary productivity, salinity, and tectonics and seamounts are presented, as well as ways to use OOI data to engage students in undergraduate research. The authors provide a synthesis of existing tools and resources as a practical how-to guide to support new resource development and invite other educators to develop and implement new educational resources based on OOI data.
Matthew Iacchei, Hawaiʻi Pacific University, presented how he has been integrating OOI data explorations to supplement his upper division oceanography lecture and labs with real data from around the world. Last semester, he had students explore patterns of dissolved oxygen and impacts of anoxia at the coastal endurance array in Oregon and compare that data to dissolved oxygen data the students collected in Kāneʻohe Bay, Hawaiʻi. This semester, students are working through two exercises with OOI data as part of their primary productivity lab (perfect, as it is now online!). Students will compare vertical profiles from Hawaiʻi with seasonal variations across the world, and will compare latitudinal drivers of primary production using data from a time-series from the Southern Ocean Array.
Strengthening OOI data usability
Wu-Jung Lee, a senior oceanographer at the Applied Physics Laboratory, University of Washington, is using data collected by the OOI to develop new methodologies for analyzing long-term ocean sonar time series. In a project funded by the National Science Foundation, she and her colleagues show that unsupervised matrix decomposition techniques are effective in discovering dominant patterns from large volumes of data, which can be used to describe changes in the sonar observation. Their preliminary analysis also show that the summaries provided by these methods facilitate direct comparison and interpretation with other ocean environmental parameters concurrently recorded by the OOI. A parallel effort that spun out of this project is an open-source software package echopype, which was created to enable interoperable and scalable processing of biological information from ocean sonar data.
As part of the Rutgers Ocean Modeling Group, in conjunction with University of California Santa Cruz, John Wilkin and Elias Hunter are delivering a high-resolution data assimilative ocean model analysis of the environs of the Pioneer Coastal Array, including a systematic evaluation of the information content of different elements of the observing network. The project uses the Regional Ocean Modeling System with 4-Dimensional Variational data assimilation. To produce a comprehensive multi-year (2014-2018) analysis required them to assimilate all available Pioneer CTD data, with quality checks, in a rolling sequence of data assimilation analysis intervals. They used three days of data in each analysis, which required queries to with a time range constraint and relevant platform (i.e. glider, profiler, fixed sensor), migrating all Pioneer CTD data (wire following profilers, gliders, fixed sensors, plus ADCP velocity) to an ERDDAP server. The simple graphing capabilities in ERDDAP allow quick browsing of the data to trace quality control or availability issues, and ERDDAP provides a robust back-end to other web services to create more sophisticated graphical views, or time series analysis. Using the ERDDAP Slide Sorter tool, they operate a quick look Control Panel to monitor the data availability and quality.
Mitchell Scott and colleagues Aaron Marburg and Bhuvan Malladihalli Shashidhara at the University of Washington, are studying how to segment macrofauna from the background environment using OOI data from the Regional Cabled Axial Seamount Array. Their long-term goal is to use an automated approach to study species variation over time, and against other environmental factors. Their initial step focuses specifically on scale worms, which are very camouflaged, making them difficult to detect. To address this, the researchers initially used a deep learning model, called U-Net, to detect and localize the scale worm locations within an image. To address the high rate of false positives using this model, they added an additional classifier (a VGG-16 model) to verify the presence of scaleworms. This combined, applied approach proved feasible for scale worm detection and localization. Yet because the environment of the Axial Seamount is so dynamic due to the growth and decay of chimneys at the site and resulting changes in bacteria and macrofauna present, they found the performance of the model decreased over time.
Weifeng (Gordon) Zhang of Woods Hole Oceanographic Institution has been using Pioneer Array data to understand the physical processes occurring at the Mid-Atlantic Bight shelf break, including the intrusion of Gulf Stream warm-core ring water onto the shelf and the ring-induced subduction of the biologically productive shelf water into the slope sea. His findings were reported in a Geophysical Research Letters paper where data from the Pioneer Array moorings and gliders demonstrated the anomalous intrusion of the warm and salty ring water onto the shelf and revealed the subsurface structure of the intrusion. Zhang also shared findings reported in the Journal of Geophysical Research: Oceans where data from the Pioneer Array showed a distinct pattern of relatively cold and fresh shelf water going underneath the intruding ring water. These results show the subduction of the shelf water into the slope sea and a pathway of shelf water exiting the shelf. In both instances, Zhang and his colleagues used computer modeling to study the dynamics of these water masses. These two studies together suggest that shelf break processes are complex and require more studies in the region.
Hilary Palevsky of Boston College presented results from an ongoing project funded by the National Science Foundation’s Chemical Oceanography program, using biogeochemical data from the OOI Irminger Sea Array. Analysis of dissolved oxygen data on OOI Irminger Sea gliders and moorings from 2014-2016 showed the importance of biogeochemical data collected over the full seasonal cycle and throughout the entire water column, due to the influence of subsurface respiration and deep winter convection on biological carbon sequestration. The OOI Irminger Sea array is the first source of such full-depth year-round data in the subpolar North Atlantic. To quantitatively evaluate the annual rate of carbon sequestration by the biological pump and the role of deep winter convection, Palevsky and colleague David Nicholson of the Woods Hole Oceanographic Institution collaborated with OOI to improve the calibration of oxygen data at the Irminger Sea array by modifying the configuration of glider oxygen sensors to enable calibration in air each time the glider surfaces, which improves the accuracy and utility of the data collected both from gliders and from moorings. Palevsky presented preliminary results demonstrating successful glider air calibration at the Irminger array in 2018-2019 as well as work by student Lucy Wanzer, Wellesley College, demonstrating the importance of well-calibrated oxygen time series data to determine interannual variability in rates of subsurface respiration and deep winter ventilation in the Irminger Sea.
Read More
Endurance Cruise Delayed by COVID-19
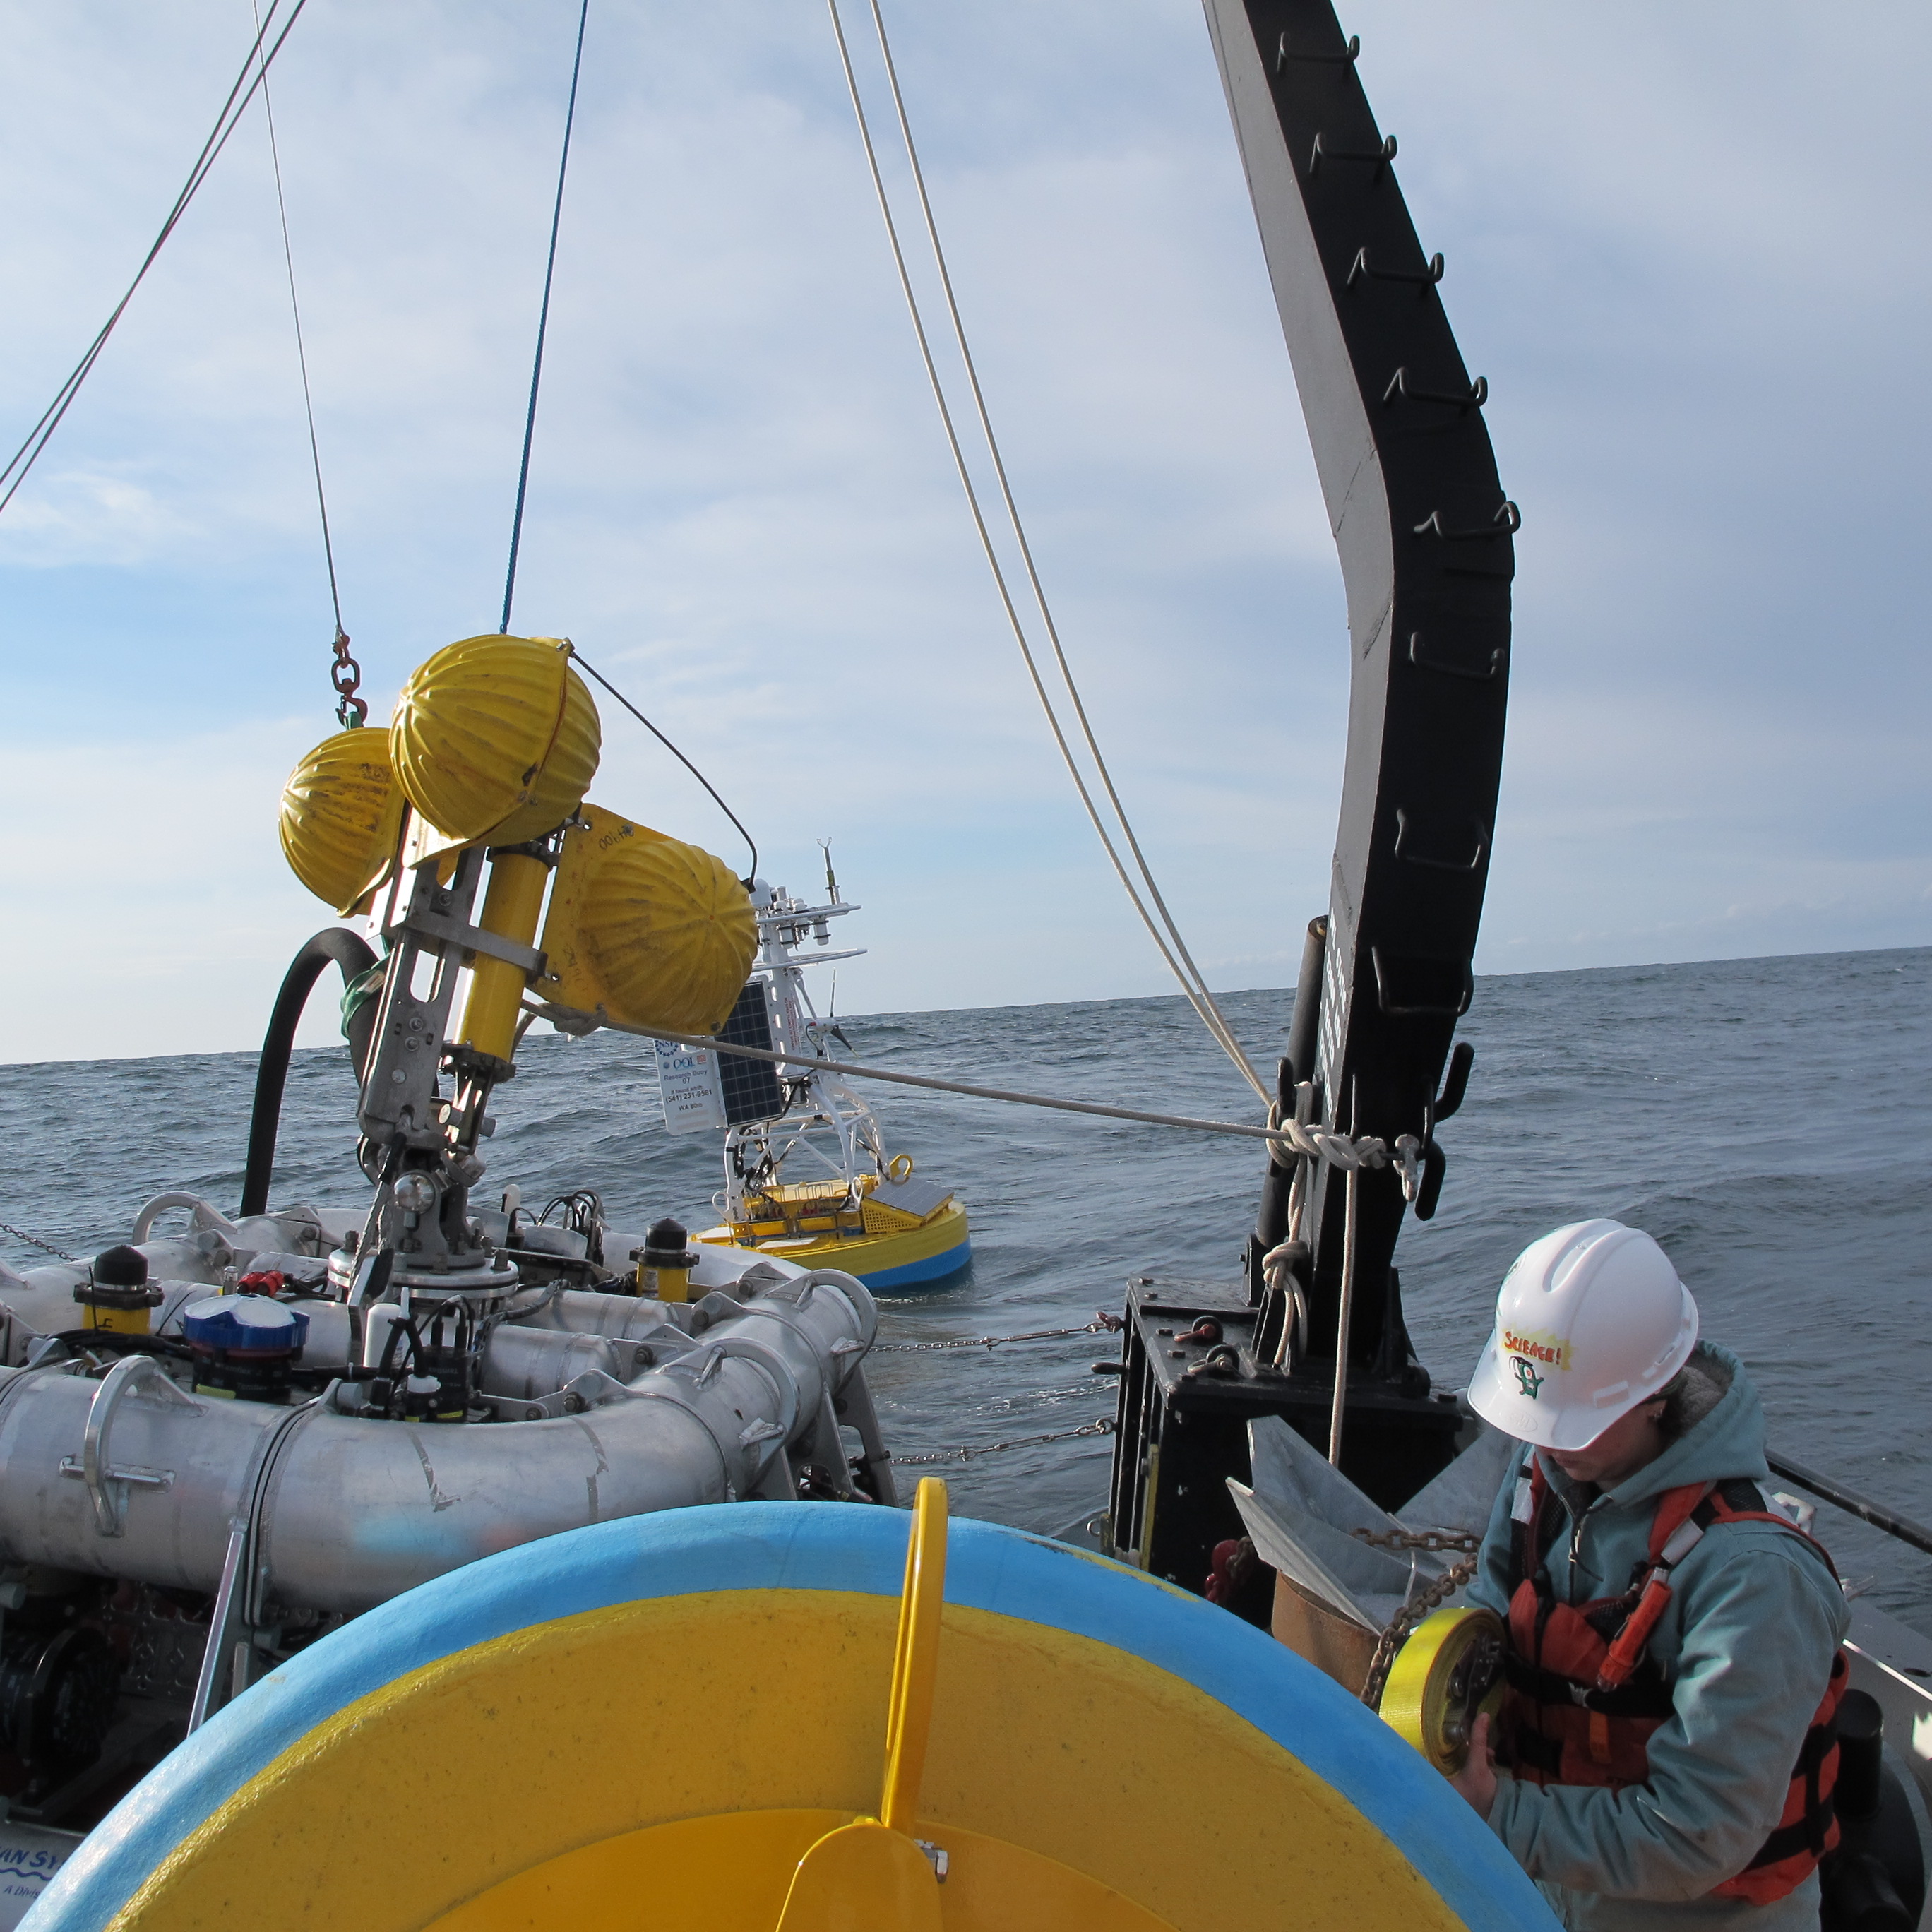
The spring 2020 OOI Endurance Operations and Management (O&M) turn cruise has been delayed for at least 30 days due to travel and personnel restrictions imposed to stem the spread of the virus COVID-19.
The 16-day cruise was set to depart on 31 March from Newport, Oregon aboard the R/V Sikuliaq to service the array off the Oregon and Washington coasts. The R/V Sikuliaq is part of the US academic research fleet managed by UNOLS (the University-National Oceanographic Laboratory System). UNOLS imposed a 30-day suspension in fleet operations on 13 March to help ensure the safety of the ship’s crew and science party and to mitigate the risk of virus spread. Rescheduling of activities will commence once the situation stabilizes and UNOLS sees a path forward to re-start research vessel operations safely.
Upcoming O&M cruises for the Pioneer, Irminger, and Papa Arrays also are scheduled aboard UNOLS vessels (R/V Neil Armstrong and R/V Sikuliaq). These cruises fall outside of the UNOLS current 30-day suspension so cruise preparation continues.
We do not anticipate that cruise schedule changes will affect the collection nor dissemination of OOI data, which will continue to be available for users here.
Read More
Metadata Review Improves OOI Data
OOI’s data teams have just completed an extensive, year-long review of critical metadata to ensure the quality and usability of data for OOI data users. The review covered data collected through the end of 2019 and included instrument calibration coefficients, instrument deployment assignments, and deployment dates. Moving forward, all metadata verification will conform to the standards established during the review.
“Our reason for undertaking this review was no more complicated than to make the data better for our data users,” explains Jeffrey Glatstein, Senior Manager of Cyberinfrastructure and OOI Data Delivery Lead. “It is the first time since the inception of the program that we’ve really gone in and looked at the metadata from top to bottom. If there was a calibration that was off, a depth missing, or something misspelled, we found it.
“This intense and deliberative review process brought historic metadata up to current standards to ensure continuity, completeness of records, and consistency in how metadata are reported now and moving forward.”
The data teams used a combination of human review and an automated script development process to identify and correct data issues. The human-in-the-loop (HITL) process ensured that two sets of eyes verified each metadata product, whenever possible, while the scripts performed automated verification and generated reports to pass back into the HITL workflow.
“This initiative is part of ongoing OOI efforts to make its data more accessible, user friendly, and integrated into ongoing science,” adds Glatstein.
Check Previously Downloaded Data
The OOI Data Portal operates on a process-on-demand model, which means that data downloaded prior to the end of 2019 should be checked to see if relevant metadata has been modified.
Users can check to see if changes were made to relevant metadata by clicking here. This link provides a searchable database by array, platform, and instrument to help ensure that previously downloaded data are correct or if they need to be re-downloaded so users are working with the best available data. The OOI data teams are continuing to verify the historical deployment assignments/dates, and the results will be updated accordingly
[feature]A Gargantuan Effort
As part of the transition of OOI to 2.0 in October 2018, the RCA data team initiated a comprehensive audit of all critical metadata to ensure that data products served by the OOI Cyberinfrastructure system meet Quality Assurance/Quality Control standards set by the program and expected from the user community. This daunting task included the examination of over 700 calibration files from 2013 to the present. The results of this audit were used to aid in evaluation of current processes and guide in adapting workflows to improve QA/QC efforts and communication to the users, a vital component to building confidence in the OOI datasets as reliable and valuable resources that can be used in scientific research and education.
Wendi Ruef, Research Scientist, Regional Cabled Array
The CGSN Data Team worked carefully and methodically through thousands of files containing over 30,000 calibration coefficients and other critical metadata. We now have a high level of confidence in past metadata and a strong process for continued review going forward.
Al Plueddemann, Chief Scientist, Coastal Global Scale Nodes
[/feature] Read More