
Posts Tagged ‘Dissolved Oxygen’
Improving Reliability and Availability of Dissolved Oxygen Glider Data
OOI’s Coastal Endurance Array Team is making great strides in ensuring the accuracy of glider dissolved oxygen measurements and making these data readily available to researchers. The team has compared glider oxygen data with independent transects and climatologies compiled by west coast colleagues. They are increasing the number of in situ comparisons of glider oxygen data with bottle samples taken in proximity to the gliders. They have built a benchtop system to do two-point calibrations for oxygen sensors to help ensure their accuracy when the gliders are in the water. And, working with OOI colleagues at WHOI, the team is helping to design and test improved sensor mounts to perform in situ air calibrations of glider oxygen measurements.
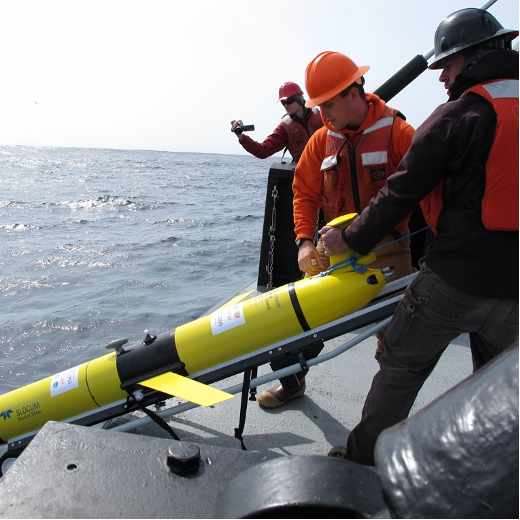
“A couple of years ago, Endurance Glider Lead Stuart Pearce developed code to put all of the oxygen data collected by our glider fleet into the DAC, the national central database for glider data,” said Ed Dever, Principal Investigator of the Coastal Endurance Array and Professor at Oregon State University. “Prior to doing this, Stuart examined the data and metadata for any gross errors and issues. That was the first of many steps we have taken to ensure OOI oxygen data are reliable and available so they can be trusted and used by researchers. Our effort is paying off. The glider data available on the DAC are identical to that now available on OOI’s Data Explorer. Endurance glider lines off Newport, OR and Grays Harbor, WA will be the backbone for the northern Californian Current part of the nascent Boundary Ocean Observing Network. The OOI glider lines map seasonal development of hypoxic areas off Oregon and Washington from the coast to the edge of the continental shelf.”
[media-caption path="/wp-content/uploads/2022/11/glider.png" link="#"]More than 137 glider missions have occurred along the Newport and Grays Harbor lines since 2014. Credit: Coastal Endurance Array at OSU.[/media-caption]
Collaborations
Enough oxygen data has been collected and shared in the northeast Pacific that is now possible to make high resolution regional climatologies of temperature, salinity and oxygen. Risien et al. (2022) compiled ~20 years of data taken by Jennifer Fisher (NOAA) and many others, to develop analysis ready transects of water property data off Newport, Oregon. These datasets include both climatologies and individual interpolated, quality-controlled, transect data. The Endurance Team compared glider dissolved oxygen with shipboard CTD samples collected by Fisher along the Newport transect in July 2021. Oxygen measurements from the gliders and CTDs samples compared well and provided confidence that glider and shipboard transects can map hypoxic conditions at comparable resolution and accuracy. Added Dever, “We were able to do a side-by-side comparison of the temperature, salinity, and oxygen data collected by the gliders over our Newport hydrographic line with the CTD data sampled by the Fisher’s team using the R/V Elakha. The comparison was quite good and served to validate the quality of the glider data that are an integral part of the Endurance Array.”
Engineering Solutions
A couple years ago, team member Jonathan Whitefield worked with Scripps Institution for Oceanography to build an oxygen Winkler titration rig so the team can titrate its own oxygen samples. The system can be used both in the lab and onboard to validate glider and moored oxygen data. The titration rig has been used to increase the number bottle samples taken during glider deployments and recoveries and to reduce the time between sample acquisition and analysis.
Building on this, Whitefield and others recently assembled in-house two-point calibration baths for pre- and post deployment of oxygen data collected by gliders and moorings. Calibrations are performed at anoxic and near-saturated conditions. The two-point calibration system is based on a similar one used at Scripps Institution for Oceanography (López-García, P., et al., 2022). A sodium sulfite solution is injected into bottle samples to get the low endpoint oxygen calibration point. The high endpoint oxygen calibration point is achieved using a stirred bath at 10°C to get to near saturation. The high endpoint oxygen is measured with replicate Winkler titrations. The calibration baths better ensure accuracy by making it possible to perform routine in-house checks of vendor calibrations on glider and moored sensors as well as identify calibration drift after deployment.
What’s ahead
Oxygen data are reviewed weekly by operators and annotated. Real-time automated quality control using QARTOD tests is in development. In-situ air calibration tests of oxygen optodes are planned for spring 2023. At the suggestion of outside investigators, OOI’s Coastal and Global Scale Node team at Woods Hole Oceanographic Institution modified Slocum glider optode mounts to allow in-situ air calibrations of dissolved oxygen on the Irminger Sea and Pioneer Arrays. The mount, however, affected the flow around gliders with radome fins and caused navigation problems. Modeling done at WHOI showed these problems may be due to vortices of the optode on the starboard side of the fin. The Endurance gliders will test a new mount placement during its upcoming bi-annual operations and maintenance cruise in March of 2023.
“We’re part of the community of practice for glider oxygen calibration and validation,” said Dever. “We engage with colleagues, adopt standard practices and widely share data. This community of users will help all of us get a better handle on ongoing changes in our ocean regions.”
References
Risien et al. (2022) Spatially gridded cross-shelf hydrographic sections and monthly climatologies from shipboard survey data collected along the Newport Hydrographic Line, 1997–2021, https://doi.org/10.1016/j.dib.2022.107922
López-García, et al. (2022) Ocean Gliders Oxygen SOP, Version 1.0.0. Ocean Gliders, 55pp. DOI: http://dx.doi.org/10.25607/OBP-1756. (GitHub Repository, Ocean Gliders Oxygen SOP.
Read More
Pioneer Data Show the Continental Shelf Acts as a Carbon Sink
Excerpted from the OOI Quarterly Report, 2022.
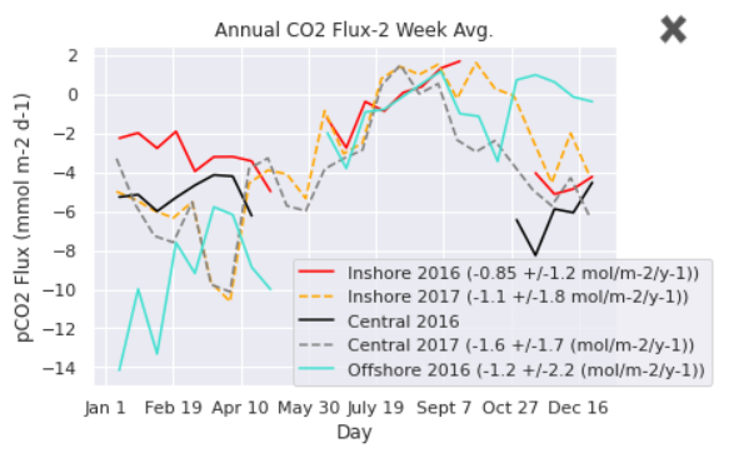
[media-caption path="https://oceanobservatories.org/wp-content/uploads/2021/02/Pioneer-for-Science-Highlights.png" link="#"]Figure 23. Weekly average air-sea CO2 flux estimated for the Pioneer Array Inshore, Central and Offshore moorings during 2016 and 2017. A negative flux is from the atmosphere to the ocean. From Thorson and Eveleth (2020).[/media-caption]In the summer of 2020 the Rutgers University Ocean Data Labs project worked with the Rutgers Research Internships in Ocean Science to support ten undergraduate students in a virtual Research Experiences for Undergraduates program. Two weeks of research methods training and Python coding instruction was followed by six weeks of independent study with a research mentor.
Dr. Rachel Eveleth (Oberlin College) was one of those mentors. Already using some of the Data Labs materials in her undergraduate oceanography course, she saw an opportunity to leverage the extensive OOI data holdings to engage students in cutting edge research on a limited budget during a time when her own field work was curtailed due to the COVID-19 pandemic. Dr. Eveleth advised Alison Thorson from Sarah Lawrence College (NY) and Brianna Velasco form Humboldt State University (CA) on the study of air-sea fluxes of CO2 on the US east and west coast, respectively.
Preliminary results were presented at the 2020 Fall AGU meeting. A poster authored by Thorson and Eveleth (ED037-0035) evaluated pCO2 data from the three Pioneer Array Surface Moorings during 2016 and 2017. They showed that the annual mean CO2 flux across all three sites for the two years was negative, meaning that the continental shelf acts as a sink of atmospheric carbon. The annual average flux was -0.85 to -1.6 mol C/(m2 yr), but the flux varied significantly between mooring sites and between years (Figure 23). Investigation of short-term variability in pCO2 concentration concurrent with satellite imagery of SST and Chlorophyll was consistent with temperature-driven, but biologically damped, changes.
[media-caption path="https://oceanobservatories.org/wp-content/uploads/2021/02/Pioneer-for-Science-Highlights.png" link="#"]Figure 24. Hourly (dots) and monthly (lines) average air and water CO2 concentration observed at the Endurance Array Washington Offshore mooring during 2016 and 2017. From Velasco et al. (2020).[/media-caption]A poster by Velasco, Eveleth and Thorson (ED004-0045) analyzed pCO2 data from the Endurance Array offshore mooring. Three years of nearly continuous data were available during 2016-2018. The seasonal cycle showed that the pCO2 concentration in water was relatively stable and near equilibrium with the air in winter, decreasing in late spring and summer (Figure 24). Short-term minima in summer were as low as 150 uatm. Like the east coast, the mean air-sea CO2 flux was consistently negative, meaning the coastal ocean acts as a carbon sink. The annual means at the Washington Offshore mooring for 2016, 2017 were -1.9 and -2.1 mol C/(m2 yr), respectively. The seasonal cycle appears to be strongly driven by non-thermal factors (on short time scales), presumably upwelling events and algal blooms.
These studies, although preliminary, are among the first to use multi-year records of in-situ CO2 flux from the OOI coastal arrays, and to our knowledge the first to compare such records between the east and west coast. Dr. Eveleth’s team intends to use the rich, complementary data set available from the OOI coastal arrays to investigate the mechanisms controlling variability and role of biological vs physical drivers.
Read More
Low Dissolved Oxygen off Washington and Oregon Coast Impacted by Upwelling in 2017
In the summer of 2020, the Rutgers University Ocean Data Labs project worked with the Rutgers Research Internships in Ocean Science to support ten undergraduate students in a virtual Research Experiences for Undergraduates program. Rutgers led two weeks of research methods training and Python coding instruction. This was followed by six weeks of independent study with one of 13 research mentors.
Dr. Tom Connolly (Moss Landing Marine Labs, San Jose State University) advised Andrea Selkow from Austin College, Texas on her study of dissolved oxygen (DO) off the Washington and Oregon coasts using the OOI Endurance Array.
Selkow evaluated DO data from Endurance Array Surface Moorings during 2017 and 2018. She presented this work as a poster at the conclusion of her summer REU. Selkow focused on the question: Are there similarities in the dissolved oxygen concentrations off the coast of Oregon and Washington during a known low oxygen event? She also considered why there might exist differences based on the spatial variability of wind stress forcing, i.e., do the strong Oregon winds cause dissolved oxygen concentrations to be lower at the Oregon mooring compared to the Washington moorings. Finally, she reviewed the data and tried to answer whether the oxygen data were accurate or affected by biofouling.
She used datasets from the OR and WA Inshore Shelf Mooring time-series and WA Shelf Mooring time-series from Endurance Array. Her focus was on the seafloor data because that is where the lowest oxygen concentrations were expected to be observed.
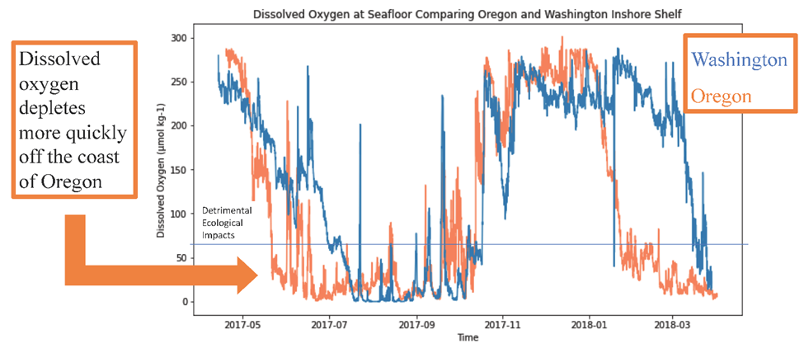
Selkow focused her attention on low DO observed in the summer of 2017. While Barth et al. (2018) presented a report on these data for one event in July 2017, she expanded the analysis to include the Washington shelf and inshore moorings. She plotted time series data and used cruise data to validate these time series. While overall seasonal trends in DO were similar, she found dissolved oxygen is routinely more quickly depleted off the coast of Oregon than Washington during a low oxygen event (Figure 25). She also looked at the cross-shelf variability in DO time series and found dissolved oxygen is more quickly depleted at the shelf mooring than at the inshore shelf mooring. Upwelling is known to drive the low oxygen events and she inferred that the weaker southward winds over the Washington shelf may be why DO decreases at a slower rate off Washington than Oregon.
References
Barth, J.A., J.P. Fram, E.P. Dever, C.M. Risien, C.E. Wingard, R.W. Collier, and T.D. Kearney. 2018. Warm blobs, low-oxygen events, and an eclipse: The Ocean Observatories Initiative Endurance Array captures them all. Oceanography 31(1):90–97,
Selkow, A. and T. Connelly. Low Dissolved Oxygen off Washington and Oregon Coast Impacted by Upwelling in 2017, Accessed 13 Jan 2021.
Read MoreCoastal Endurance Array Dissolved Oxygen Webinar Online
If you missed the 16 September 2020 Coastal Endurance Array’s webinar on dissolved oxygen, you can view it below. It’s an easily digestible webinar series in four short sections, detailing the Coastal Endurance Array’s dissolved oxygen data, how they are collected, and what is being learned from this collection of five+ years of data.
https://youtu.be/NlfPH8X5Vy8
https://youtu.be/2uJYzthlvJs
https://youtu.be/aus7eaDlNtE
https://youtu.be/s7f_6rdBf2w
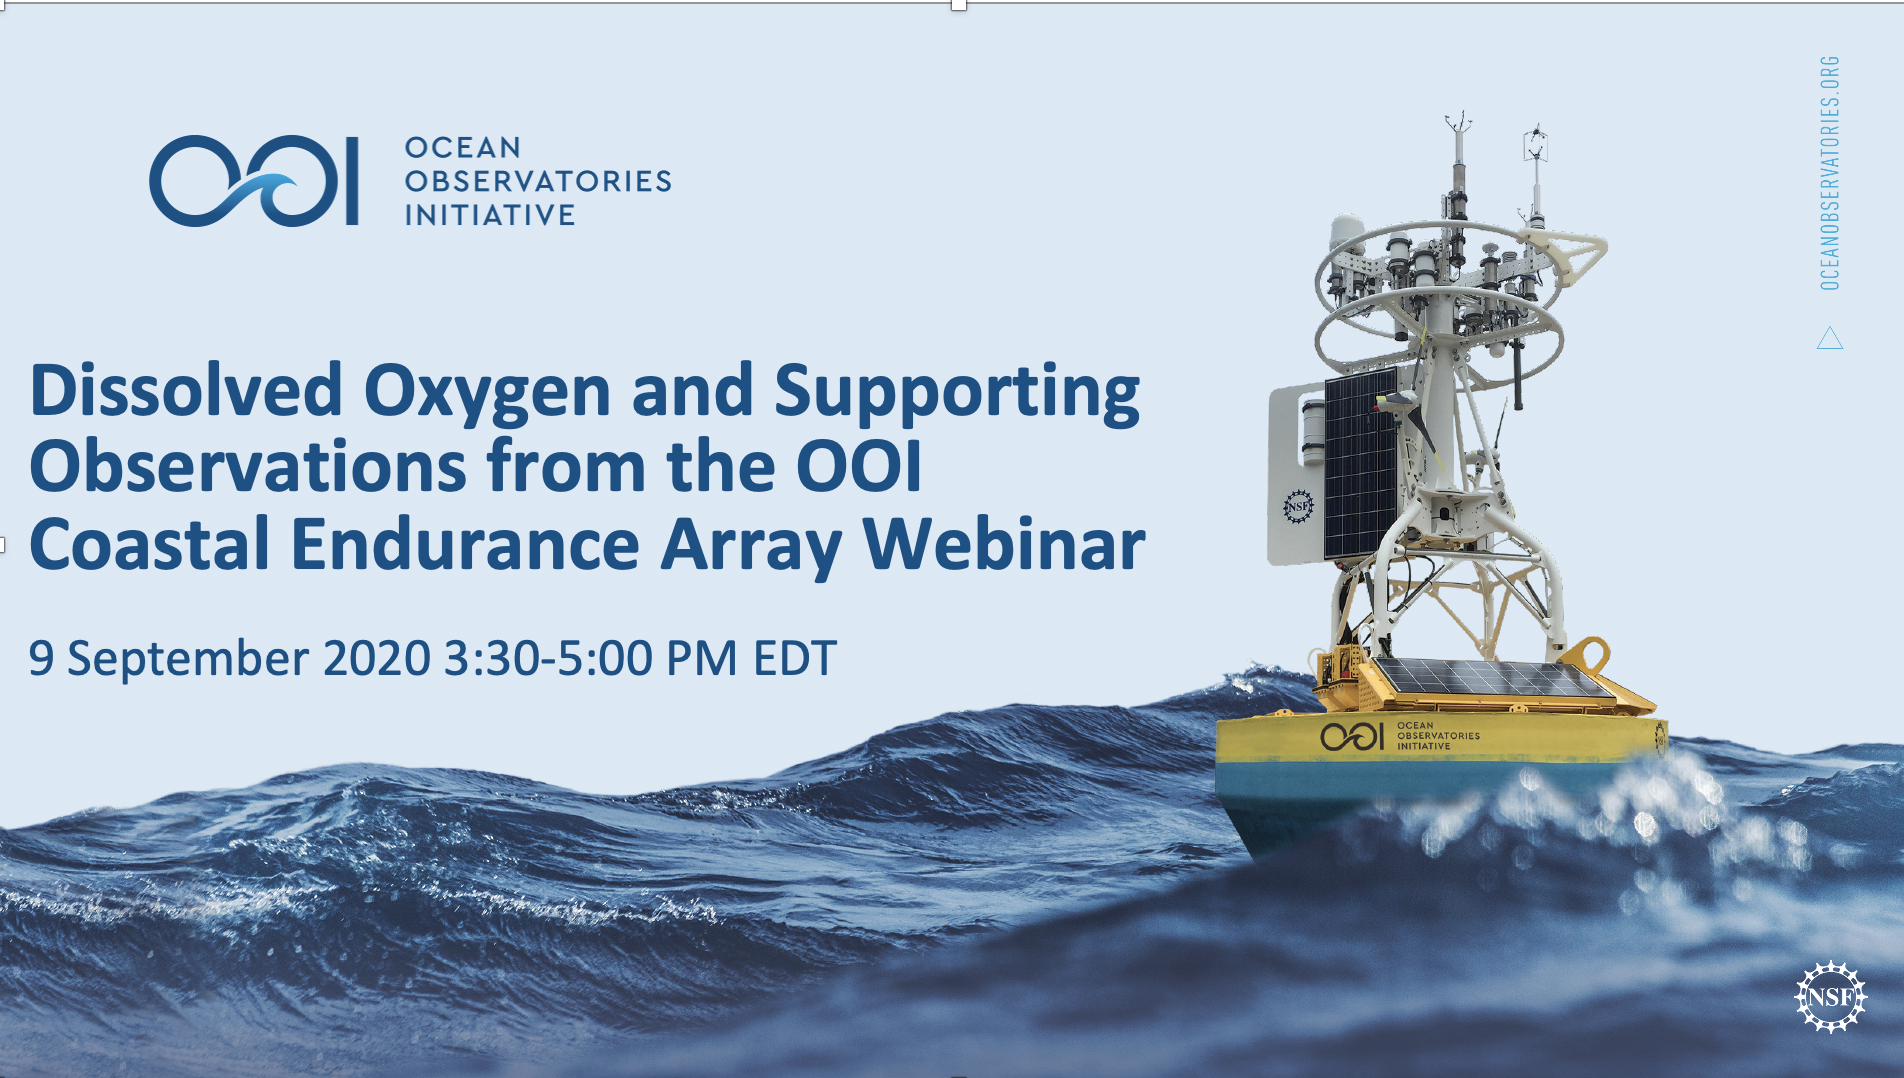
Read MoreMark Your Calendar: Dissolved Oxygen Webinar, 9 September 2020

 Coastal Endurance Array webinar presenters: Ed Dever, Chris Wingard, Stuart Pearce, Craig Risien, Jonathan Whitefield, and Jon Fram[/caption]
In this webinar, we present dissolved oxygen (DO) data from the Ocean Observatories Initiative’s (OOI) Coastal Endurance Array off Oregon and Washington. DO is recorded on platforms across OOI. These measurements contribute directly to the OOI science goal of understanding ecosystem changes. The Endurance Array measurements contribute specifically to understanding the seasonal development and synoptic variability of hypoxia. DO measurement platforms on EA include moorings, gliders, and profilers.
The webinar will be presented in four pre-recorded sections with a live Q and A following each section. In part one, we will provide an overview of OOI DO measurements across OOI. The remaining three parts will cover surface mooring time series, glider measurements, and profiler measurements respectively. For each of these platforms, we will describe the sampling, review quality control procedures and issues, and present example plots. We will focus on recent data, including telemetered data collected since the latest Endurance cruise in July 2020. We will present the DO time series, along with related observations of wind velocity and ocean temperature.
Please register in advance for this webinar here. After registering, you will receive a confirmation email containing information about how to join the webinar.
The webinar sections will be posted to oceanobservatories.org. Pre-registered webinar participants can sign up for follow-up discussions on accessing these OOI data on 10 September. Individuals can also contact the OOI HelpDesk and set up similar discussions at a later date.
Read More