
Posts Tagged ‘Ed Dever’
UG2 Workshop ’24: A Collaborative Hub for Underwater Glider Innovation

The UG2 Workshop ’24, held from September 10-12 on the University of Michigan campus, brought together leading researchers, industry professionals, and practitioners to advance the capabilities and collaborative efforts of the underwater glider community. National Science Foundation Ocean Observatories Initiative (OOI) attendees included Ed Dever, Principal Investigator of the Northeast Pacific Endurance Array (EA), Peter Brickley, Senior Engineer with the Coastal and Global Scale Nodes (CGSN), and EA glider lead Stuart Pearce and glider tech Jonathan Whitefield. Over the course of three days, OOI participants contributed to in-depth discussions on data management, operational best practices, and emerging technologies, laying the foundation for future advancements in ocean monitoring and glider operations.
Workshop Goals and Objectives
The primary objective of UG2 is to foster a cohesive community that promotes the sharing of glider mission resources within the U.S. and internationally. The 2024 Workshop aimed to:
- Harmonize Glider Efforts: Improve data management and foster partnerships while documenting best practices to enhance collaboration.
- Share New Developments: Highlight recent advancements in sensors, glider technologies, and novel applications.
- Refine Operational Activities: Enhance strategies for sustained ocean observations and explore the impact of glider data on ocean modeling.
- Identify Action Items and Needs: Address communication gaps and improve UG2’s communication platforms for the future.
- Network with Glider Users: Facilitate interactions among U.S. and international glider users to strengthen partnerships.
Key Highlights
The workshop featured several interactive components that fostered deep engagement and collaborative dialogue:
- Liesl Hotaling’s Plenary Talk and Breakout Session: Liesl Hotaling’s plenary talk and subsequent breakout session focused on developing microcredentials for ocean technology professionals. This initiative aims to address workforce needs by creating stackable credentials that recognize core competencies. Her session, co-led with Josh Kohut, invited attendees to discuss the application of these credentials in building capacity for glider maintenance and piloting.
- Data Management Sessions (Day 2): A significant portion of Day 2 was dedicated to addressing challenges in glider data management. Facilitators Jennifer Bowers, Leila Baghdad-Brahim, and Jennifer Sevadjian led discussions on best practices for data collection, registration, and sharing. The sessions provided valuable insights into the U.S. IOOS National Glider Data Assembly Center (DAC) and efforts to standardize glider data handling, ensuring efficient management of multidimensional data. All OOI glider data are routinely reported to the DAC using code developed by Stuart Pearce and others.
- Sustained National Glider Network Session (Day 2): Daniel Rudnick and J. Xavier Prochaska facilitated this session, which emphasized the importance of a sustained glider-based observation network within the Global Ocean Observing System (GOOS). Participants explored the feasibility of creating a coordinated network that integrates coastal and basin-scale observations, building on previous efforts by the Ocean Gliders Boundary Ocean Observing Network (BOON). The OOI’s Endurance Array lines are part of the BOON along the US Pacific coast.
- Poster Presentations: The poster sessions showcased a wide range of research and operational insights. OOI contributed two posters.
- Stuart Pearce et al. presented a poster on “OOI In-Air Oxygen Calibration Adjustments and Improved Oxygen Sensor Mount,” highlighting advancements in sensor calibration for improved accuracy.
- Peter Brickley et al. showcased “OOI Glider Operations in the Mid-Atlantic Bight,” detailing operational strategies and findings from extensive glider deployments in this dynamic region.
Outcomes and Next Steps
The workshop successfully facilitated deep engagement and collaboration, resulting in several key outcomes:
- Enhanced Data Management Practices: The data management sessions provided a comprehensive overview of current challenges and future directions, including early-stage data federation efforts aimed at harmonizing international standards.
- Support for a Sustained Glider Network: The discussions around a national glider network laid the groundwork for future collaboration, emphasizing the need for long-term, high-resolution coastal and deep ocean observations.
- Advancements in Professional Training: The workshop underscored the importance of developing innovative, stackable educational opportunities to build capacity in the blue economy. These efforts aim to enhance workforce skills and provide diverse learning pathways for individuals seeking careers in ocean technology.
[caption id="attachment_34904" align="alignnone" width="640"]
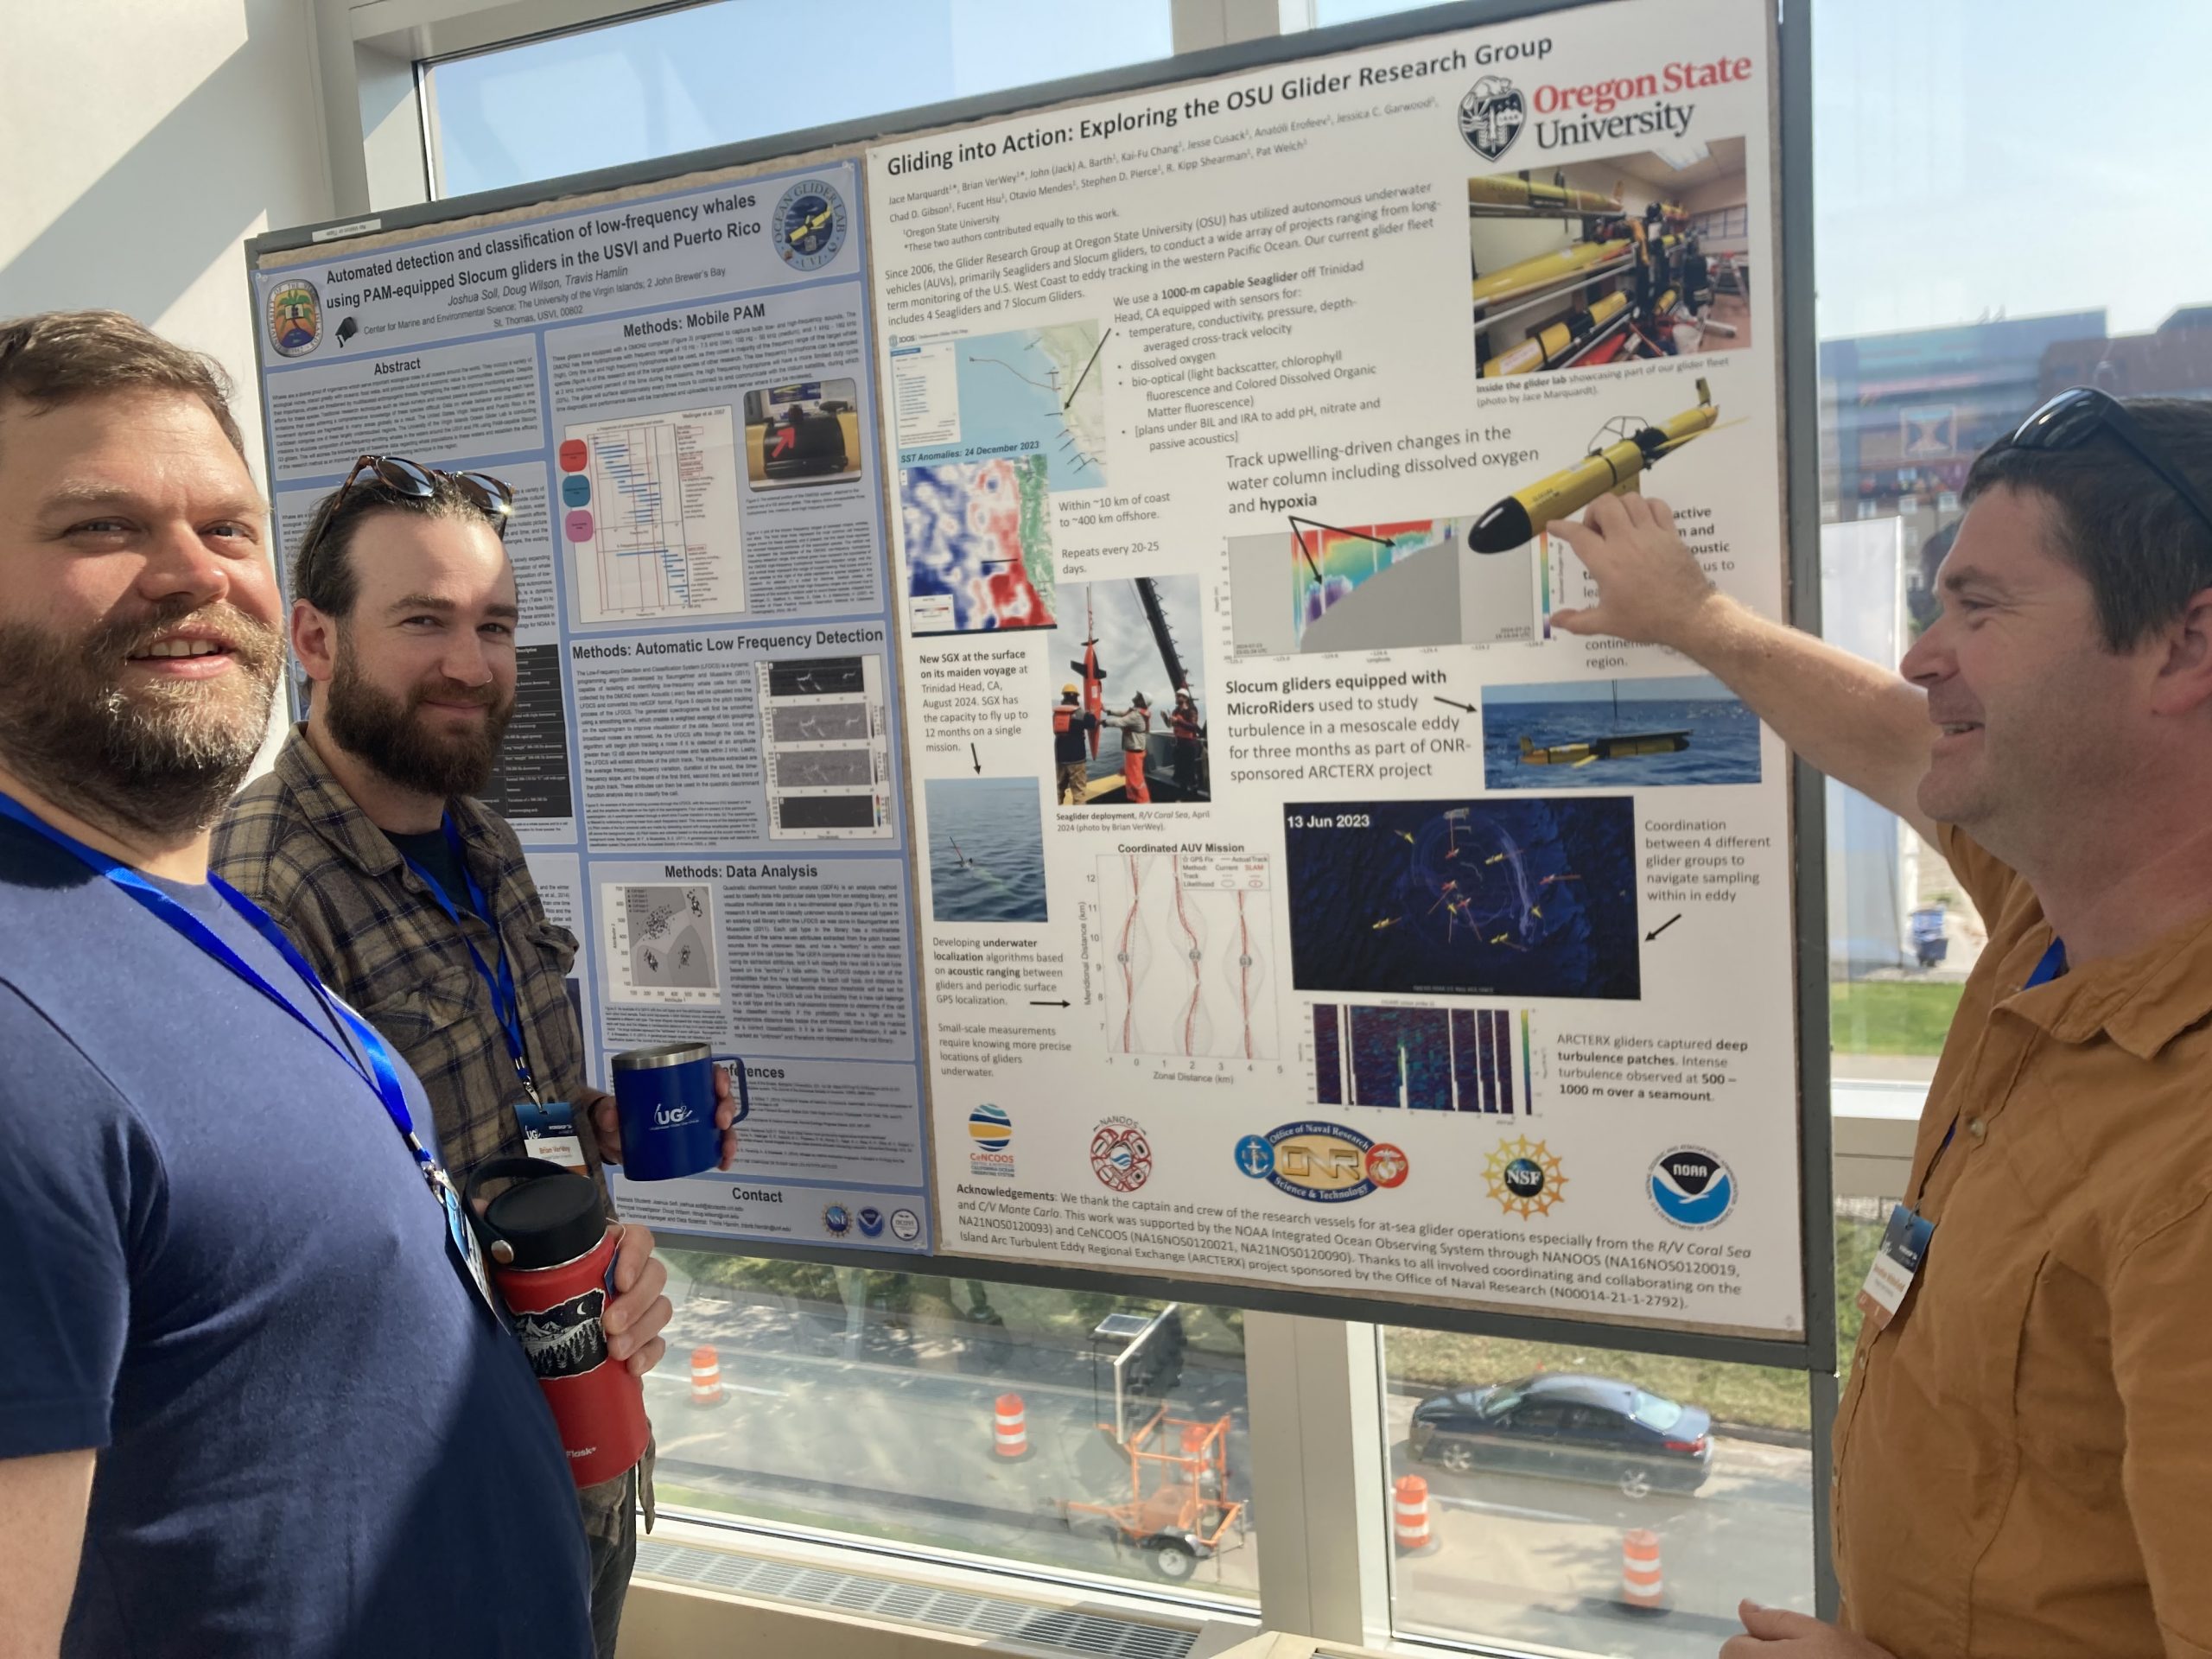 Stuart Pearce (OSU Endurance, left), Brian VerWey (OSU research glider group, center), and Jonathan Whitefield (OSU Endurance, right) pose during discussions around Brian’s poster.[/caption]
Read More
Stuart Pearce (OSU Endurance, left), Brian VerWey (OSU research glider group, center), and Jonathan Whitefield (OSU Endurance, right) pose during discussions around Brian’s poster.[/caption]
Read More Ian Black: Taking Inspiration from OOI
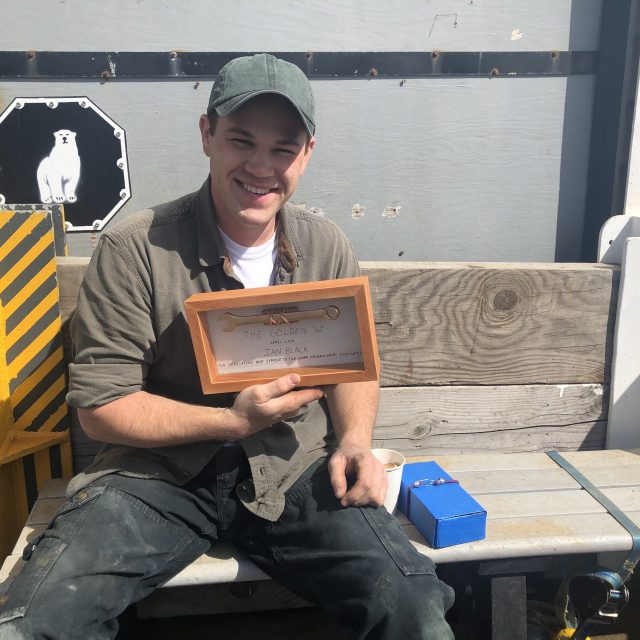
As an undergraduate at Oregon State University (OSU), Ian Black attended an oceanography course taught by the OOI’s Coastal Endurance Array Principal Investigator Ed Dever, where he was introduced to key oceanographic concepts and the observational capacity of the OOI. Black was so intrigued by the work that he approached Dever and asked about an internship with the OOI Endurance Array.
“Initially it was scraping barnacles, turning wrenches, very dirty and manual labor,” explained Black. “And I liked it. The project and its mission made sense to me.” The OOI provided Black with his first experience at sea, the Regional Cabled Array’s VISIONs cruise in 2015, where he sailed with another OOI alum Katie Bigham. Toward the end of his internship and undergraduate program, Black was interested in continuing to work on the Endurance Array and was encouraged to pursue a master’s degree. Throughout graduate school, Black continued to work part-time on the Endurance Array, continuing to scrape barnacles, but also gained some experience in electronics and coding.
In 2018, Black received his M.S. in Marine Resource Management and was hired on as an Endurance Array technician. Between 2018 and 2021, Black focused primarily on the Coastal Surface Piercing Profilers that are deployed at the CE01, CE02, CE06, and CE07 sites located off Oregon and Washington. He also provided assistance with the large coastal surface moorings and gliders during downtime and cruises.
Not one to sit still too long, Black decided to pursue a PhD, again at OSU in 2021. Black was originally brought on by his co-advisors, Dr. Clare Reimers and Dr. Maria Kavanaugh, to focus on the bio-optical sensors that are to be deployed on the NSF’s new Regional Class Research Vessels. While waiting for the deployment of these vessels, Black has developed a newfound interest in marine heatwaves. Currently, he and his advisors have a manuscript under review where they use OOI Endurance Array data to explore the biophysical impacts of marine heatwaves on phytoplankton.
[media-caption path="https://oceanobservatories.org/wp-content/uploads/2024/05/Profiler-Victory-2-scaled.jpg" link="#"]Left to Right: Jon Fram, Ian Black, Alex Wick, and Steve Lambert pose with a recently recovered profiler. Credit: Oregon State University.[/media-caption]For the next chapter in his PhD dissertation, Black plans to again use OOI data from the Endurance Array to explore the finer scale effects of marine heatwaves over the Oregon shelf. “There are a lot of high-resolution data products from the moorings, profilers, and gliders that could be combined to tell an interesting story”, Black said. In particular, there are some “some really interesting still images from the camera located at the shelf site that coincide with events or phenomena that are commonly introduced in oceanography courses, much like the class Ed (Dever) taught all those years ago. Seeing these things with real data really reinforces those core oceanographic concepts.” Black hopes that this work will end up as a second manuscript, but at the very least “the code and results can be used as a tool, perhaps in the classroom, to show students that the concepts they learn about are supported with modern data.” Black added that has been instrumental in his PhD research. He uses it between several times per week to review, process, and assess data.
“The OOI Endurance Team has been supportive at every stage of my career so far, not just the OOI ones. “It’s a great place to work and Ed (Dever) and Jon (Fram) work hard to keep people invested in the project.” The few years working as a technician and almost decade of interaction with the OOI has been an important part of my development. Black added, “I even missed the camaraderie so much that I recently volunteered to join the 20th deployment of the Endurance Array (EA20) this past spring.” As an undergraduate, Black’s first Endurance cruise was EA5.
Black brings an interesting perspective to OOI data. He now looks at it from the vantage point of a scientist and how it can be used to answer questions, as well as from an engineering viewpoint on how data are collected in such a unforgiving marine environment. “The amount of data offered by OOI is daunting and is going to take anyone, regardless of data analysis skill level, a long time to look through. In my opinion, it is particularly important for graduate students, who might have more time to look at the data, to just start looking to see what they can find.” Black gave an example of the richness and uniqueness of data available. In 2019 as the Blob 2.0 marine heatwave was expanding in the Northeast Pacific, he was deploying an OOI profiler at the Oregon shelf site (CE02SHSP). Due to platform malfunction, operator error, or a combination of, the profiler decided to surface every 20 minutes for 2 days instead of the typical 12 hours for 2 months. Black hopes that something interesting could be found in this data and thinks it could make for a good term project for a class. “It’s very interesting data and it’s public’s data.” If Black stays in academia, he plans to encourage his students to explore open data collected by groups such as the NSF’s OOI.
Read More
Visit to West Coast OOI Facilities
A group of Ocean Observatories Initiative (OOI) leaders visited OOI facilities at Oregon State University and the University of Washington last week to get a first-hand look at operations of the Coastal Endurance Array and Regional Cabled Array, respectively. National Science Foundation Program Director George Voulgaris, OOI Principal Investigator Jim Edson and Senior Program Manager Paul Matthias spent five days on the road meeting with their OOI west coast colleagues. The trip was designed to give recently appointed Voulgaris an opportunity to inspect the infrastructure and meet team members who keep the Coastal Endurance and Regional Cabled Arrays operational and reporting back data around the clock. Edson and Matthias seized the opportunity to meet in person with colleagues who they routinely see on the screen.
The following provides a glimpse of some of the activities that occurred during the trip:
[media-caption path="https://oceanobservatories.org/wp-content/uploads/2023/02/20230207_140014.jpg" link="#"]Grant Dunn, Mechanical Engineer with the Electronic & Photonic Systems Department at UW-APL (left) describes the level-wind system on the RCA profiler mooring to Dr. George Voulgaris during a tour of the RCA laboratory facilities at the University of Washington as RCA Project Manager Brian Ittig looks on. Credit: Paul K. Matthias © WHOI.[/media-caption] [media-caption path="https://oceanobservatories.org/wp-content/uploads/2023/02/20230207_144911.jpg" link="#"]Regional Cabled Array Principal Investigator Deborah Kelley (left) and OOI Senior Program Manager Paul Matthias take a selfie to commemorate their in-person visit during a tour of the RCA facilities at the University of Washington. Credit: Paul K. Matthias © WHOI.[/media-caption] [media-caption path="https://oceanobservatories.org/wp-content/uploads/2023/02/20230207_141656.jpg" link="#"]NSF Program Director George Voulgaris (from left), OOI Principal Investigator Jim Edson look on as Regional Cabled Array technicians Grant Dunn, Mechanical Engineer with the Electronic & Photonic Systems Department at UW-APL, and RCA Chief Engineer Chuck McGuire explain the engineering associated with the RCA profiler mooring during a tour of RCA’s facilities at the University of Washington. Credit: Paul K. Matthias © WHOI.[/media-caption] [media-caption path="https://oceanobservatories.org/wp-content/uploads/2023/02/20230209_123758.jpg" link="#"]NSF Program Director George Voulgaris (left) asks OSU technician Jonathan Whitefield questions about glider operations that provide critical water column data around the moorings of the Coastal Endurance Array. Credit: Paul K. Matthias © WHOI.[/media-caption] [media-caption path="https://oceanobservatories.org/wp-content/uploads/2023/02/20230207_112718.jpg" link="#"]NSF Program Director George Voulgaris (foreground) and RCA Chief Engineer Chuck McGuire discuss the RCA data monitoring systems as OOI PI Jim Edson points to real-time data on the screen being relayed by instrumentation on the Regional Cabled Array. Credit: Paul K. Matthias © WHOI.[/media-caption] [media-caption path="https://oceanobservatories.org/wp-content/uploads/2023/02/20230209_130353.jpg" link="#"]NSF Program Director George Voulgaris (left) gets a hands-on look at the multiple instruments contained on multi-function node that will sit on the bottom of the ocean floor for six months collecting data for the Coastal Endurance Array. Coastal Endurance Array Principal Investigator Ed Dever (middle) and Project Manager Jonathan Fram the functionality of each instrument during the visit to Oregon State University. Credit: Paul K. Matthias © WHOI.[/media-caption]
Read More
Improving Reliability and Availability of Dissolved Oxygen Glider Data
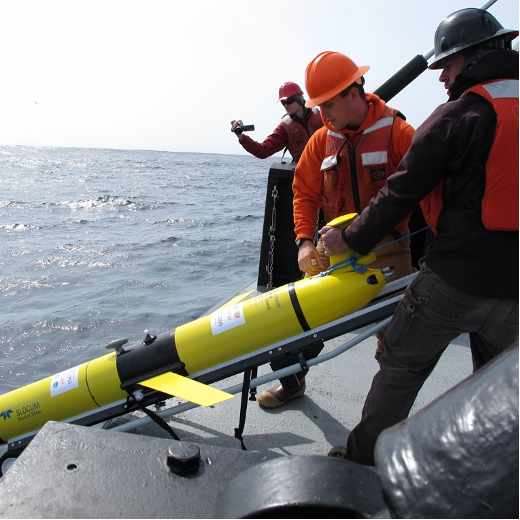
OOI’s Coastal Endurance Array Team is making great strides in ensuring the accuracy of glider dissolved oxygen measurements and making these data readily available to researchers. The team has compared glider oxygen data with independent transects and climatologies compiled by west coast colleagues. They are increasing the number of in situ comparisons of glider oxygen data with bottle samples taken in proximity to the gliders. They have built a benchtop system to do two-point calibrations for oxygen sensors to help ensure their accuracy when the gliders are in the water. And, working with OOI colleagues at WHOI, the team is helping to design and test improved sensor mounts to perform in situ air calibrations of glider oxygen measurements.
“A couple of years ago, Endurance Glider Lead Stuart Pearce developed code to put all of the oxygen data collected by our glider fleet into the DAC, the national central database for glider data,” said Ed Dever, Principal Investigator of the Coastal Endurance Array and Professor at Oregon State University. “Prior to doing this, Stuart examined the data and metadata for any gross errors and issues. That was the first of many steps we have taken to ensure OOI oxygen data are reliable and available so they can be trusted and used by researchers. Our effort is paying off. The glider data available on the DAC are identical to that now available on OOI’s Data Explorer. Endurance glider lines off Newport, OR and Grays Harbor, WA will be the backbone for the northern Californian Current part of the nascent Boundary Ocean Observing Network. The OOI glider lines map seasonal development of hypoxic areas off Oregon and Washington from the coast to the edge of the continental shelf.”
[media-caption path="/wp-content/uploads/2022/11/glider.png" link="#"]More than 137 glider missions have occurred along the Newport and Grays Harbor lines since 2014. Credit: Coastal Endurance Array at OSU.[/media-caption]
Collaborations
Enough oxygen data has been collected and shared in the northeast Pacific that is now possible to make high resolution regional climatologies of temperature, salinity and oxygen. Risien et al. (2022) compiled ~20 years of data taken by Jennifer Fisher (NOAA) and many others, to develop analysis ready transects of water property data off Newport, Oregon. These datasets include both climatologies and individual interpolated, quality-controlled, transect data. The Endurance Team compared glider dissolved oxygen with shipboard CTD samples collected by Fisher along the Newport transect in July 2021. Oxygen measurements from the gliders and CTDs samples compared well and provided confidence that glider and shipboard transects can map hypoxic conditions at comparable resolution and accuracy. Added Dever, “We were able to do a side-by-side comparison of the temperature, salinity, and oxygen data collected by the gliders over our Newport hydrographic line with the CTD data sampled by the Fisher’s team using the R/V Elakha. The comparison was quite good and served to validate the quality of the glider data that are an integral part of the Endurance Array.”
Engineering Solutions
A couple years ago, team member Jonathan Whitefield worked with Scripps Institution for Oceanography to build an oxygen Winkler titration rig so the team can titrate its own oxygen samples. The system can be used both in the lab and onboard to validate glider and moored oxygen data. The titration rig has been used to increase the number bottle samples taken during glider deployments and recoveries and to reduce the time between sample acquisition and analysis.
Building on this, Whitefield and others recently assembled in-house two-point calibration baths for pre- and post deployment of oxygen data collected by gliders and moorings. Calibrations are performed at anoxic and near-saturated conditions. The two-point calibration system is based on a similar one used at Scripps Institution for Oceanography (López-García, P., et al., 2022). A sodium sulfite solution is injected into bottle samples to get the low endpoint oxygen calibration point. The high endpoint oxygen calibration point is achieved using a stirred bath at 10°C to get to near saturation. The high endpoint oxygen is measured with replicate Winkler titrations. The calibration baths better ensure accuracy by making it possible to perform routine in-house checks of vendor calibrations on glider and moored sensors as well as identify calibration drift after deployment.
What’s ahead
Oxygen data are reviewed weekly by operators and annotated. Real-time automated quality control using QARTOD tests is in development. In-situ air calibration tests of oxygen optodes are planned for spring 2023. At the suggestion of outside investigators, OOI’s Coastal and Global Scale Node team at Woods Hole Oceanographic Institution modified Slocum glider optode mounts to allow in-situ air calibrations of dissolved oxygen on the Irminger Sea and Pioneer Arrays. The mount, however, affected the flow around gliders with radome fins and caused navigation problems. Modeling done at WHOI showed these problems may be due to vortices of the optode on the starboard side of the fin. The Endurance gliders will test a new mount placement during its upcoming bi-annual operations and maintenance cruise in March of 2023.
“We’re part of the community of practice for glider oxygen calibration and validation,” said Dever. “We engage with colleagues, adopt standard practices and widely share data. This community of users will help all of us get a better handle on ongoing changes in our ocean regions.”
References
Risien et al. (2022) Spatially gridded cross-shelf hydrographic sections and monthly climatologies from shipboard survey data collected along the Newport Hydrographic Line, 1997–2021, https://doi.org/10.1016/j.dib.2022.107922
López-García, et al. (2022) Ocean Gliders Oxygen SOP, Version 1.0.0. Ocean Gliders, 55pp. DOI: http://dx.doi.org/10.25607/OBP-1756. (GitHub Repository, Ocean Gliders Oxygen SOP.
Read More