
Posts Tagged ‘Regional Cabled Array’
The Regional Cabled Array Seen Through the Eyes of Students
One of the OOI’s greatest strengths is its ability to inspire and train the next generation of ocean scientists through immersive, hands-on research at sea and through the analysis and application of large, complex data sets. Students gain authentic, real-world experience in oceanography—working aboard global-class research vessels utilizing advanced robotic vehicles and learning how to communicate their science effectively to broad and diverse audiences. Through the UW VISIONS at-sea experiential learning program more than 200 students have developed these skills while participating in Regional Cabled Array cruises.
Student outcomes are showcased on Interactiveoceans and span an impressive breadth of scientific inquiry. Recent VISIONS’25 projects include short documentaries demystifying hydrophones and distributed acoustic sensing, genetic analyses of deep-sea organisms, and newly developed technologies to probe the metabolomics of life thriving in the extreme environments of hydrothermal vents. These experiences have translated into numerous senior theses with many students presenting their work at professional scientific conferences.
Among the highlights at Ocean Sciences 2026 conference are VISIONS’24–25 student-led presentations that integrated artificial intelligence and computer vision to quantify benthic communities and spatial ecology at Southern Hydrate Ridge. These innovative analyses revealed new connections between biological patterns and methane seep activity, offering fresh insight into the dynamics of this highly active and rapidly changing environment.
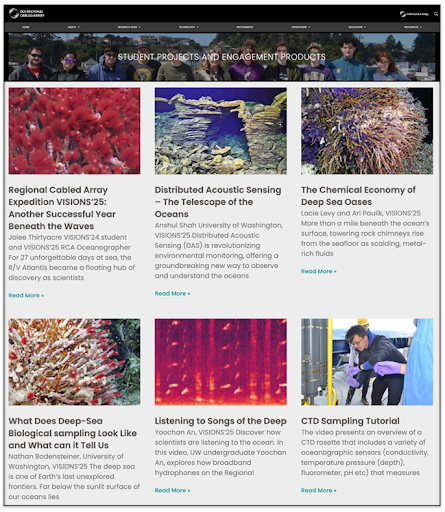
[caption id="attachment_37360" align="alignnone" width="445"] RCA Science Highlight: Student Projects and Engagement Products[/caption]
Read More OOI Regional Cabled Array: December Virtual Office Hours
The Ocean Observatories Regional Cabled Array (OOI-RCA) at the University of Washington School of Oceanography will be hosting our monthly virtual office hours, where we’ll be available to address any data related questions, assist with data access and navigating the data visualization and download system and offer general support.
Hosted by the OOI-RCA data team via Zoom, these sessions are open to all users.
Register HERE.
Read MoreRCA Broadband Provides First Report of Tremor-Like Signals Offshore Cascadia
The recent publication “Possible Shallow Tectonic Tremor Signals Near the Deformation Front in Central Cascadia” (Krauss et al., 2025) presents the first report of tectonic tremor-like signals offshore Cascadia. As described by the authors, deep slow-slip events in Cascadia—lasting from hours to weeks—have been documented by land-based stations for decades. These events can accommodate a significant portion of overall plate motion and may serve as precursors to megathrust earthquakes. Over the past two decades, significant tectonic tremor activity (1–10 Hz) has been observed as a feature of slow slip every 10.5–15.5 months beneath Vancouver Island to northern Oregon (Bombardier et al. 2024), with annual slip events equivalent to a magnitude ~6.5 earthquake. These typically occur well inland, at depths of approximately 30–40 km. Contrastingly, it is unknown whether slow-slip events and accompanying tectonic tremor occur at shallow subduction depths in the offshore region.
Krauss et al. (2025) analyzed data collected 2015-2024 from buried ocean-bottom seismometers (OBS) at two sites: Slope Base (2,920 m depth), located 5 km seaward of the deformation front, and Southern Hydrate Ridge (790 m depth), approximately 20 km landward. The analysis incorporated in-situ bottom current data. After applying short- and long-term averaging techniques, the study identified 85,000 signals at Slope Base and 30,055 at Southern Hydrate Ridge, encompassing T-phase events, ship noise, and tectonic tremor-like signals. Notably, tectonic tremor-like signals were observed exclusively at Slope Base.
These signals cannot be attributed to ship traffic or environmental noise. Instead, they are hypothesized to originate from slow slip on one of many nearby tectonic structures: the décollement fault, faults near the subduction zone front and outermost accretionary wedge, faults on the incoming Juan de Fuca Plate, or nearby strike-slip structures such as the Alvin Canyon Fault. However, without additional observations of these signals on multiple stations, it is unclear whether they are tectonic or represent another signal altogether.
Future deployments, such as those planned through the Cascadia Offshore Subduction Zone Observatory (COSZO) will improve our ability to pinpoint the sources of these offshore tremors. The full dataset and results are available on GitHub (https://github.com/zoekrauss/obs_tremor) and archived on Zenodo (https://zenodo.org/records/14532861).
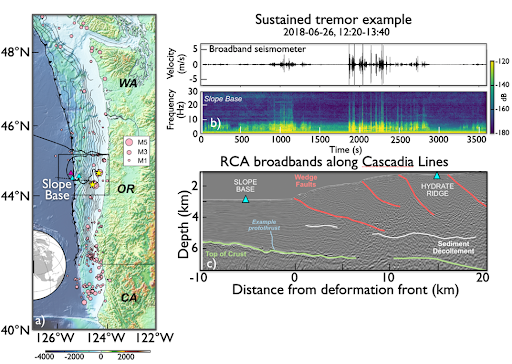
[caption id="attachment_37111" align="alignnone" width="512"] Figure 1. a) Location of the Regional Cabled Array cabled broadband seismometers (OBS’s -cyan triangles) offshore Newport Oregon and an autonomous instrument (purple triangle), earthquakes (pink circles) and along and just offshore the Cascadia Margin. b) sustained tremor-like signals from the broadband at Slope Base. c) Subsurface structure across strike of the margin showing location of Slope Base and Southern Hydrate Ridge OBS’s, accretionary margin faults and demarcation of a boundary interpreted to be a protothrust between the sedimentary column and the incoming Juan de Fuca Plate crust.[/caption]
___________________
References:
Krauss, Z., Wilcock, W.D.S., and Creager, K.C. (2025) Possible shallow tectonic tremor signals near the deformation front in Central Caldera. Seismica, https://seismica.library.mcgill.ca/article/view/1540.
Bombardier, M., Cassidy, J.F., Dosso, S.E., and K. Honn (2024) Spatial distribution of tremor episodes from long-term monitoring in the northern Cascadia Subduction Zone. Journal of Geophysical Research, https://doi.org/10.1029/2024JB029159.
Read MoreKamchatka M8.8 Earthquake and Tsunami’s Reach Across the Pacific to NSF’s OOI Regional Cabled Array
Deborah Kelley1, Joe Duprey1, Wendi Ruef 1, and W. Chadwick2
1University of Washington, 1Oregon State University

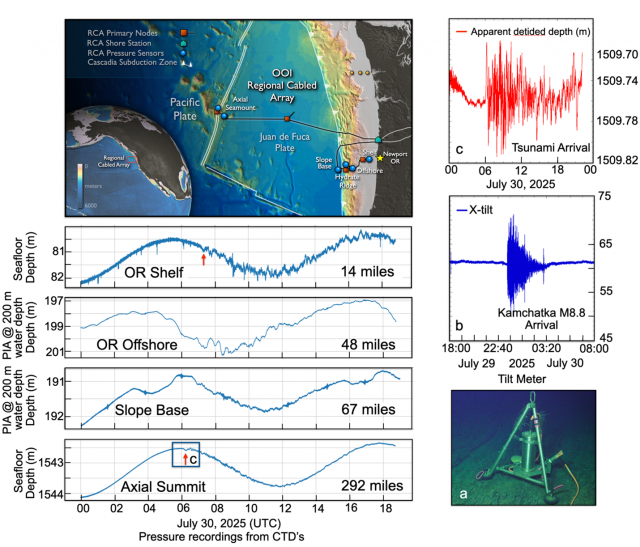
On July 29 at 23:24:52 UTC, a powerful magnitude 8.8 earthquake struck the Kamchatka Peninsula in Russia, unleashing seismic energy and a tsunami that surged across the Pacific Ocean. This extraordinary event was captured in remarkable detail by the NSF Ocean Observatories Initiative’s (OOI) Regional Cabled Array—a seafloor observatory located offshore Oregon and Washington and one of the world’s most advanced underwater monitoring networks, with over 150 instruments transmitting real-time data to shore at the speed of light.
At 23:33:15, the seismic waves from the Kamchatka earthquake reached Axial Seamount, located nearly 300 miles west of the Oregon coast and almost a mile beneath the ocean’s surface, having crossed the entire Pacific in just nine minutes. The vibrations were so intense they rattled a seafloor instrument continuously for over four hours (a,b).
Then, at 06:03:00 UTC on July 30—6 hours and 30 minutes after the quake—the first tsunami waves arrived at Axial Seamount (c). Ultra-sensitive pressure sensor on bottom pressure tilt instruments picked up the waves with astonishing clarity. Lower-resolution sensors across the array also tracked the tsunami’s journey toward the UW west coast. Racing at speeds of 270 miles per hour, the first wave swept across the Juan de Fuca Plate and over the Cascadia Subduction Zone, eventually reaching seafloor monitoring instruments at the Oregon Shelf site just 14 miles offshore from Newport, Oregon. The OOI Regional Cabled Array instruments showed that the Pacific Ocean reverberated with smaller waves for several days after the first tsunami waves arrived—echoes of one of the most powerful seismic events ever recorded.
This event highlights not only the dynamic nature of our planet and the seismic and tsunami hazards that we have to be prepared for in the Pacific Northwest, but also the incredible capability of modern science to observe and understand these kinds of events—in real time from deep beneath the ocean’s surface, and the value of such monitoring to coastal communities.
The audio, captured by hydrophones at Axial Seamount, reveals the moment the M8.8 earthquake arrived:
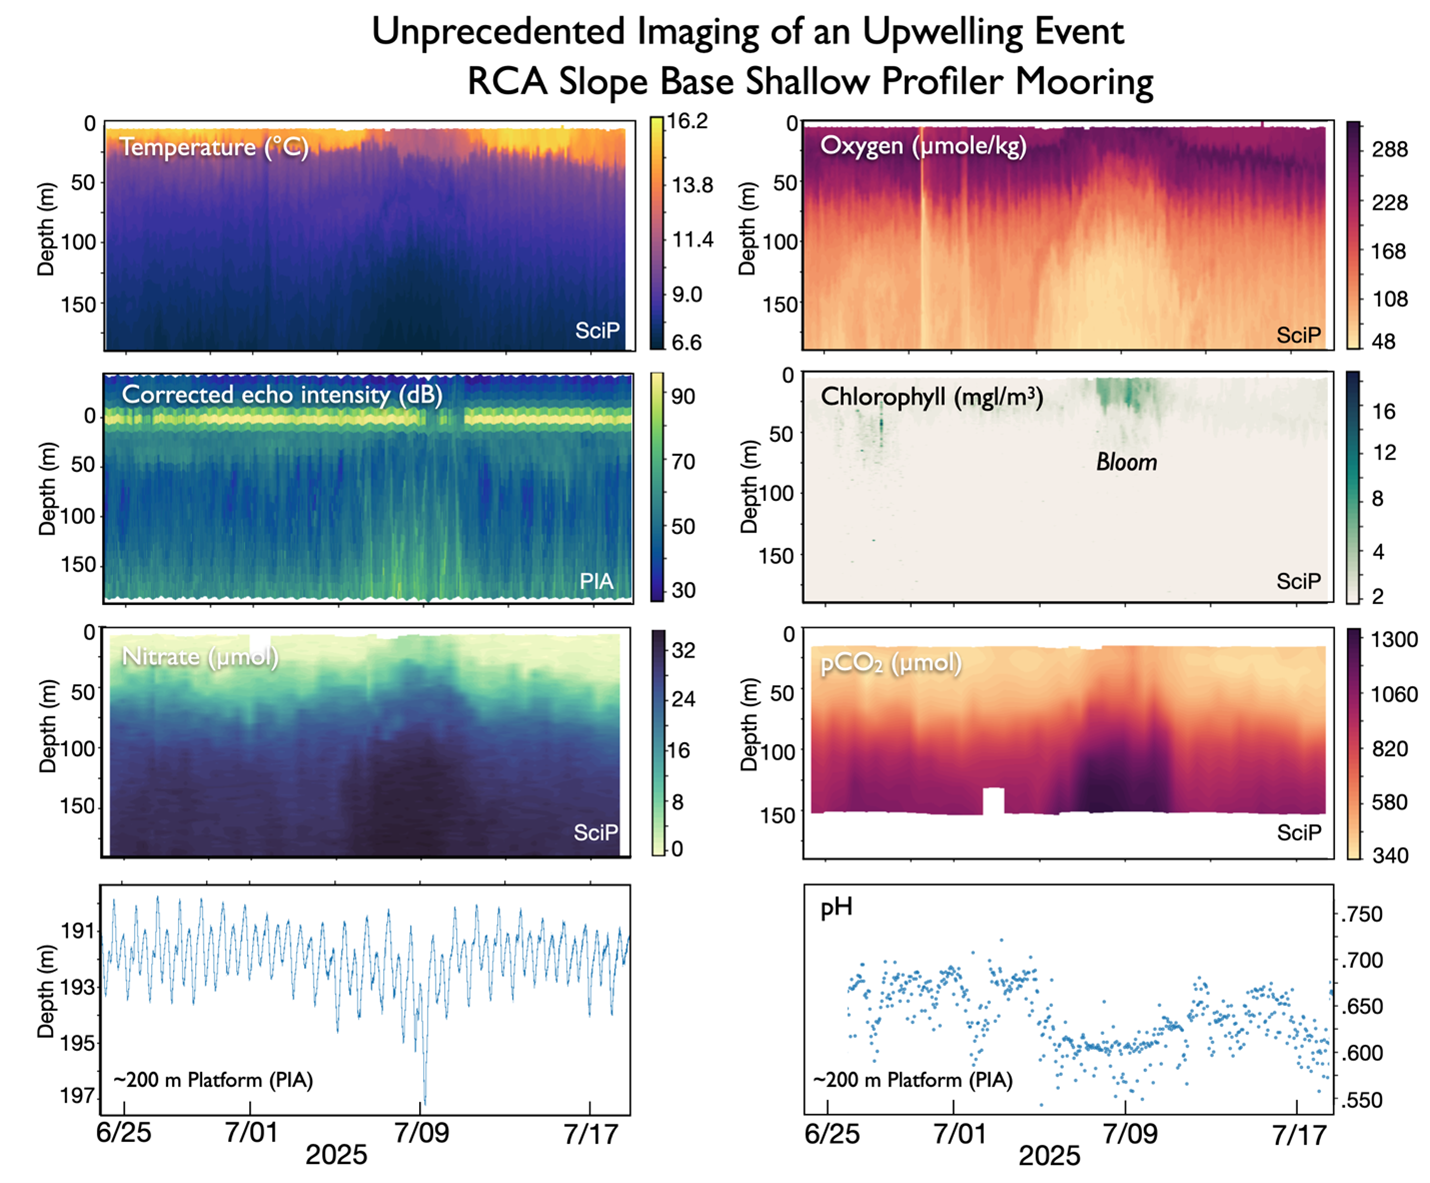
[audio mp3="https://oceanobservatories.org/wp-content/uploads/2025/08/kamchatka_Axial_Arrival.mp3"][/audio] Read MoreUnprecedented Imaging of an Upwelling Event: RCA Slope Base Shallow Profiler Mooring
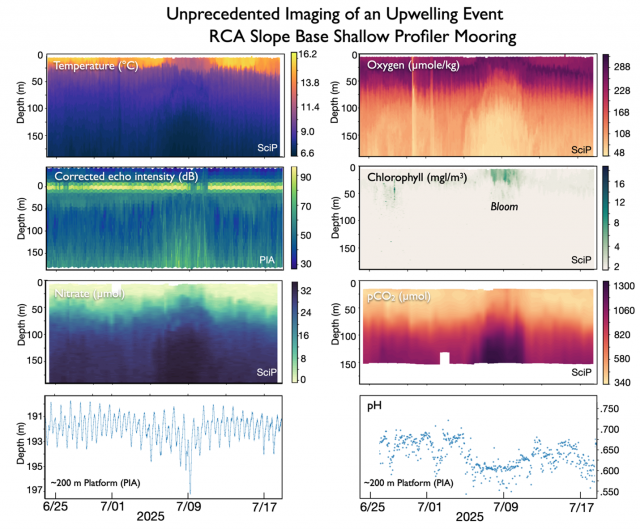
Co-registered instruments on the Slope Base Shallow Profiler Mooring, located 108 km offshore Newport, Oregon, yield unprecedented high resolution imagery of a possible short-lived upwelling event and resultant bloom, ~July 5-13, 2025. The above plots from live streaming data from sensors on the stationary platform interface assembly (PIA) located at ~ 200 m water depth (150 kHz ADCP, CTD-O2, and pH), and on an instrumented winched science pod (SciP)(CTD-O2, nitrate, pCO2, 3 wavelength fluorometer), which traverses 9 times a day from ~ 200 m to ~ 5 m beneath the ocean’s surface, highlight the arrival of cold, nutrient-rich water to the surface layers, coinciding with elevated chlorophyll-A concentrations and increased echo intensity in the ADCP data, as well as increased pCO2 and decreased dissolved oxygen concentrations at depth. These trends are coincident with a decrease in temperature, conductivity, dissolved oxygen concentrations, and pH on the PIA. In contrast to the SciP chlorophyll profile, which indicate a bloom in the surface waters above 50 meters, the PIA chlorophyll-A concentrations show no active blooms in the deeper waters. Interestingly, this event coincides with an increase of sea water pressure as measured at the 200 platform, indicating possible current forcing from the NE (and eddy?) acting to “blow down” the platform by ~ 6 m. Several other blow down events have occurred at the Slope Base and Oregon Offshore sites, the largest of which in the summer of 2019 blew the Slope Base platform nearly 50 m deeper and ~350 m to the west.
Soundscapes Spanning the Oregon Margin and 300 Miles Offshore

 Figure 32: An example of a daily spectrogram generated by the RCA Data Team spectrogram viewer. A Humpback whale song is visible throughout the day at ~40-1000 Hz. A chorus of Fin Whale vocalizations is visible at 20-40 Hz. A weather event is visible at 0100, and a ship passage at 2200.[/caption]
The Regional Cabled Array (RCA) operates six broadband hydrophones that continuously capture soundscapes across the Cascadia Margin (Oregon Shelf and Oregon Offshore – seafloor), near the toe of the margin (Slope Base -seafloor and 200 m water depth) and 300 miles offshore at Axial Seamount (Axial Base – seafloor and 200 m water depth). The hydrophones, operational since 2014, capture signals from 10-64,000 Hz, including vessel traffic, marine mammal vocalization, wind, surf, and seismic events. The RCA broadband acoustic archive currently contains forty years (350,000 hours) of acoustic data in miniSeed format.
The RCA Data Team has developed a pipeline that can summarize and visualize a year of hydrophone data in 30 minutes. The spectrograms output (see Figure 32) by this pipeline are now easily accessible through an interactive viewer on the RCA’s Data Dashboard. The spectrogram viewer will make OOI-RCA broadband hydrophone data more searchable and accessible to data users and strengthen QA/QC of RCA acoustic data. Any day of hydrophone data, since 2014, will be viewable in minute/hybrid-millidecade resolution. The pipeline also enables users to convert RCA acoustic data to audio format (FLAC or WAV) in bulk. The spectrogram viewer was developed with input and guidance from the Ocean Data Lab at University of Washington and the Monterey Bay Aquarium Research Institute Soundscape team. It utilizes open source acoustic software tools – ooipy, pypam, and mbari-pbp.
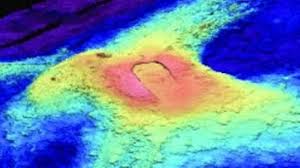
Read MoreThe Pacific Northwest’s most active underwater volcano is getting ready to erupt

Three hundred miles off the coast of Oregon and more than 4,900 feet below the surface of the Pacific Ocean, one of the Pacific Northwest’s least famous — but most active — volcanoes is showing signs that it will soon erupt for the first time since 2015.
Read more from the University of Washington’s College of the Environment.
Read MoreOOI-RCA Data Team Monthly Virtual Office Hours for Data Access and Support
The Ocean Observatories Regional Cabled Array (OOI-RCA) at the University of Washington School of Oceanography is excited to introduce our monthly virtual office hours, where we’ll be available to address any data related questions, assist with data access and navigating the data visualization and download system and offer general support. Hosted by the OOI-RCA data team via Zoom, these sessions are open to all users.
Details: Monday, June 9th from 1-2pm PT/4-5pm ET
Read MoreRegional Cabled Array Tracks Axial Seamount’s Impending Eruption
The Regional Cabled Array, a network of over 660 miles of undersea cables with more than 140 monitoring instruments, provides real-time data on the Axial Seamount, making it the most extensively studied undersea volcano. This system has detected magma reservoir inflation and increased seismic activity, key indicators that an eruption is likely before the end of 2025.
Read more from the Herald-Tribune.
Read MoreBringing Computer VISION into the Classroom Utilizing RCA Imagery and the OOI Jupyter Hub

There is a rapidly growing demand in Earth system science for workforce expertise in machine learning. To increase marine science students understanding of, and ability to use, artificial intelligence tools, Dr. Katie Bigham and School of Oceanography undergraduate student Atticus Carter are teaching an undergraduate class focused on applying “computer vision” (processing imagery with the computer) to marine science problems. The Computer Vision Across Marine Sciences prototype course for UW undergraduates in the Ocean Technology program includes the development of a Jupyter Binder (a notebook collecting multiple Jupyter Notebooks). Currently, an enormous amount of time is required to manually process imagery collected in marine environments, resulting in a major bottleneck for all research utilizing marine imagery. In this course, students gain an understanding of computer vision capabilities, model training and evaluation, and research applications. The course utilizes real-world datasets from the OOI Regional Cabled Array (RCA), including imagery from remotely operated vehicles utilized on RCA cruises and fixed camera imagery on the array, and from other systems, exposing students to diverse marine habitats. For their final projects, students will develop bespoke models utilizing datasets of their choosing, including RCA imagery. Students can employ the OOI Jupyter Hub for additional computational power, facilitating easy access to imagery and necessary resources. In collaboration with a faculty member in the UW School of Education quantitative data are collected on student learning and feedback for course improvement. The open-access course text is actively under development and is accessible at OceanCV.org. The team aims to improve the materials based on student feedback. Carter will present findings and learnings from the first version of the class at ASLO 2025 Aquatic Sciences Meeting in the Building Data Literacy Skills in the Next Generation of Aquatic Scientists session hosted by OOI Data Labs.
[caption id="attachment_35685" align="alignnone" width="640"] Figure 27: Introductory page for Computer Vision Across Marine Sciences Jupyter Binder and example of artificial intelligence-based predictions of animals in imagery collected by the Regional Cabled Array digital still camera at Southern Hydrate Ridge. This work is supported by an NSF OCE Postdoctoral Research Fellowship to Dr. K. Bigham, University of Washington.[/caption]
Read More