
Posts Tagged ‘Science Highlights’
Bringing Computer VISION into the Classroom Utilizing RCA Imagery and the OOI Jupyter Hub

There is a rapidly growing demand in Earth system science for workforce expertise in machine learning. To increase marine science students understanding of, and ability to use, artificial intelligence tools, Dr. Katie Bigham and School of Oceanography undergraduate student Atticus Carter are teaching an undergraduate class focused on applying “computer vision” (processing imagery with the computer) to marine science problems. The Computer Vision Across Marine Sciences prototype course for UW undergraduates in the Ocean Technology program includes the development of a Jupyter Binder (a notebook collecting multiple Jupyter Notebooks). Currently, an enormous amount of time is required to manually process imagery collected in marine environments, resulting in a major bottleneck for all research utilizing marine imagery. In this course, students gain an understanding of computer vision capabilities, model training and evaluation, and research applications. The course utilizes real-world datasets from the OOI Regional Cabled Array (RCA), including imagery from remotely operated vehicles utilized on RCA cruises and fixed camera imagery on the array, and from other systems, exposing students to diverse marine habitats. For their final projects, students will develop bespoke models utilizing datasets of their choosing, including RCA imagery. Students can employ the OOI Jupyter Hub for additional computational power, facilitating easy access to imagery and necessary resources. In collaboration with a faculty member in the UW School of Education quantitative data are collected on student learning and feedback for course improvement. The open-access course text is actively under development and is accessible at OceanCV.org. The team aims to improve the materials based on student feedback. Carter will present findings and learnings from the first version of the class at ASLO 2025 Aquatic Sciences Meeting in the Building Data Literacy Skills in the Next Generation of Aquatic Scientists session hosted by OOI Data Labs.
[caption id="attachment_35685" align="alignnone" width="640"] Figure 27: Introductory page for Computer Vision Across Marine Sciences Jupyter Binder and example of artificial intelligence-based predictions of animals in imagery collected by the Regional Cabled Array digital still camera at Southern Hydrate Ridge. This work is supported by an NSF OCE Postdoctoral Research Fellowship to Dr. K. Bigham, University of Washington.[/caption]
Read More Irminger Sea Carbon Cycle
The high-latitude North Atlantic, a region with high phytoplankton production in the spring and deep convection in the winter, is of particular importance for the global carbon cycle. The vertical transport of carbon from near the surface into the deep ocean, by combination of biological and physical processes, is known as the biological carbon pump. The carbon pump is particularly active in the Irminger Sea, yet the carbon budget, and its seasonal and interannual variability, are poorly known. A study by Yoder et al. (2024) used carbon system data from multiple observational assets (moorings and CTD casts) of the OOI Irminger Sea Array to assess net community production in the mixed layer and the implications for the biological pump in this region.
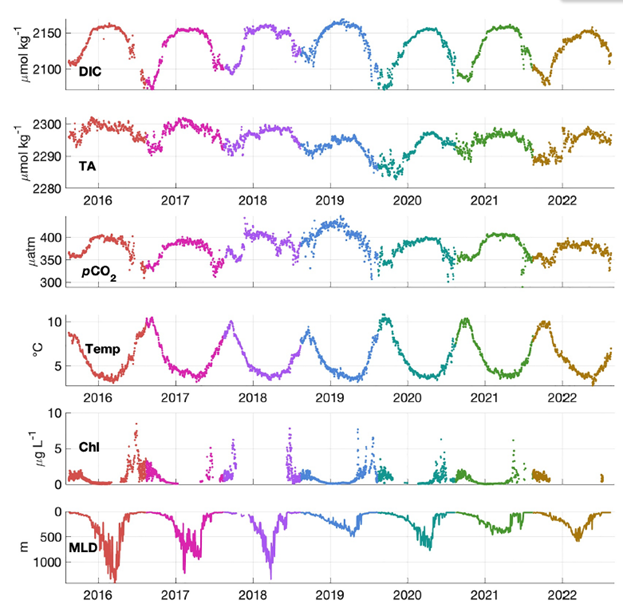
Data analysis was challenging, because it involved working with multiple instrument types, gappy records, calibration offsets, and other idiosyncrasies. In addition, data from multiple instruments and observing platforms needed to be combined to produce continuous records. The primary sensors utilized were pH and pCO2. These are difficult sensors to work with, to the extent that a community workshop was convened to develop a “users guide” to best practices for analysis (Palevsky et al., 2023). Yoder et al. were able to quality control, cross-calibrate, and merge data from the OOI surface mooring, flanking moorings, gliders and shipboard CTD casts (Fogaren and Palevsky 2023; Palevsky et al. 2023) to create the first multi‐year time series of the inorganic carbon system for the Irminger Sea mixed layer. This remarkable data set, based on instruments with sample rates of 1-2 hours, provides a seven-year record with near-daily resolution (Figure 28).
The time series results (Figure 3) showed that carbon system variables (dissolved inorganic carbon (DIC), total alkalinity (TA), and partial pressure of CO2 (pCO2)) co-vary through the annual cycle, with minimums in late summer at the end of the productive season and maximums in winter. The summer draw-down of pCO2 indicates that biophysical effects, rather than temperature, are the primary drivers of pCO2 variability. The influence of vertical mixing and primary productivity can be clearly seen in DIC and TA. In the subpolar North Atlantic, shoaling of the mixed layer in spring is generally associated with spring phytoplankton blooms, as indicated by increasing chlorophyll (Chl) concentration. Interestingly, it is found that highest integrated rates of DIC removal from the mixed layer via photosynthesis take place prior to mixed layer shoaling.
After a thorough analysis that included mixed layer budgets of DIC and TA, followed by assessment of gas exchange, physical transport, and the hydrologic cycle, the authors conclude that strong biological drawdown is the primary removal mechanism of inorganic carbon from the mixed layer. Furthermore, they point out the importance of interannual variability in both the drivers of and resulting magnitude of surface carbon cycling. This is primarily due to variability in net community production. Acknowledging the challenges taken on by OOI to maintain an array in the Irminger Sea, the authors note that “collecting observational data is both costly and challenging, however if only 1 year of data is collected or multiple years are averaged together, [carbon system dynamics] … will be misrepresented.”
This project shows the potential for OOI data, with appropriate processing and analysis, to provide unique insights into the ocean carbon system. It is notable that the authors made a substantial effort to calibrate and combine data from multiple instruments and moorings, and to take advantage of ancillary data (e.g. gliders, OOI CTD casts, and non-OOI CTD casts) in their processing. Enabling this type of analysis was a goal in the design of the multi-platform OOI Arrays and shipboard validation protocols.
[caption id="attachment_34983" align="alignnone" width="623"] Time series of dissolved inorganic carbon (DIC), total alkalinity (TA), partial pressure of CO2 (pCO2) temperature, chlorophyll-a (Chl), and mixed layer depth (MLD) in the Irminger Sea mixed layer from 2015-2022. Colors identify annual cycles. From Yoder et al., 2024.[/caption]
___________________
References:
- Fogaren, K. E., Palevsky, H. I. (2023) Bottle-calibrated dissolved oxygen profiles from yearly turn-around cruises for the Ocean Observations Initiative (OOI) Irminger Sea Array 2014 – 2022. Biological and Chemical Oceanography Data Management Office (BCO-DMO). Version Date 2023-07-19 doi:10.26008/1912/bco-dmo.904721.1
- Palevsky, H.I., S. Clayton and 23 co-authors, (2023).OOI Biogeochemical Sensor Data: Best Practices & User Guide Global Ocean Observing System, 1(1.1), 1–135. https://doi.org/10.25607/OBP-1865.2
- Palevsky, H. I., Fogaren, K. E., Nicholson, D. P., Yoder, M. (2023) Supplementary discrete sample measurements of dissolved oxygen, dissolved inorganic carbon, and total alkalinity from Ocean Observatories Initiative (OOI) cruises to the Irminger Sea Array 2018-2019. Biological and Chemical Oceanography Data Management Office (BCO-DMO). Version Date 2023-07-19 doi:10.26008/1912/bco-dmo.904722.1
- Yoder, M. F., Palevsky, H. I., & Fogaren, K. E. (2024). Net community production and inorganic carbon cycling in the central Irminger Sea. J. Geophys. Res., 129, e2024JC021027. https://doi.org/10.1029/2024JC021027
Impact of Ocean Model Resolution on Temperature Inversions in the Northeast Pacific Ocean
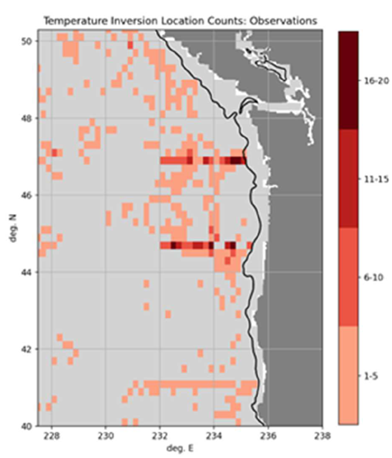
Temperature inversions are a local vertical minimum in temperature located at a shallower depth than a local maximum. In the Northeast Pacific, several water masses and multiple mechanisms for transforming or advecting ocean temperature (cold air events, upwelling, river discharge, cross-shelf eddy transport) create favorable conditions for temperature inversions. Modeling these temperature inversions is challenging. Osborne et al. (2023) analyze observations from 2020 and 2021 to characterize inversions in the Northeast Pacific. The data for these observations come largely from OOI Endurance Array gliders accessed through the GTS database. They compare the observed inversions to model results from the U.S. Navy’s Global Ocean Forecast System version 3.1 (GOFS 3.1) and two instances of the Navy Coastal Ocean Model. Temperature inversions are observed to be present in about 45% of profiles with temperature minimums between 50 – 150 m, temperature maximums between 75 – 175 m, and inversion thickness almost entirely less than 40 m. Modeled temperature inversions are present in only about 5% of model-observations comparisons, with weaker, shallower minimums. This is attributed to two primary causes: coarse model resolution at the inversion depth and the assimilation process which low-pass filters temperature, making inversions weaker. Osborn et al. identify additional work to test the impact of vertical grids on improving model performance.
[caption id="attachment_34977" align="alignnone" width="392"] Maps of inversion counts for observed profiles collected during 2020-2021 and analyzed in this work. Profiles have been filtered to be offshore of the 200 m isobath and to only one profile per collection platform per day (e.g., one profile per glider per day). Black line near the coast marks the 200 m isobath. Light gray indicates no profiles collected during the study period.[/caption]
___________________
References:
J. Osborne V, C. M. Amos and G. A. Jacobs, “Impact of Ocean Model Resolution on Temperature Inversions in the Northeast Pacific Ocean,” OCEANS 2023 – MTS/IEEE U.S. Gulf Coast, Biloxi, MS, USA, 2023, pp. 1-8, doi: 10.23919/OCEANS52994. 2023.10337390.
Read MoreNew Hints When Axial Might Erupt: Precursor Events Detected Through Machine Learning
A recent paper by Wang et al., “Volcanic precursor revealed by machine learning offers new eruption forecasting capability” [1] describes the characterization of time-dependent spectral features of earthquakes at Axial Seamount prior to the 2015 using unsupervised machine learning (this method applies algorithms to analyze data without humans in the loop). A major finding from this work is the identification of a distinct burst of mixed-frequency earthquake (MEF) signals that rapidly increased 15 hours prior to the start of the eruption, peaked one hour before lavas reached the seafloor, and earthquakes at Axial Seamount prior to the 2015 using unsupervised machine learning (this method applies algorithms to analyze data without humans in the loop). A major finding from this work is the identification of a distinct burst of mixed-frequency earthquake (MEF) signals that rapidly increased 15 hours prior to the start of the eruption, peaked one hour before lavas reached the seafloor, and migrated along pre-existing faults. The earthquakes are thought to reflect brittle failure driven by magma migration and/or degassing of volatiles. The source mantle beneath Axial Seamount contains extremely high CO2 concentrations leading to high concentrations in the melts [3,4]. MEFs were detected for months prior to the eruption, which could result from volatile release associated with inflation of the sills that feed Axial [5]. Importantly, the identification of these signals may help forecasting of the upcoming Axial eruption and may also be applied to other active volcanoes.
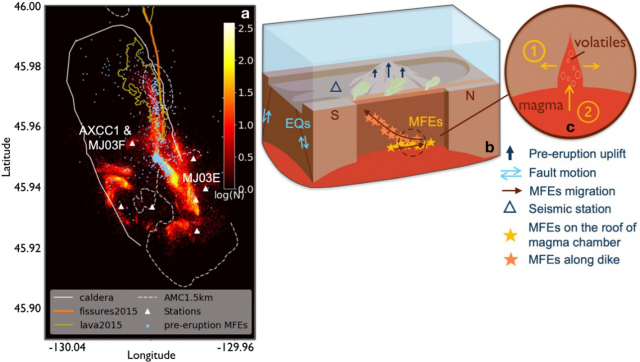
The authors utilized a wealth of geophysical data from the past decade to present an integrated view of Axial (Figure 1) including a subset of earthquake data 4 months prior to the eruption (67,767 out of their >240,000 earthquake catalogue from the RCA seismic array [2]), coupled with bottom pressure from BOTPT instruments at the Central Caldera and Eastern Caldera sites, and 3D modeling.
[caption id="attachment_34973" align="alignnone" width="640"]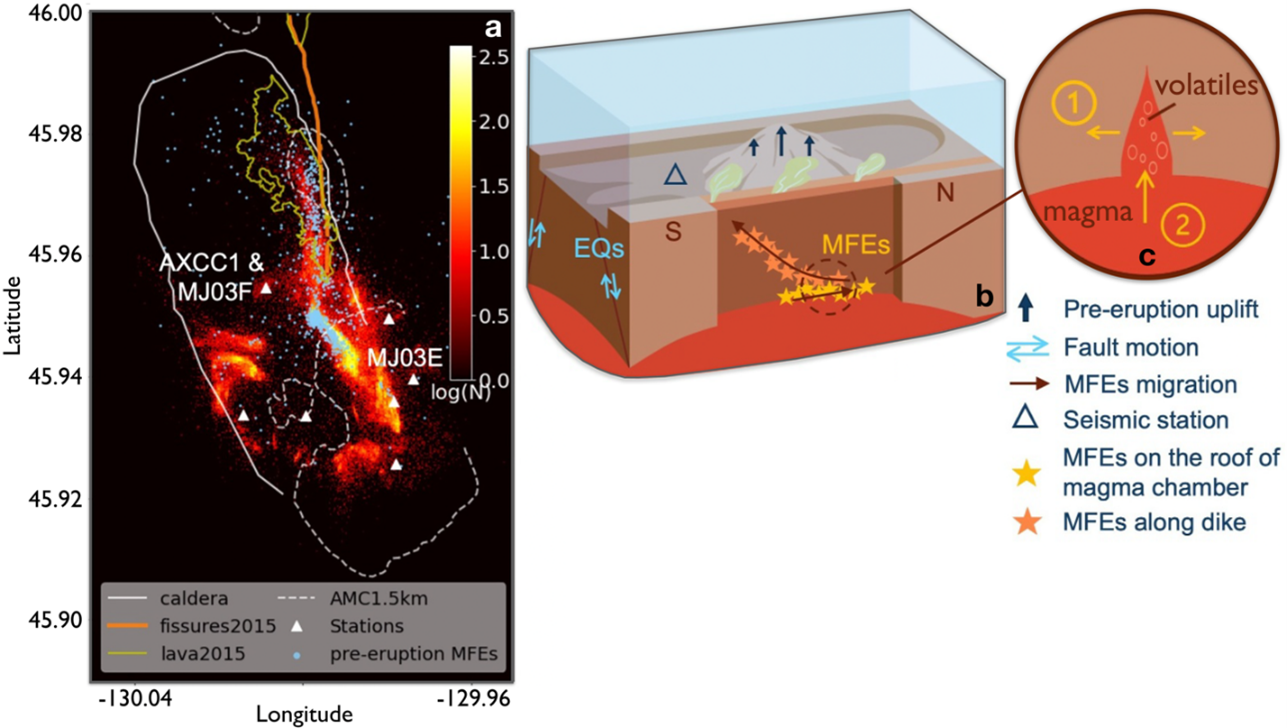 After Wang et al., 2024 [1] Figures 1 and 4: a) Heatmap of earthquake density at Axial Seamount from Nov 2014 to Dec 2021 [2]. Image highlights mixed‐frequency earthquakes (MFEs – light blue dots) one day before the eruption, the caldera rim (white solid line), the 1.5 km depth contour of the Axial magma chamber (AMC)(dashed white line), eruptive fissures (orange lines), lava flows of the 2015 eruption (yellow lines), the location of the RCA short-period seismometer array (white triangles),broadband seismometer AXCC1 and bottom pressure tilt instruments (MJ03E and MJ03F. Heatmap shows the number of earthquakes in each 25 m × 25 m bins. b) Cartoon summarizing observations. Tidally‐driven earthquakes occur on caldera ring faults, while the MFEs track movement of volatiles and magma prior to the eruption. c) possible mechanisms of the MFEs. ① and ② correspond to crack opening and volatile/magma influx processes.[/caption]___________________
References:
[1] Wang, K., F. Waldhouser, M. Tolstoy, D. Schaff, T. Sawi, W.S.D. Wilcock, and Y.J. Tan (2024) Volcanic precursor revealed by machine learning offers new eruption forecasting capability. Geophyiscal Research Letters, 51 (19) https://doi.org/10.1029/2024GL108631.
[2] Wang, K., F. Waldhouser, D.P. Schaff, M. Tolstoy, W.S.D. Wilcock, and Y.J. Tan (2024) Real-time detection of volcanic unrest and eruption at Axial Seamount using machine learning. Seismological Research Letters, 95, 2651–2662, doi: 10.1785/0220240086.
[3] Helo, C., M.-A. Longpre, N. Shimizu, D.A. Clague and J. Stix. (2011) Explosive eruptions at mid-ocean ridges driven by CO2-rich magmas. Nature Geoscience. 4, 260–263 (2011). https://doi.org/10.1038/ngeo1104.
[4] Dixon, J. E., E. Stolper, E., and J.R. Delaney (1988). Infrared spectroscopic measurements of CO2 and H2O in Juan de Fuca Ridge basaltic glasses. Earth and Planetary Science Letters, 90(1), 87–104. https://doi.org/10.1016/0012‐821x(88)90114‐8.
Read MoreScience Highlights
Researchers from around the globe are using OOI data to identify short-term changes and long-term trends in the changing global ocean.
The Science Highlights included in the report below were compiled from quarterly reports submitted by the Ocean Observatories Initiative to the National Science Foundation from 2020-2022. They represent only a fraction of the scientific findings that are based on OOI data. A complete list of peer-reviewed publications based on OOI data can be found here.
[embed]https://issuu.com/oceanobservatoriesinitiative/docs/ooi_science_highlights_autosaved_.pptx?fr=sNzM0ZjQ2ODUxNTQ[/embed]
Read More