
Posts Tagged ‘William Chadwick’
Regional Cabled Array: Monitoring Axial Seamount in Real Time
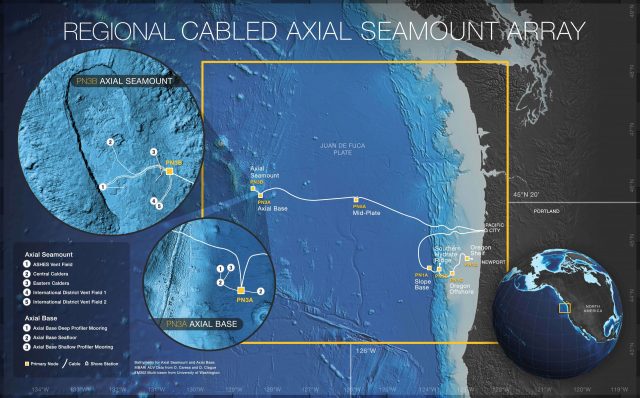
The Regional Cabled Array (RCA) is the world’s most extensive undersea volcano monitoring system, located off the Oregon coast. Operated by the University of Washington as part of the Ocean Observatories Initiative (OOI), the RCA features a network of submarine cables extending 200 miles offshore from Pacific City and Newport. This system monitors the Axial Seamount, a submarine volcano expected to erupt this year.
In a recent interview, Deb Kelley, OOI Principal Investigator and Director at the University of Washington School of Oceanography, discussed how the RCA collects near-time data to track seismic activity, hydrothermal systems, and chemical changes associated with volcanic activity. The RCA’s data supports long-term research on ocean dynamics and tectonic processes, providing critical insights into the Earth’s underwater systems.
Watch the full interview with KPTV FOX 12 here: https://www.youtube.com/watch?v=PUJMTdka8KI
[caption id="attachment_35589" align="alignnone" width="640"] Credit: Center for Environmental Visualization, University of Washington[/caption]
Read More Axial Seamount: The Phoenix Rises
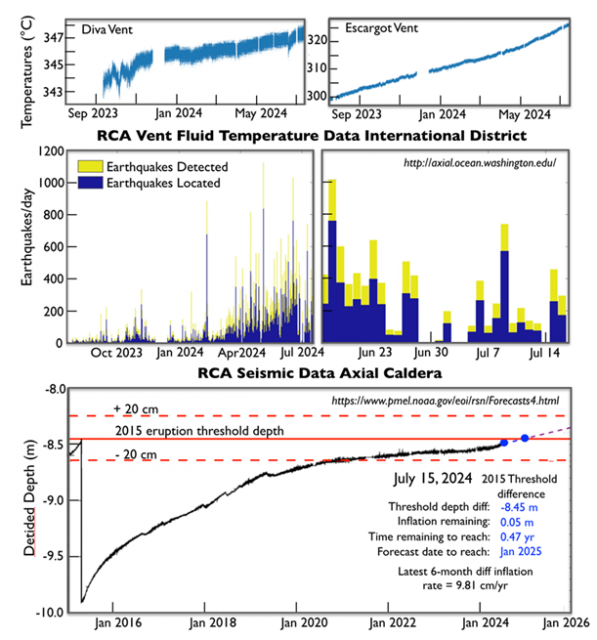
Regional Cabled Array live data feeds from the bottom pressure tilt, seismic, and temperature-resistivity instruments are capturing a marked increase activity at Axial Seamount with total seafloor uplift approaching the threshold depth for the 2015 eruption. As noted by W. Chadwick (OSU), whose website provides daily forecasts, the average differential inflation rate has almost doubled in the last six months. Bottom pressure tilt data at the Central and Eastern Caldera sites, show a marked increase in uplift beginning in April increasing from ~ 6 cm/yr to ~10 cm/year. The increase in uplift rates is coincident with a dramatic increase in seismic activity [viewable on daily plots of earthquakes accessible on W. Wilcock’s Axial Earthquake Catalogue (UW)] with >1000 earthquakes in a 24 hr period also occurring in April: seismic activity remains, high, but has not reached the 1000’s per day as detected prior to the April 2015 eruption (Wilcock et al, 2016). The hydrothermal system in the International District Hydrothermal Field, located on the eastern rift zone within Axial Caldera, is also responding to this increased activity. Fluid temperatures measured by the temperature-resistivity sensor in a parasitic orifice on the side of the hydrothermal vent Escargot show an increase in the past 6 months, with a marked change in the past 3 months (Courtesy of W. Ruef, UW). Excitement is building as we watch this dynamic volcano respond to melt migration 2 km below the seafloor – January 2025 is not far away.
[caption id="attachment_34576" align="alignnone" width="597"] RCA bottom pressure tilt data Central Caldera Axial Seamount[/caption]
Read More Axial Seamount Continues to Reveal Its Secrets
Adapted and condensed by OOI from Chadwick et al., 2022, doi:/10.1029/2021GC010153.
Axial Seamount is the longest monitored mid-ocean ridge volcano, providing new insights into the relationships among magma supply, uplift-deflation behavior, and seismicity leading to and follow eruptions. Results are as summarized here.
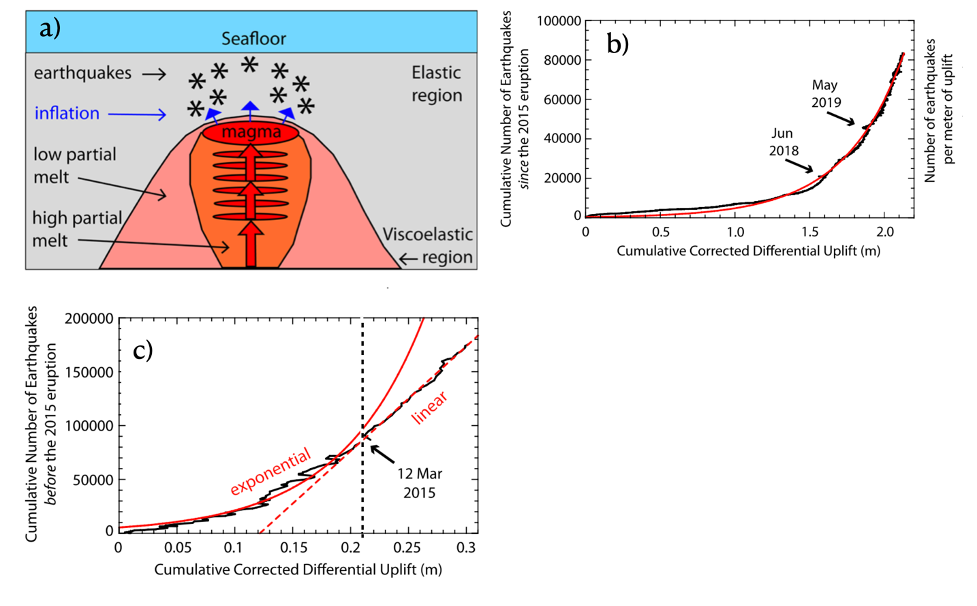
[media-caption path="/wp-content/uploads/2022/02/Axial.png" link="#"]a) Cross section cartoon showing shallow magma chamber beneath Axial fed by a series of stacked sills. Upward migrating of melt through the sills results increases pressure in the shallow chamber causing uplift and associated earthquakes. b) Exponential increase in earthquakes per meter of uplift since the 2015 eruption. c) Earthquakes per meter of uplift before March 12, 2015 follow an exponential increase, while post this day earthquakes follow a linear trend leading up to the April 24, 2015 eruption. (After Chadwick et al., 2022; Figures 6 and 13).[/media-caption]The magma supply rate has changed significantly over periods of months to years. Since the 2015 eruption, the summit of the volcano has been inflating at a decreasing rate. This re-inflation was punctuated by eight discrete short-term deflation events occurring over 1-3 weeks, approximately every 4-6 months from August 2016 to May 2019. These deflation events were coincident with an abrupt decrease in seismic activity, which did not pick up until reinflation resumed. In contrast, the long-term monitoring indicates that there was a surge in magma supply between 2011 and 2015, resulting in the two eruptions closely spaced in time.
Although the summit of the volcano has inflated 85%-90% of its pre 2015 eruption level, the geodetic and seismic monitoring suggests that the magma supply rate has been waning since 2015, pushing the forecast for the next eruption out 4-9 years. The data since 2015 also show that the deformation and seismic activity are tightly coupled, showing an exponential increase in seismic activity per unit of uplift. A significant conclusion from this study is that the transition from an exponential to linear increase in seismic activity to total uplift may indicate impending crustal failure between the shallow magma chamber and the seafloor. In concert, these results may lead to more refined forecasting of future eruptions of this highly active volcano and the testing of hypotheses concerning the short-term deflation events.
__________________________________________________________
Chadwick, W.W., Jr., W.S.D. Wilcock, S.L. Nooner, J.W Beeson, A.M. Sawyer, and T.-K. Lau (2022) Geodetic monitoring at Axial Seamount since its 2015 eruption reveals a waning magma supply and tightly linked rates of deformation and seismicity. Geochemistry, Geophysics, Geosystems, 23, e2021GC01053.
Read More